Houston Economic Indicators

February 6, 2020
In the final months of 2019, healthy but slowing job growth and a low and generally stable unemployment rate contributed to an expanding economy, as measured by the Houston Business-Cycle Index. Even so, recent movements in the Houston Leading Index suggest moderating job growth in the months ahead. While global exports declined in 2019, Houston exports continued to grow, albeit more slowly, with oil and gas exports leading the way.
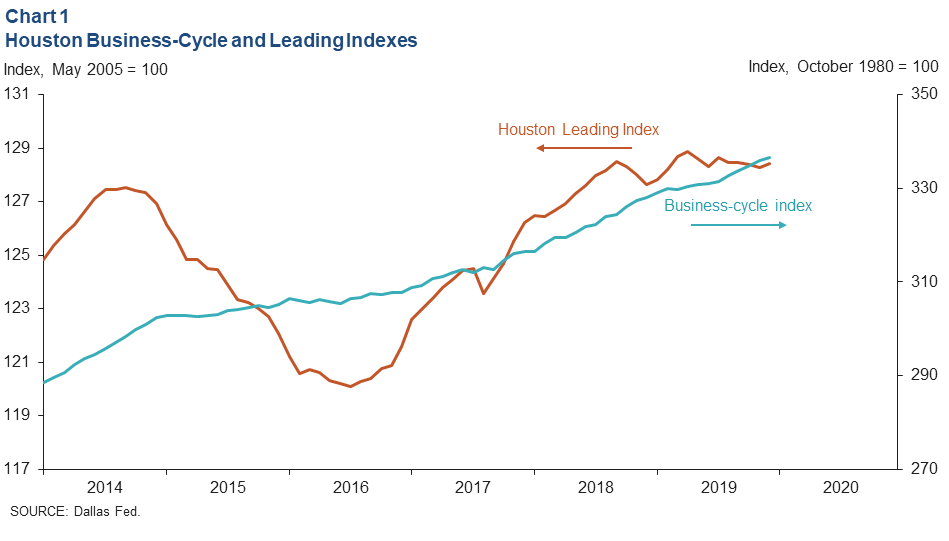
Business-Cycle and Leading Indexes
The Houston Business-Cycle Index rose an annual 3.2 percent in December from the three months prior (Chart 1). The reading suggests that the broader Houston economy expanded at a healthy pace in the final months of 2019. In contrast, an index of 11 leading indicators for Houston was essentially flat to down slightly in the second half of 2019.
Employment
Job Growth Below Average Last Year
Houston employment grew 2.2 percent in the final three months of 2019 (Chart 2). Nearly all industries reported job growth—particularly professional and business services (6,100 jobs) and education and health services (5,600). Leisure and hospitality (-100) logged a slight drop over that time, and mining and logging (-1,300) declined sharply to close out a down year.
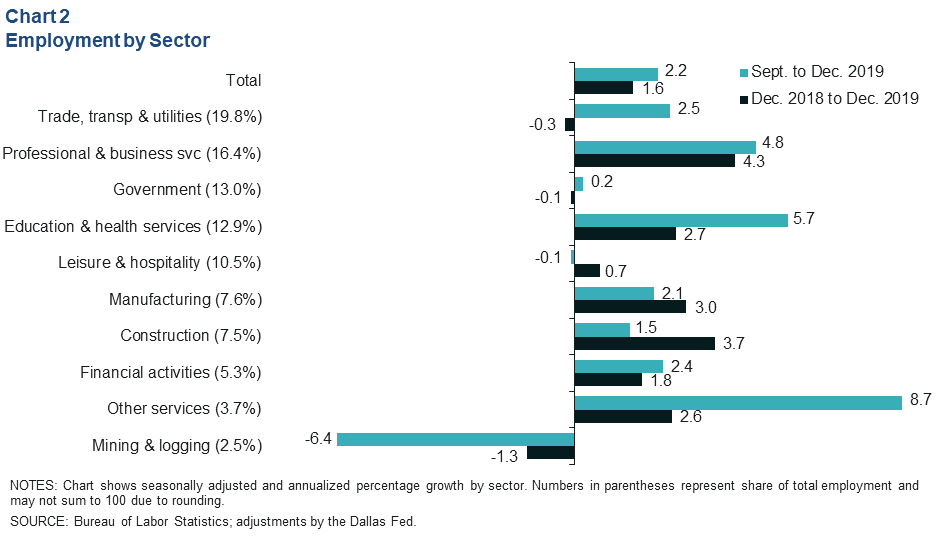
Houston jobs grew more slowly from December 2018 to December 2019 at 1.6 percent (49,000 jobs), below the metro’s historical average of 2.1 percent. Job losses were led by trade transportation and utilities (-1,700) and mining (-1,000), while job gains were led by professional and business services (21,400), education and health services (10,800) and construction (8,600). Employment data for the second half of 2019 have not been early-benchmarked and are due for revision by the Bureau of Labor Statistics in March 2020.
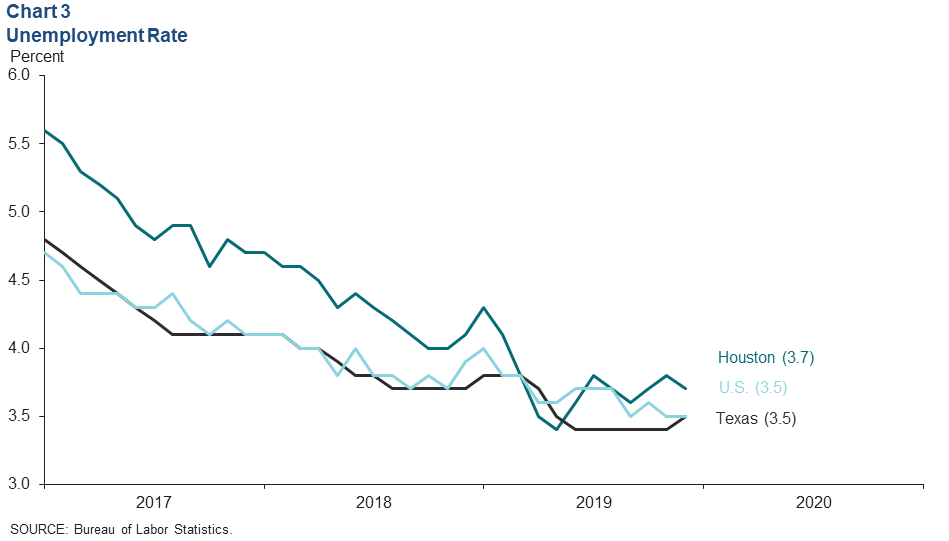
Unemployment Rate Remains Near Record Lows
The Houston unemployment rate slipped to 3.7 percent in December 2019 (Chart 3). That decline occurred amid a modest drop in the size of the local labor force from November to December. Texas and the U.S. both logged unemployment rates of 3.5 percent in December. All three measurements remain at or near historic lows.
Trade
World Exports and Global Manufacturing Contract in 2019
The state of global trade is relevant to the Houston economy. The port of Houston is the largest U.S. port in total foreign tonnage, and Texas ranks as one of the top states for jobs supported by exports, according to the International Trade Administration.
Global export growth contracted year over year in 2019 (Chart 4). The slowing was attributable to elevated trade tensions—particularly between the large economies of China and the U.S.—and more broad-based issues such as Brexit and a secular slowdown in China. The JPMorgan Global Manufacturing Purchasing Managers Index (PMI) stayed below 50 in the second half of 2019, a sign of monthly declines in global manufacturing activity.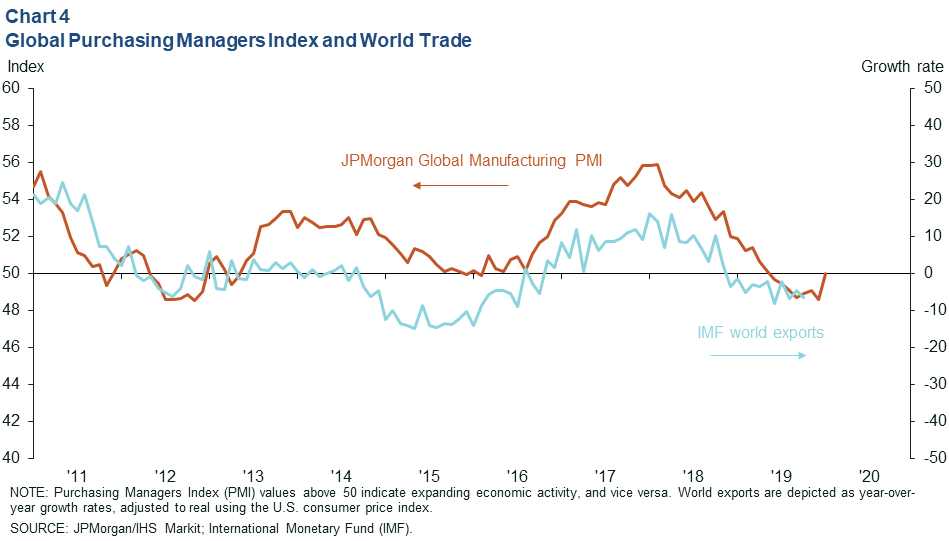
The January global PMI reading rose to 50, tentatively signaling a stabilization in manufacturing. However, the recent emergence of the coronavirus in China, and the measures thus far to combat it, may place that nascent stabilization in jeopardy, at least until the threat from the virus is past.
Houston Export Growth Eases in 2019
Year-over-year real export growth in the Houston–Galveston customs district (which includes the ports of Corpus Christi, Freeport, Galveston, Houston, Port Lavaca, Texas City, and the Houston and Sugar Land airports) eased in 2019 (Chart 5). Similarly, an export-weighted average of manufacturing PMIs from Houston’s primary export partners showed neutral changes in manufacturing activity in the second half of 2019 versus the contractionary signal in the global index. The primary partners represented over 59 percent of the total value of district exports in 2019.
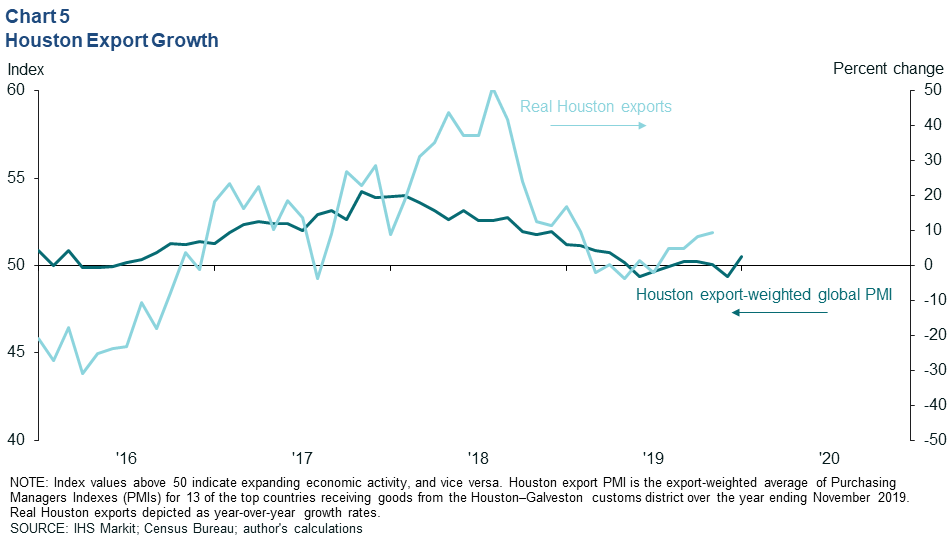
January PMIs for those top export destinations saw the weighted index rise just above 50.7 owing to a broad-based improvement in country indexes, particularly those for India and the United Kingdom. Intermediate goods that feed into global supply chains—such as energy, chemicals and machinery—make up a significant portion of regional exports. Thus, measures of manufacturing activity abroad are an additional barometer of the market.
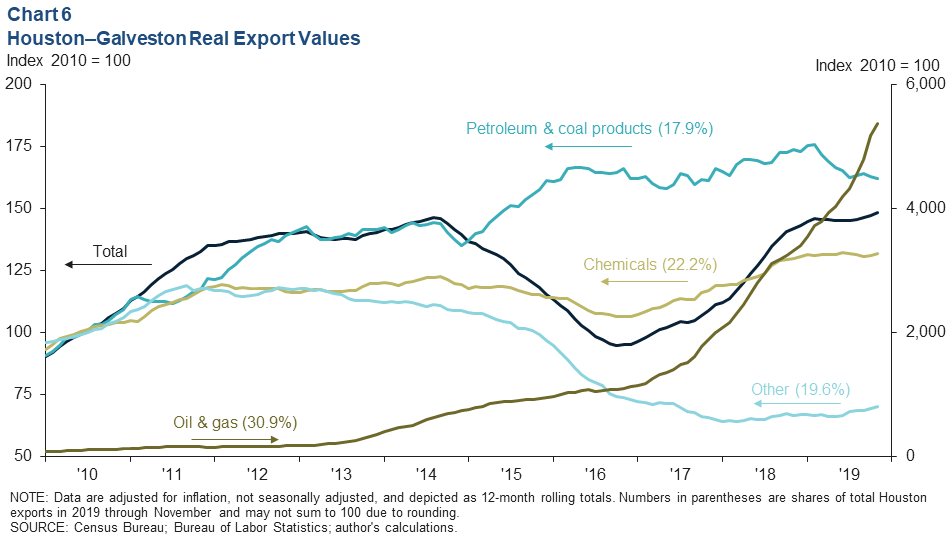
Crude Oil Continues to Drive Export Growth
Surging production of oil and gas the past several years has driven up real domestic exports through the Houston–Galveston customs district (Chart 6). In 2019, that sector accounted for 31 percent of the real value of domestic exports through the region. Real petroleum and coal products exports (17.9 percent of the total) eased last year. After several years of strong growth driven by new chemical plant capacity, real chemical exports leveled off in 2019 and were responsible for 22.2 percent of exports.
NOTE: Data may not match previously published numbers due to revisions.
About Houston Economic Indicators
Questions can be addressed to Jesse Thompson at jesse.thompson@dal.frb.org. Houston Economic Indicators is posted on the second Monday after monthly Houston-area employment data are released.