Houston Economic Indicators

September 7, 2022
Recent data indicate that Houston continues to add jobs at a blistering pace in 2022. While job growth is broad based, there are signs the housing market is loosening. The growth rate of home values is stabilizing at a high level rather than accelerating, existing-home sales have declined, the apartment vacancy rate is up and the number of single-family permits has softened. The data suggest Houston’s near-term outlook remains healthy despite the recent weakening in real estate.
Employment
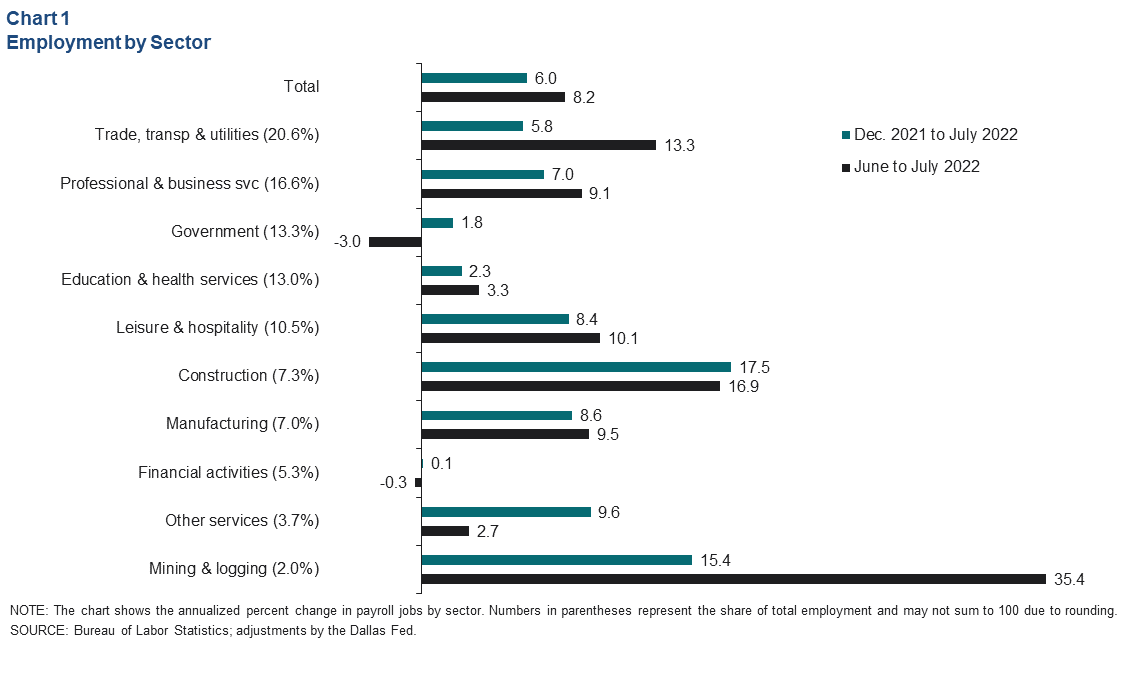
Houston employment expanded 6.0 percent from December 2021 to July 2022, or by 109,647 jobs (Chart 1). Construction grew at the fastest pace, adding 21,501 jobs over that period and surpassing its prepandemic level in July. Specialty trade contractors (such as carpenters, electricians and plumbers) led the sector’s growth. Construction job gains nearly matched those in the much larger trade, transportation and utilities industry. which added 21,704.
Employment in leisure and hospitality—one of the industries most afflicted by COVID-19—rose to 342,365 in July and also surpassed its prepandemic level. That leaves Houston’s tiny information services sector (at 32,074 jobs) as the only service-providing industry to remain below its prepandemic level.
Real estate
Home values rise year over year in second quarter
The nominal purchase price of homes in Houston rose 13.6 percent in the second quarter of 2022 versus the same period a year ago, a relatively tepid pace compared with Texas as a whole, which saw a 20.5 percent increase (Chart 2). The U.S. logged 17.7 percent growth.
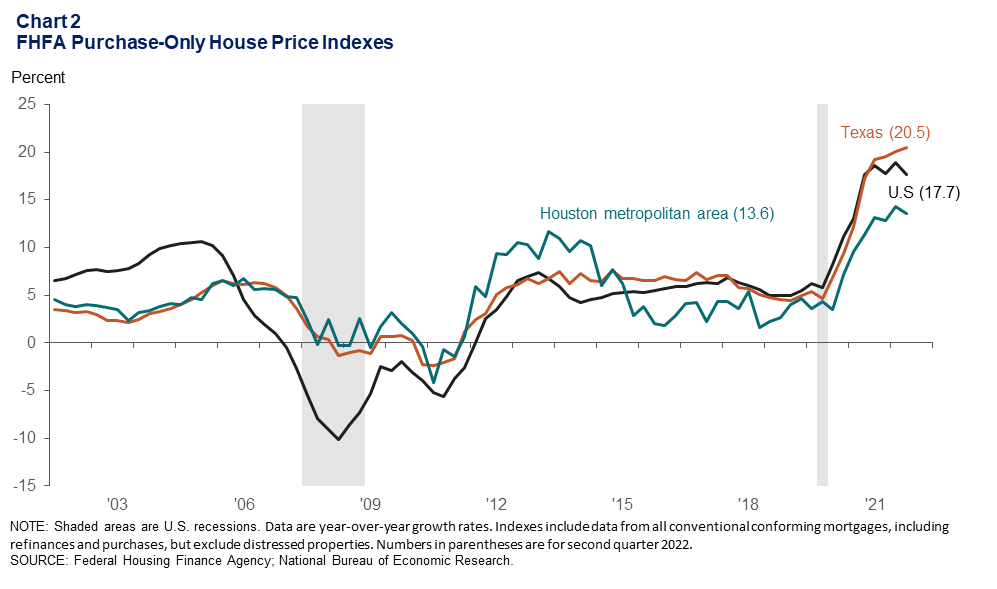
Including mortgage refinances, second quarter home values soared 17.6 percent year-over-year in Houston, 20.9 percent in the U.S. and a blistering 24.6 percent in Texas. The Austin metro area saw home values soar 31.4 percent.
Home sales drop, inventories climb
Sky-high prices and the aggressive rise of mortgage rates from 3.2 percent at the start of 2022 to 5.9 percent at the end of August have taken a toll on monthly existing-home sales. July 2022 seasonally adjusted home sales in Houston totaled 7,889, down from a record 10,787 in January (Chart 3).
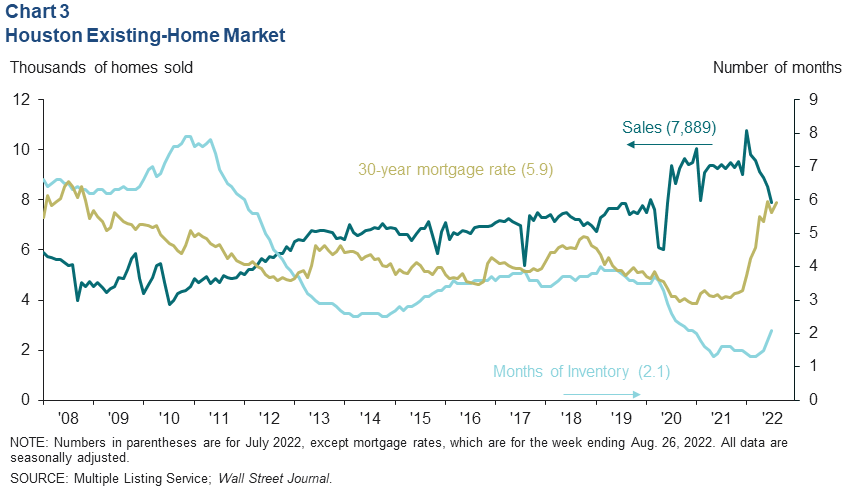
Housing inventory available for sale in the metro rose from a low of 1.3 months of supply in February and March to 2.1 months in July. The improvement in supply was driven by both slower sales and a 54 percent increase in the number of homes listed over the four months ending in July—the biggest four-month increase in listings on record.
Historically, the market was considered balanced between buyers and sellers at about six months of supply, but technologies may have pushed that down to between four and five months. At 2.1 months of supply, the Houston market remains tight, favoring sellers and supporting prices.
Single-family permits down but still elevated
New permits to build single-family housing units have eased in 2022 from 4,892 in March 2022 to 3,931 in July (Chart 4). This is still 14.3 percent above the high number of permits filed in the second half of 2019, prior to the pandemic. Permits for multifamily housing have soared to 2,623, the most since September 2014.
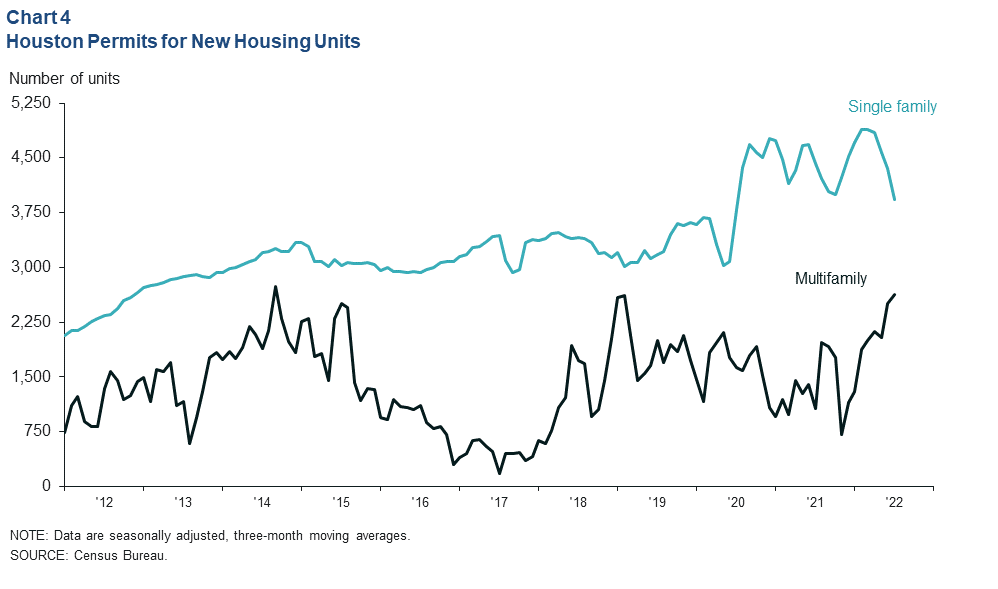
The high level of permits and construction backlogs imply healthy residential construction activity ahead despite slowdowns in the pace of demand from buyers.
Apartment vacancy rates rise as industrial, office rates fall
The Houston apartment vacancy rate increased to 5 percent (occupancy rate of 95 percent) in second quarter 2022 (Chart 5). Even so, vacancy rates that low tend to support increases in the cost of renting an apartment. Year-over-year growth in apartment rental rates accelerated from -1.0 percent in March 2021 to a high of 13.4 percent in March 2022. However, the pace of growth slowed in the second quarter of 2022. In July, apartment rental rates were up 8.8 percent year over year.
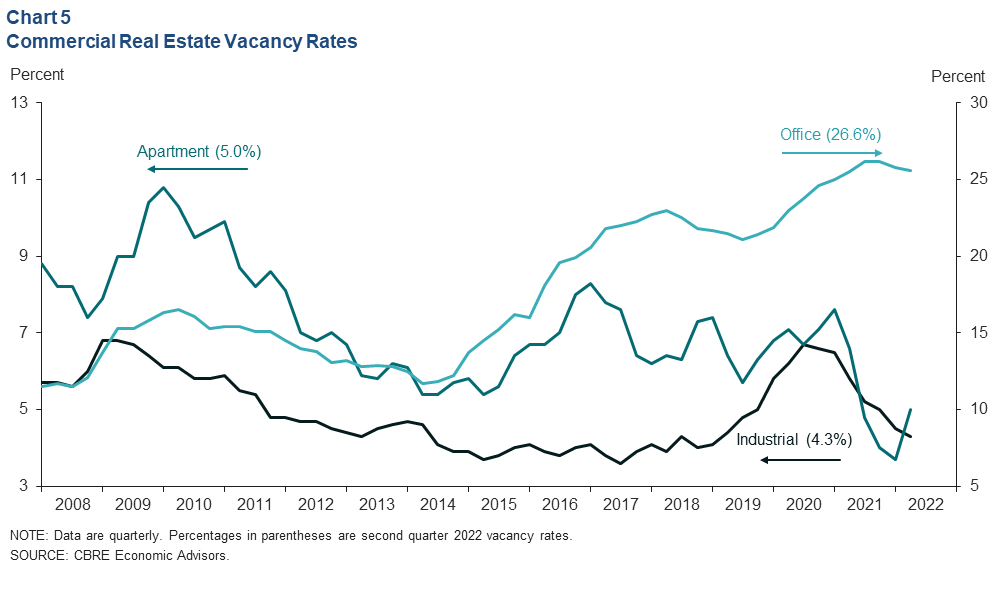
Meanwhile, the industrial vacancy rate has continued to drop. The second quarter 2022 rate was 4.3 percent, its lowest level since the start of the pandemic. The decline in vacancies is occurring amid strong demand, particularly for warehouse space, and ongoing labor shortages and supply-chain challenges for building components like electrical panels.
Office vacancies fell slightly to 26.6 percent in second quarter 2022, comparable to vacancy rates in the early 1990s. The outlook for office space is highly uncertain as inventory ages, and the demand outlook remains uncertain due to the rise of work-from-home arrangements.
NOTE: Data may not match previously published numbers due to revisions.
About Houston Economic Indicators
Questions can be addressed to Jesse Thompson at jesse.thompson@dal.frb.org. Houston Economic Indicators is posted on the second Monday after monthly Houston-area employment data are released.