Houston Economic Indicators

April 6, 2023
| Houston economy dashboard (February 2023) | |||
| Job growth (annualized) Nov. '22–Feb. '23 |
Unemployment rate |
Avg. hourly earnings | Avg. hourly earnings growth y/y |
| 3.4% | 4.6% | $33.42 | 11.0% |
Houston’s service sector posted strong growth from December 2022 to February 2023, while the goods sector showed signs of slowing. Home prices, sales and inventories pointed to some cooling in the Houston housing market. Vacancies were flat in the office and industrial sectors in fourth quarter 2022, but apartment vacancies were up, and apartment rents saw their first decline since 2020.
Employment
The Houston metro added 18,796 jobs in the first two months of 2023, recording 3.5 percent annualized growth (Chart 1). Employment declines year to date in February in goods-producing sectors like manufacturing, construction, and oil and gas were offset by robust growth in service sectors like professional and business services, education and health services, and leisure and hospitality.
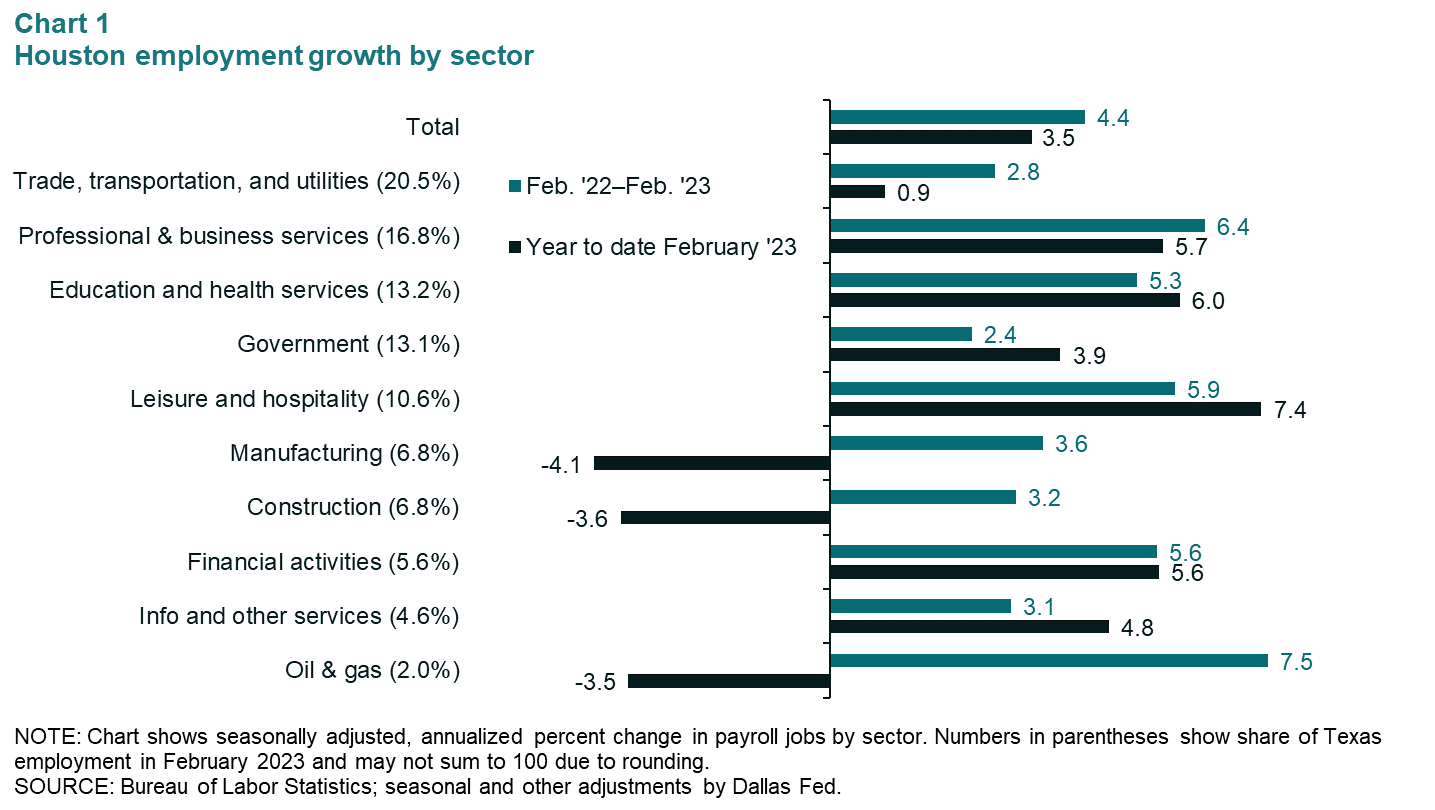
Within manufacturing, durable goods saw the greatest employment decreases in the first two months of 2023, with computer and electronic products seeing the largest percentage decline and machinery seeing the largest absolute decline. These sectors are especially exposed to the rising cost of credit, which could explain the drop.
Real estate
House-price growth slowing nationwide, especially in Houston
On a year-over-year basis, the same-house composite home price slowed in fourth quarter 2022 but remained elevated for Houston, Texas, and the U.S. (Chart 2). Monthly data show that January home prices in the Houston metro were down 1.9 percent from January 2022 levels—the first negative year-over-year reading since early 2019. The median nominal home price in Houston in January was $322,537, lower than the Texas median of $336,205 and the U.S. median of $381,980 in February.
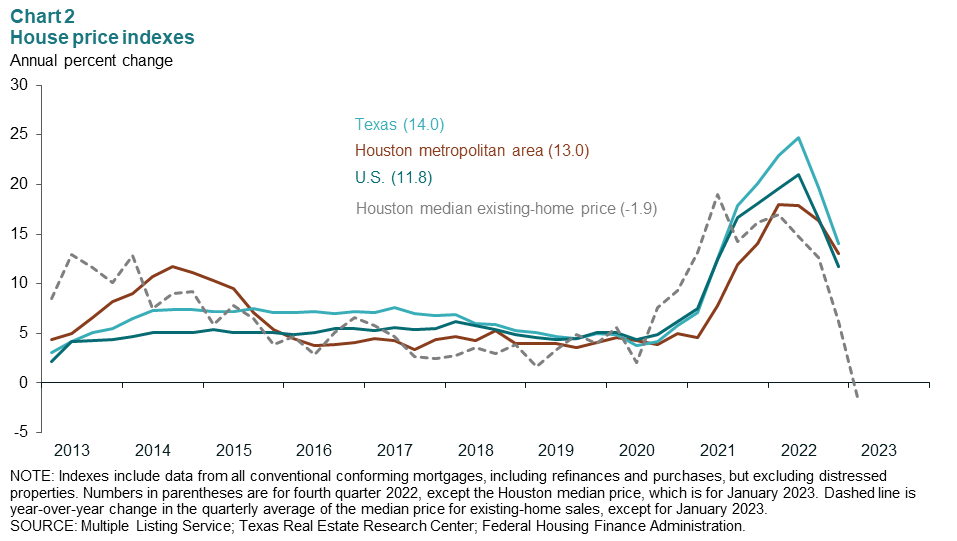
The quarterly Houston house-price index grew 13.0 percent from fourth quarter 2021 to fourth quarter 2022. The Texas home-price index rose 14.0 percent, and the U.S. home-price index rose 11.8 percent in that time. Before the pandemic, the last time growth had been so fast in Houston or Texas was in 1982. The pandemic peaks were record highs for the nation, but the slowdown in the fourth quarter readings brought national home growth in line with 2005 levels.
Home sales turn down; housing inventory ticks up
Mortgage rates rebounded in February to 7.0 percent, up from January’s reading of 6.5 percent. Home sales and inventories data are only available for Houston through January, which show sales rising 2.9 percent month over month to 6,738 and housing inventory increasing to 2.7 months (Chart 3).
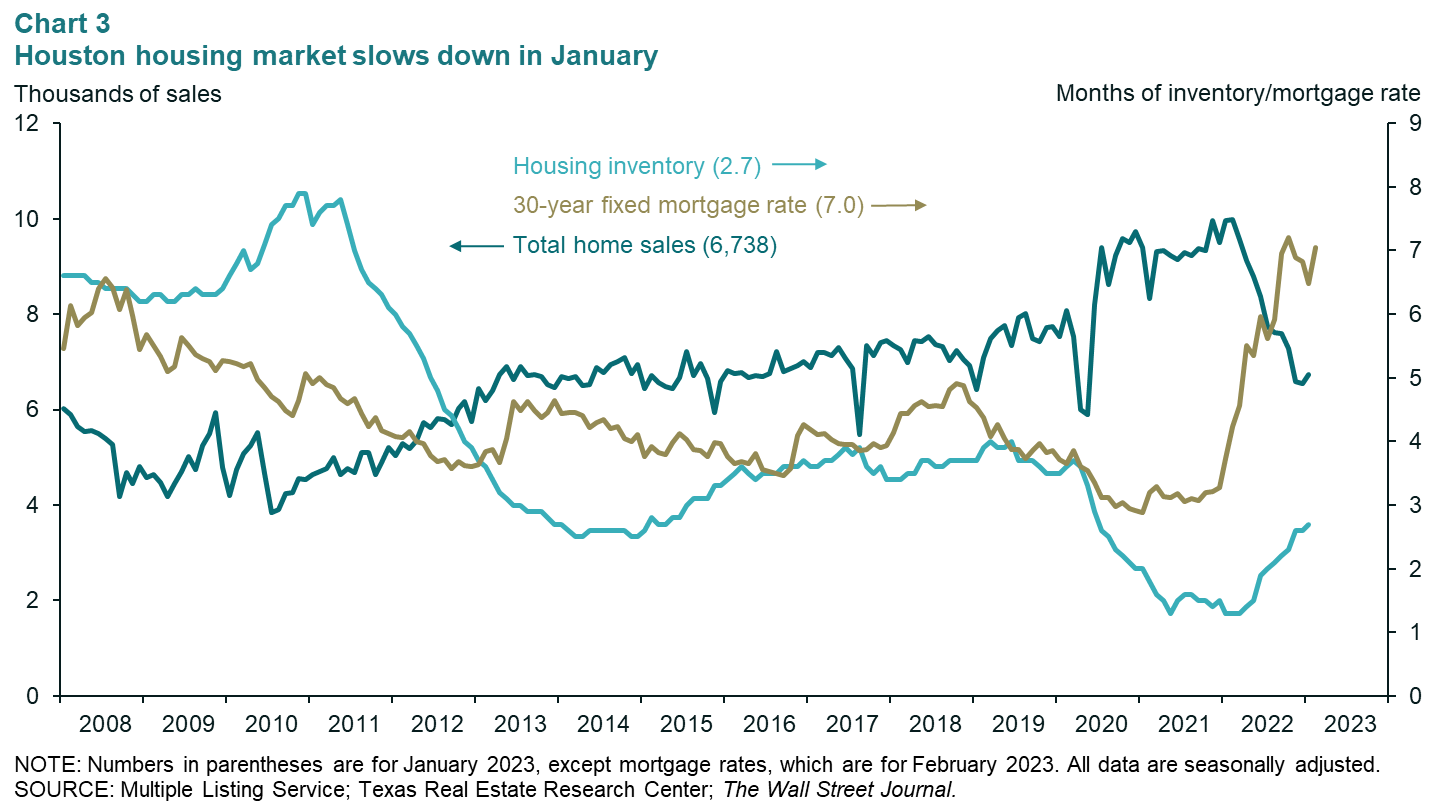
Inventories were flat or up across the state in January and February, and Houston’s housing supply was about on par with other major metros. Austin had the highest housing inventory reading among the major metros, at 4.7 months in February, while Dallas had the lowest at 2.5 months. Both were an increase from January and December readings, pointing to some cooling of the red-hot housing market across the state.
Vacancy rates elevated through fourth quarter 2022
In Houston, office and industrial vacancies were flat at 25.4 and 4.4 percent, respectively, in fourth quarter 2022, while apartment vacancies rose to 7.0 percent from 6.2 percent in the third quarter (Chart 4). Rents per apartment unit fell 0.61 percent in the metro in fourth quarter 2022 to $1,326 a month. Though small, this was the first quarterly decline in apartment rents since fourth quarter 2020.
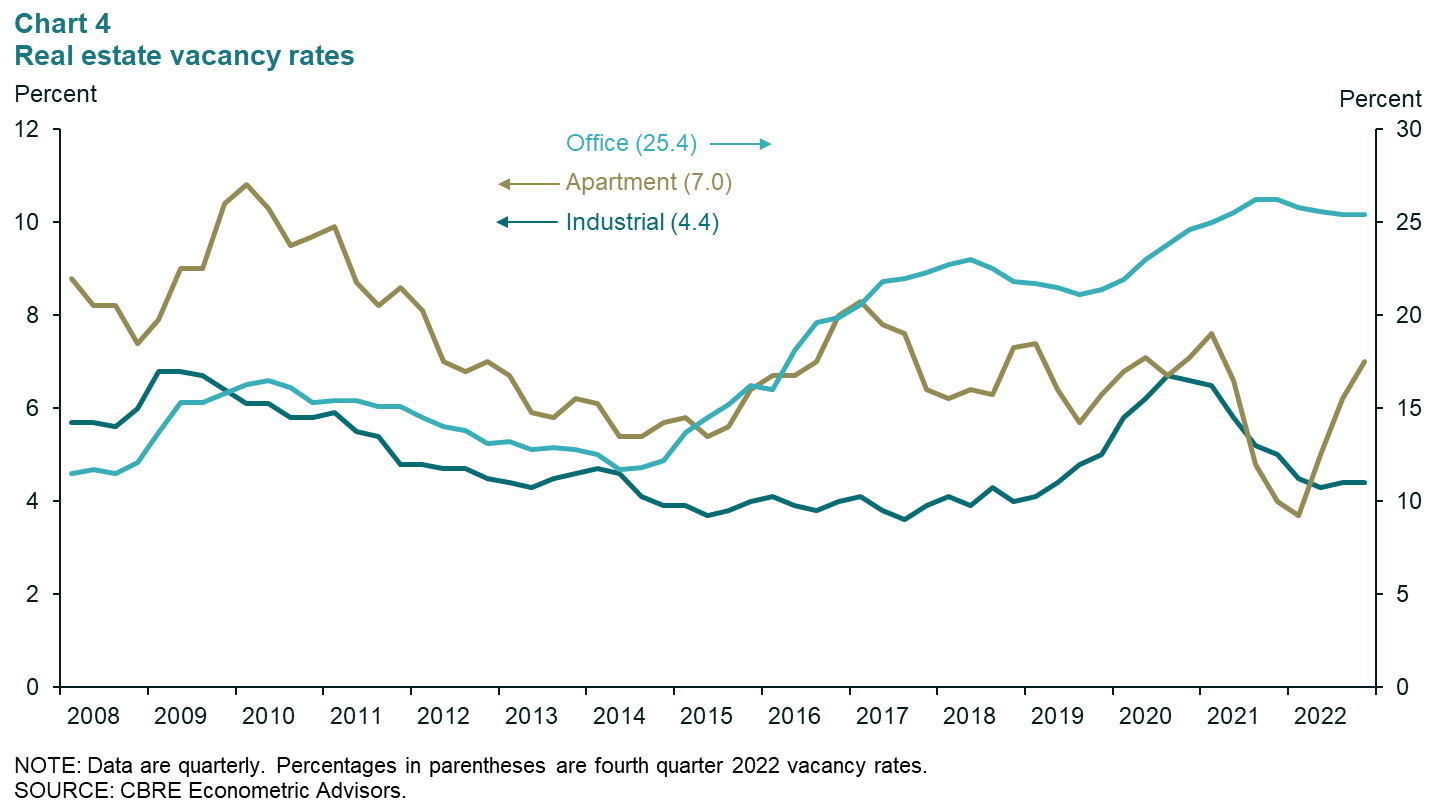
Industrial and office vacancies did not change in the fourth quarter. Office vacancies were still elevated by historical standards; before the pandemic, the last time office vacancies were above 25 percent was 1990. On the industrial side, the 4.4 percent vacancy in 2022 is in line with 2014 vacancy rates.
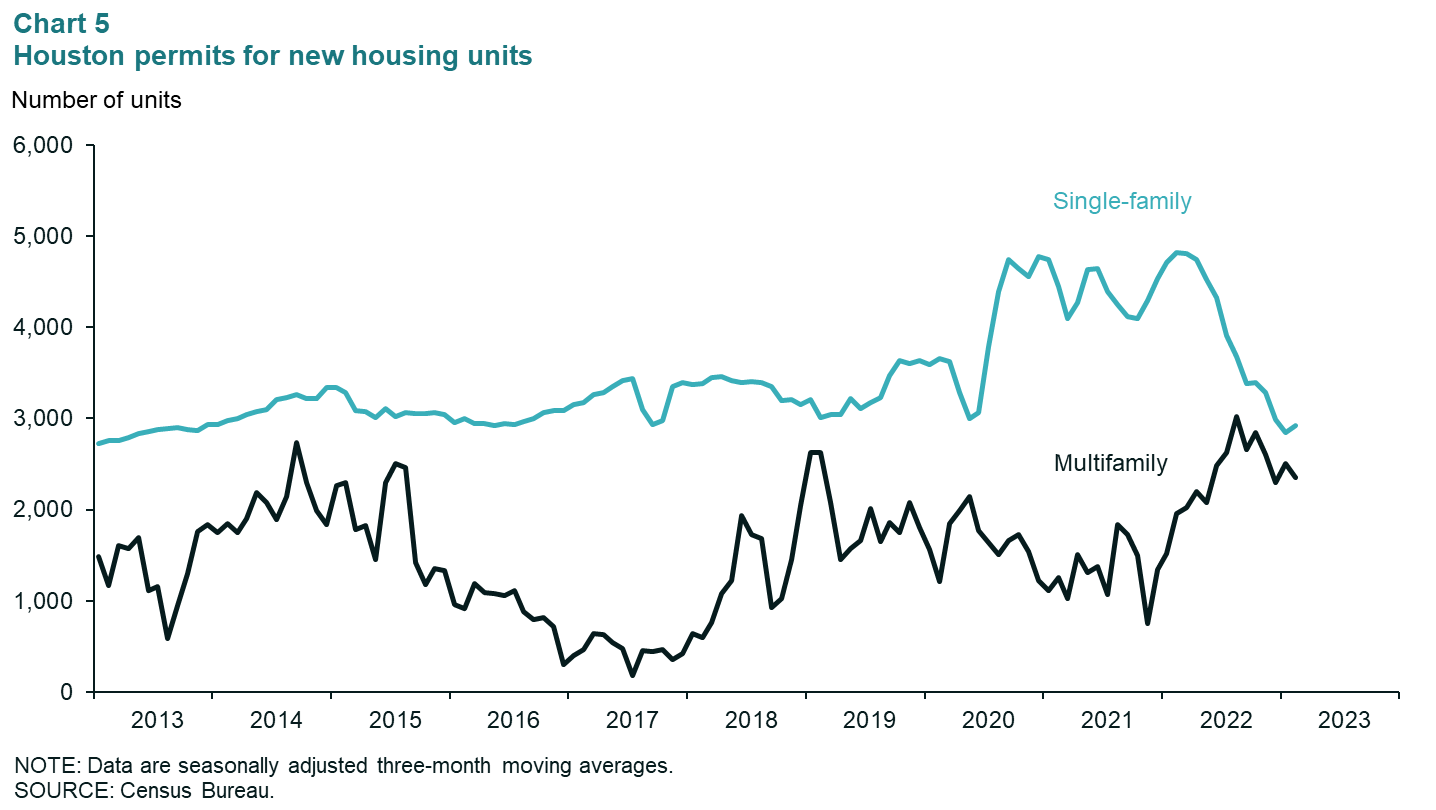
Multifamily permits dip, single-family permits rise
The three-month moving average of single-family permits issued rose in February to 2,918, while the same measure for multifamily permits fell to 2,355 (Chart 5). In February, smoothed single-family permits were 39.4 percent below their February 2022 peak, while smoothed multifamily permits remained 22.1 percent below their August 2022 high.
NOTE: Data may not match previously published numbers due to revisions.
About Houston Economic Indicators
Questions or suggestions can be addressed to Ana Pranger at ana.pranger@dal.frb.org. Houston Economic Indicators is posted on the second Monday after monthly Houston-area employment data are released.