Houston Economic Indicators

| Houston economy dashboard (May 2026) | |||||
| Job growth (annualized) Feb. '26–May '26 |
Unemployment rate (Apr. '26) |
Avg. hourly wages (nominal) | Avg. hourly wages y/y (nominal) |
||
| 2.1% | 4.6% | $36.66 | 2.6% | ||
Houston’s labor market grew moderately over the three months ending in May. Home prices in the metro declined over the past year. In commercial real estate, net asking rents for office and industrial space increased last year with little change in vacancy rate.
Labor market
Houston payrolls grew a healthy 2.1 percent annualized over the three months ending in May 2026, or 18,000 jobs (Chart 1). The pace of job growth has picked up from the beginning of the year, bringing the cumulative growth closer to the metro’s long-run trend rate of about 1.7 percent.
From February 2026 through May 2026, oil and gas and support activities for mining grew an annualized 7.5 percent (1,300 jobs). Construction grew 6.7 percent (4,200 jobs) with strong growth across all subsectors. Manufacturing grew 4.2 percent (2,500 jobs) driven by durable goods manufacturing. There was a pullback in financial activities. The sector declined 2.0 percent, a cut of 900 jobs. Leisure and hospitality employment contracted 1.1 percent (-1,000).
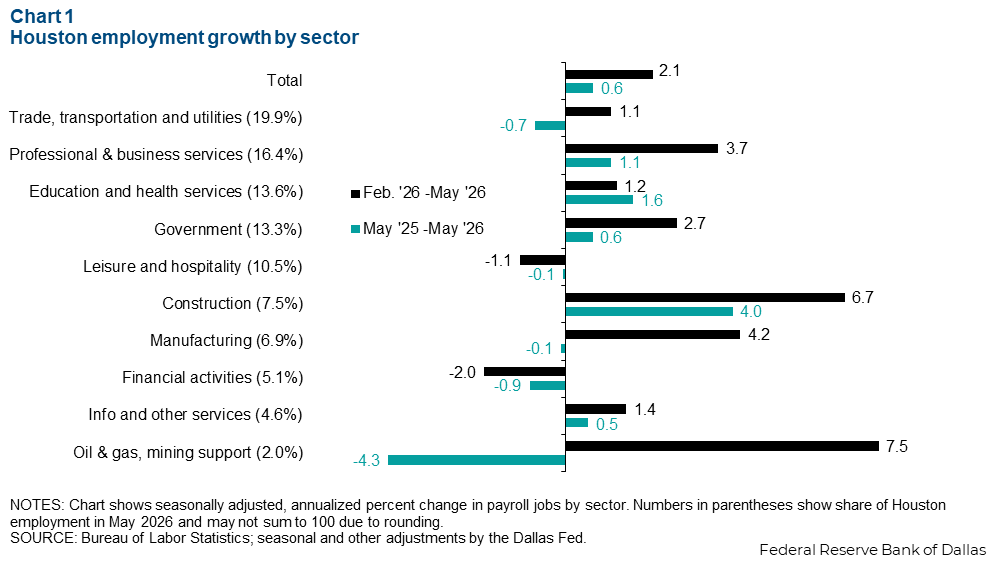
Year over year, job growth was still modest, growing just 0.6 percent (22,300 jobs) from May 2025 to May 2026. The construction sector grew a strong 4.0 percent (10,200 jobs) year over year in May 2026, driven by heavy and civil engineering construction and specialty trade contractors. Year over year there was a reduction in oil and gas employment with the sector contracting 4.3 percent, shedding 3,200 jobs. The large trade, transportation and utilities sector declined 0.7 percent year over year (-5,200).
Real estate
House prices decline in the metro and state
Year-over-year growth in the Houston Federal Housing Finance Administration (FHFA) home-price index declined 0.4 percent in the first quarter, the same rate as the state (Chart 2). The nominal median home sale price in Houston declined 2.0 percent year over year to $328,000 in April 2026.

While home prices declined in Texas over the past year, they continue to grow nationwide. The FHFA home-price index for the U.S. increased 2.4 percent from first quarter 2025 to first quarter 2026. This is the slowest pace of growth since 2012.
With inflation from first quarter 2025 to first quarter 2026 of 1.4 percent and 2.7 percent in Texas and the U.S., respectively, real home values are declining at the fastest pace since 2011, excluding a brief period in 2023.
Office vacancy rates little changed
The vacancy rate for office space in Houston was 23.6 percent in first quarter 2026, unchanged from a year ago (Chart 3). However, net asking rents for office space spiked notably in the first quarter to $22.34 per square foot, an increase of 5.0 percent from a year ago.

Vacancy rate for industrial space ticks up
The vacancy rate for industrial real estate in Houston was 5.8 percent in first quarter 2026, a slight increase from 5.7 percent in first quarter 2025 (Chart 4). Industrial net asking rent was $10.58 per square foot in first quarter 2026, a 9.1 percent increase from a year ago.

NOTE: Data may not match previously published numbers due to revisions.
About Houston Economic Indicators
Questions or suggestions can be addressed to Robert Leigh. Houston Economic Indicators publishes bimonthly after state and metro area employment data are released.