Houston Economic Indicators

| Houston economy dashboard (July 2026) | |||||
| Job growth (annualized) April '26–July '26 |
Unemployment rate |
Avg. hourly wages (nominal) | Avg. hourly wages y/y (nominal) |
||
| 2.1% | 4.9% | $36.51 | 3.0% | ||
Houston’s labor market grew moderately over the three months ending in July, led by construction jobs. The Houston Purchasing Managers Index indicates an expansion in economic activity, but the Houston Leading Index moderated in July. Various surveys of input prices continue to indicate growing input costs for businesses. In energy markets, high oil prices are keeping retail prices for gasoline and diesel high compared to a year ago. High oil prices have also sent export values through the Houston-Galveston port district soaring year over year.
Labor market
Houston payrolls grew 2.1 percent annualized over the three months ending in July 2026, or 18,000 jobs (Chart 1). From April through July 2026, construction grew an annualized 10.4 percent (6,500 jobs). Construction employment growth was strong across all subsectors but particularly in the construction of buildings subsector which grew 13.3 percent annualized. Oil and gas grew 9.0 percent (1,500 jobs), and the large professional and business services sector grew 5.7 percent (7,800 jobs). Professional and business services growth was driven, in part, by employment services which grew an annualized 28.5 percent (5,300 jobs).
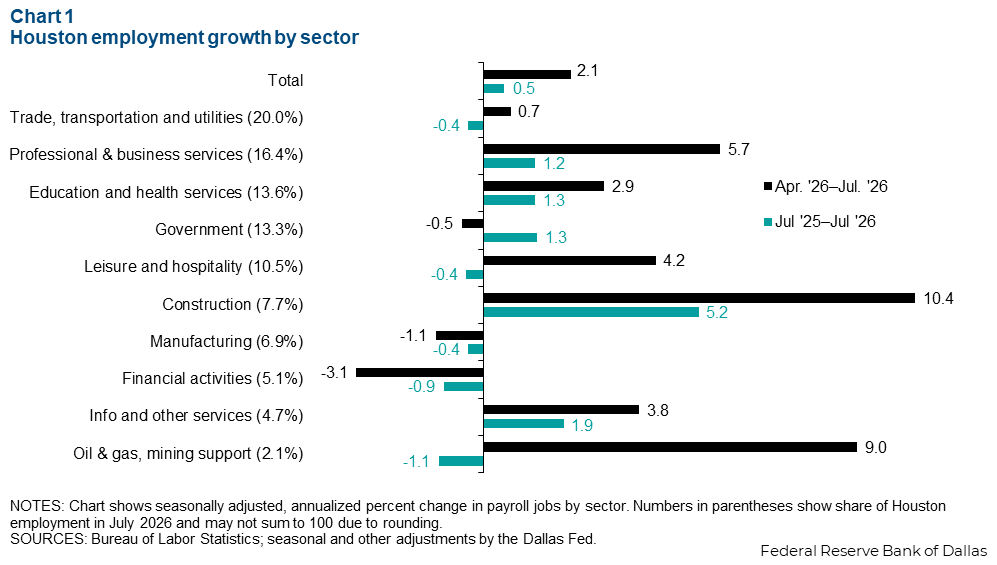
After incorporating upward revisions to late 2025 and downward revisions to first quarter 2026 data, Houston’s net job growth continues to look anemic. Year over year, job growth was 0.5 percent (17,500 jobs) from July 2025 to July 2026.
The strongest growth was in construction which grew 5.2 percent (13,200 jobs) year over year in July 2026. Over the past year, employment contracted in several sectors including trade, transportation and utilities, leisure and hospitality, manufacturing, financial activities, and oil and gas. The decline was most pronounced in oil and gas which declined 1.1 percent (-800 jobs).
Purchasing managers index
Index indicates expansion
The Houston Purchasing Managers Index (HPMI) rose to 53.6 in July 2026 from 51.4 in May, as a larger share of respondents reported expanding economic conditions (Chart 2). Index values above 50 indicate expansion, while those below 50 indicate contraction. The Houston Leading Index (HLI) decelerated to 0.6 percent growth over the three months ending in July from 3.0 percent growth over the three months ending in April.

Input price growth increases
The three-month moving average diffusion index for input prices paid in Houston accelerated to 24.7 in July 2026 from 20.1 in April (Chart 3). Smoothed diffusion indexes for input prices in Texas and the U.S. similarly increased. The national manufacturing prices paid index ticked up to 47.0 in July from 44.2 in April. The Texas Manufacturing Outlook Survey (TMOS) prices paid index climbed to 42.1 from 33.8 over the same period.

Energy
U.S. well completions increase
The number of new wells completed in the U.S. averaged 1,041 over the three months ending in July 2026, up from 1,002 in April (Chart 4). Combined daily U.S. production of crude oil and gross withdrawals of natural gas from the lower 48 states was 33.7 million barrels of oil equivalent per day in May 2026—which is inclusive of the field production of natural gas liquids like ethane, propane and butane. Production grew 3.0 percent year over year in May.

Retail gasoline prices decline while diesel spikes
The average retail price of gasoline in Houston declined to $3.55 per gallon the week of August 24 from $3.85 the week of May 25 (Chart 5). Over the same period, the average price of U.S. Gulf Coast on-highway diesel increased to $5.48 the week of August 24 from $5.05 the week of May 25. Strong export demand and full refinery utilization are keeping inventories tight and fuel prices more elevated relative to crude oil than normal.

Trade
The total value of exports through the Houston-Galveston port district was $26.6 billion in June 2026, a 17.5 percent increase from one year ago. The value of crude oil, natural gas and liquified natural gas exports grew 19.8 percent year over year in June to $12.8 billion. Exports of petroleum products were up 11.1 percent and chemicals and plastics 8.1 percent, all driven by strong export demand and lower domestic input prices (Chart 6).

NOTE: Data may not match previously published numbers due to revisions.
About Houston Economic Indicators
Questions or suggestions can be addressed to Robert Leigh. Houston Economic Indicators publishes bimonthly after state and metro area employment data are released.