Permian Basin Economic Indicators

| Midland–Odessa economy dashboard (June 2026) | |||||
| Job growth (annualized) Mar. '26–Jun. '26 |
Unemployment rate |
Avg. hourly earnings | Avg. hourly earnings growth y/y | ||
| Midland–Odessa | 3.0% | 3.7% | $32.38 | -11.6% | |
| Midland | 2.6% | 3.4% | $32.22 | -14.6% | |
| Odessa | 3.6% | 4.3% | $32.62 | -6.4% | |
Employment in the Texas Permian Basin grew in the three months ending in June, while unemployment rates rose. The number of home sales increased, while the median price of homes sold decreased. Oil production, the number of new wells drilled and the number of active rigs all moved up.
Energy
Crude oil prices rise in second quarter
The natural gas prices in the Permian Basin (Waha) and national benchmark natural gas price (Henry Hub) fell in the second quarter (Chart 1). Henry Hub’s average price dropped to $17.11 per barrel of oil equivalent (BOE) from $27.30 in the first quarter, while Waha, the hub in West Texas close to the producing wells of the Permian Basin, moved down to -$16.95 from -$8.11 per BOE over the same period.
Natural gas in the Permian has frequently seen negative pricing in the past few years because the growth in supply has largely been a byproduct of shale oil production, and pipeline capacity is frequently constrained. When gas production approaches the physical limits of transportation and storage infrastructure, producers pay to have the natural gas removed to avoid shutting down oil production. Occasional modest negative natural gas pricing is usually offset with revenues from co-produced natural gas liquids content (NGLs)—ethane, propane and butane. Industry outreach has indicated that deeply negative natural gas prices and relatively modest NGL pricing this year have made for a more challenging environment than expected for many producers despite high oil prices.
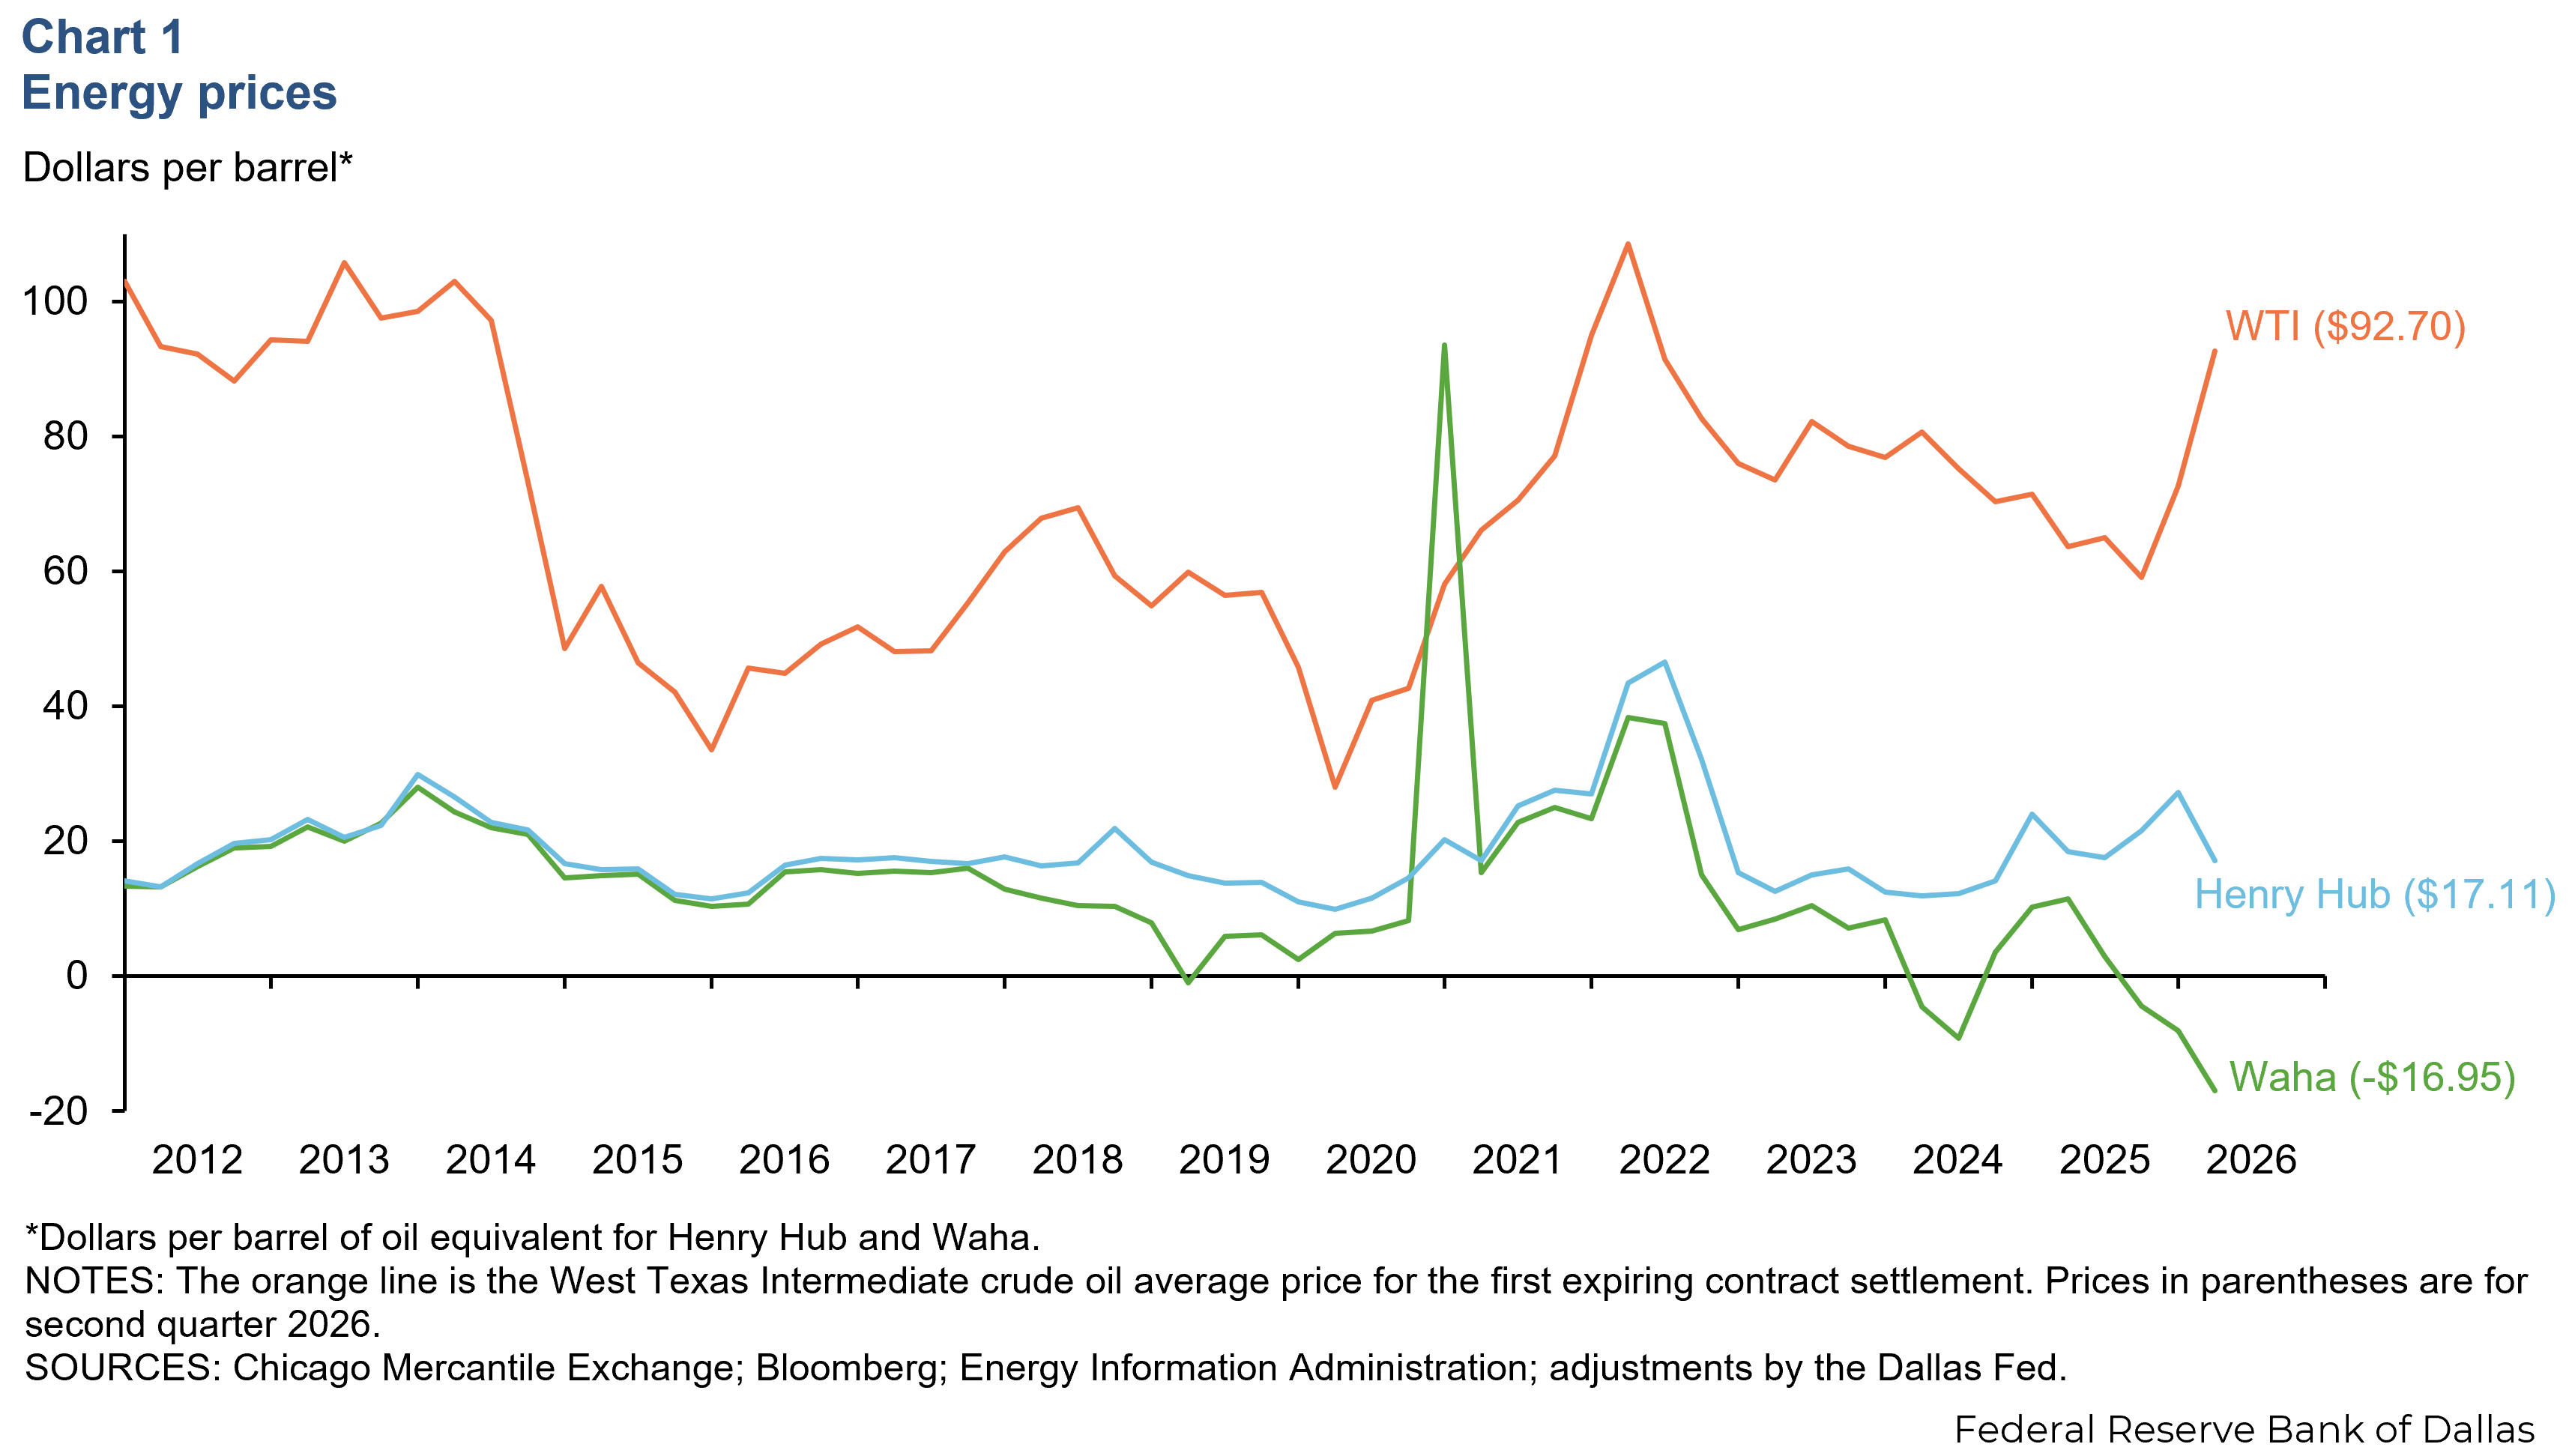
With the conflict in Iran having curtailed the availability of crude oil, the price of West Texas Intermediate crude shot up to average $93 per barrel in the second quarter, a quarter-to-quarter rise of 27.6 percent and a 45.6 percent hike from the year prior. While prices remain elevated amid geopolitical volatility, WTI nonetheless eased to a daily average of $80 in July.
Oil production rises
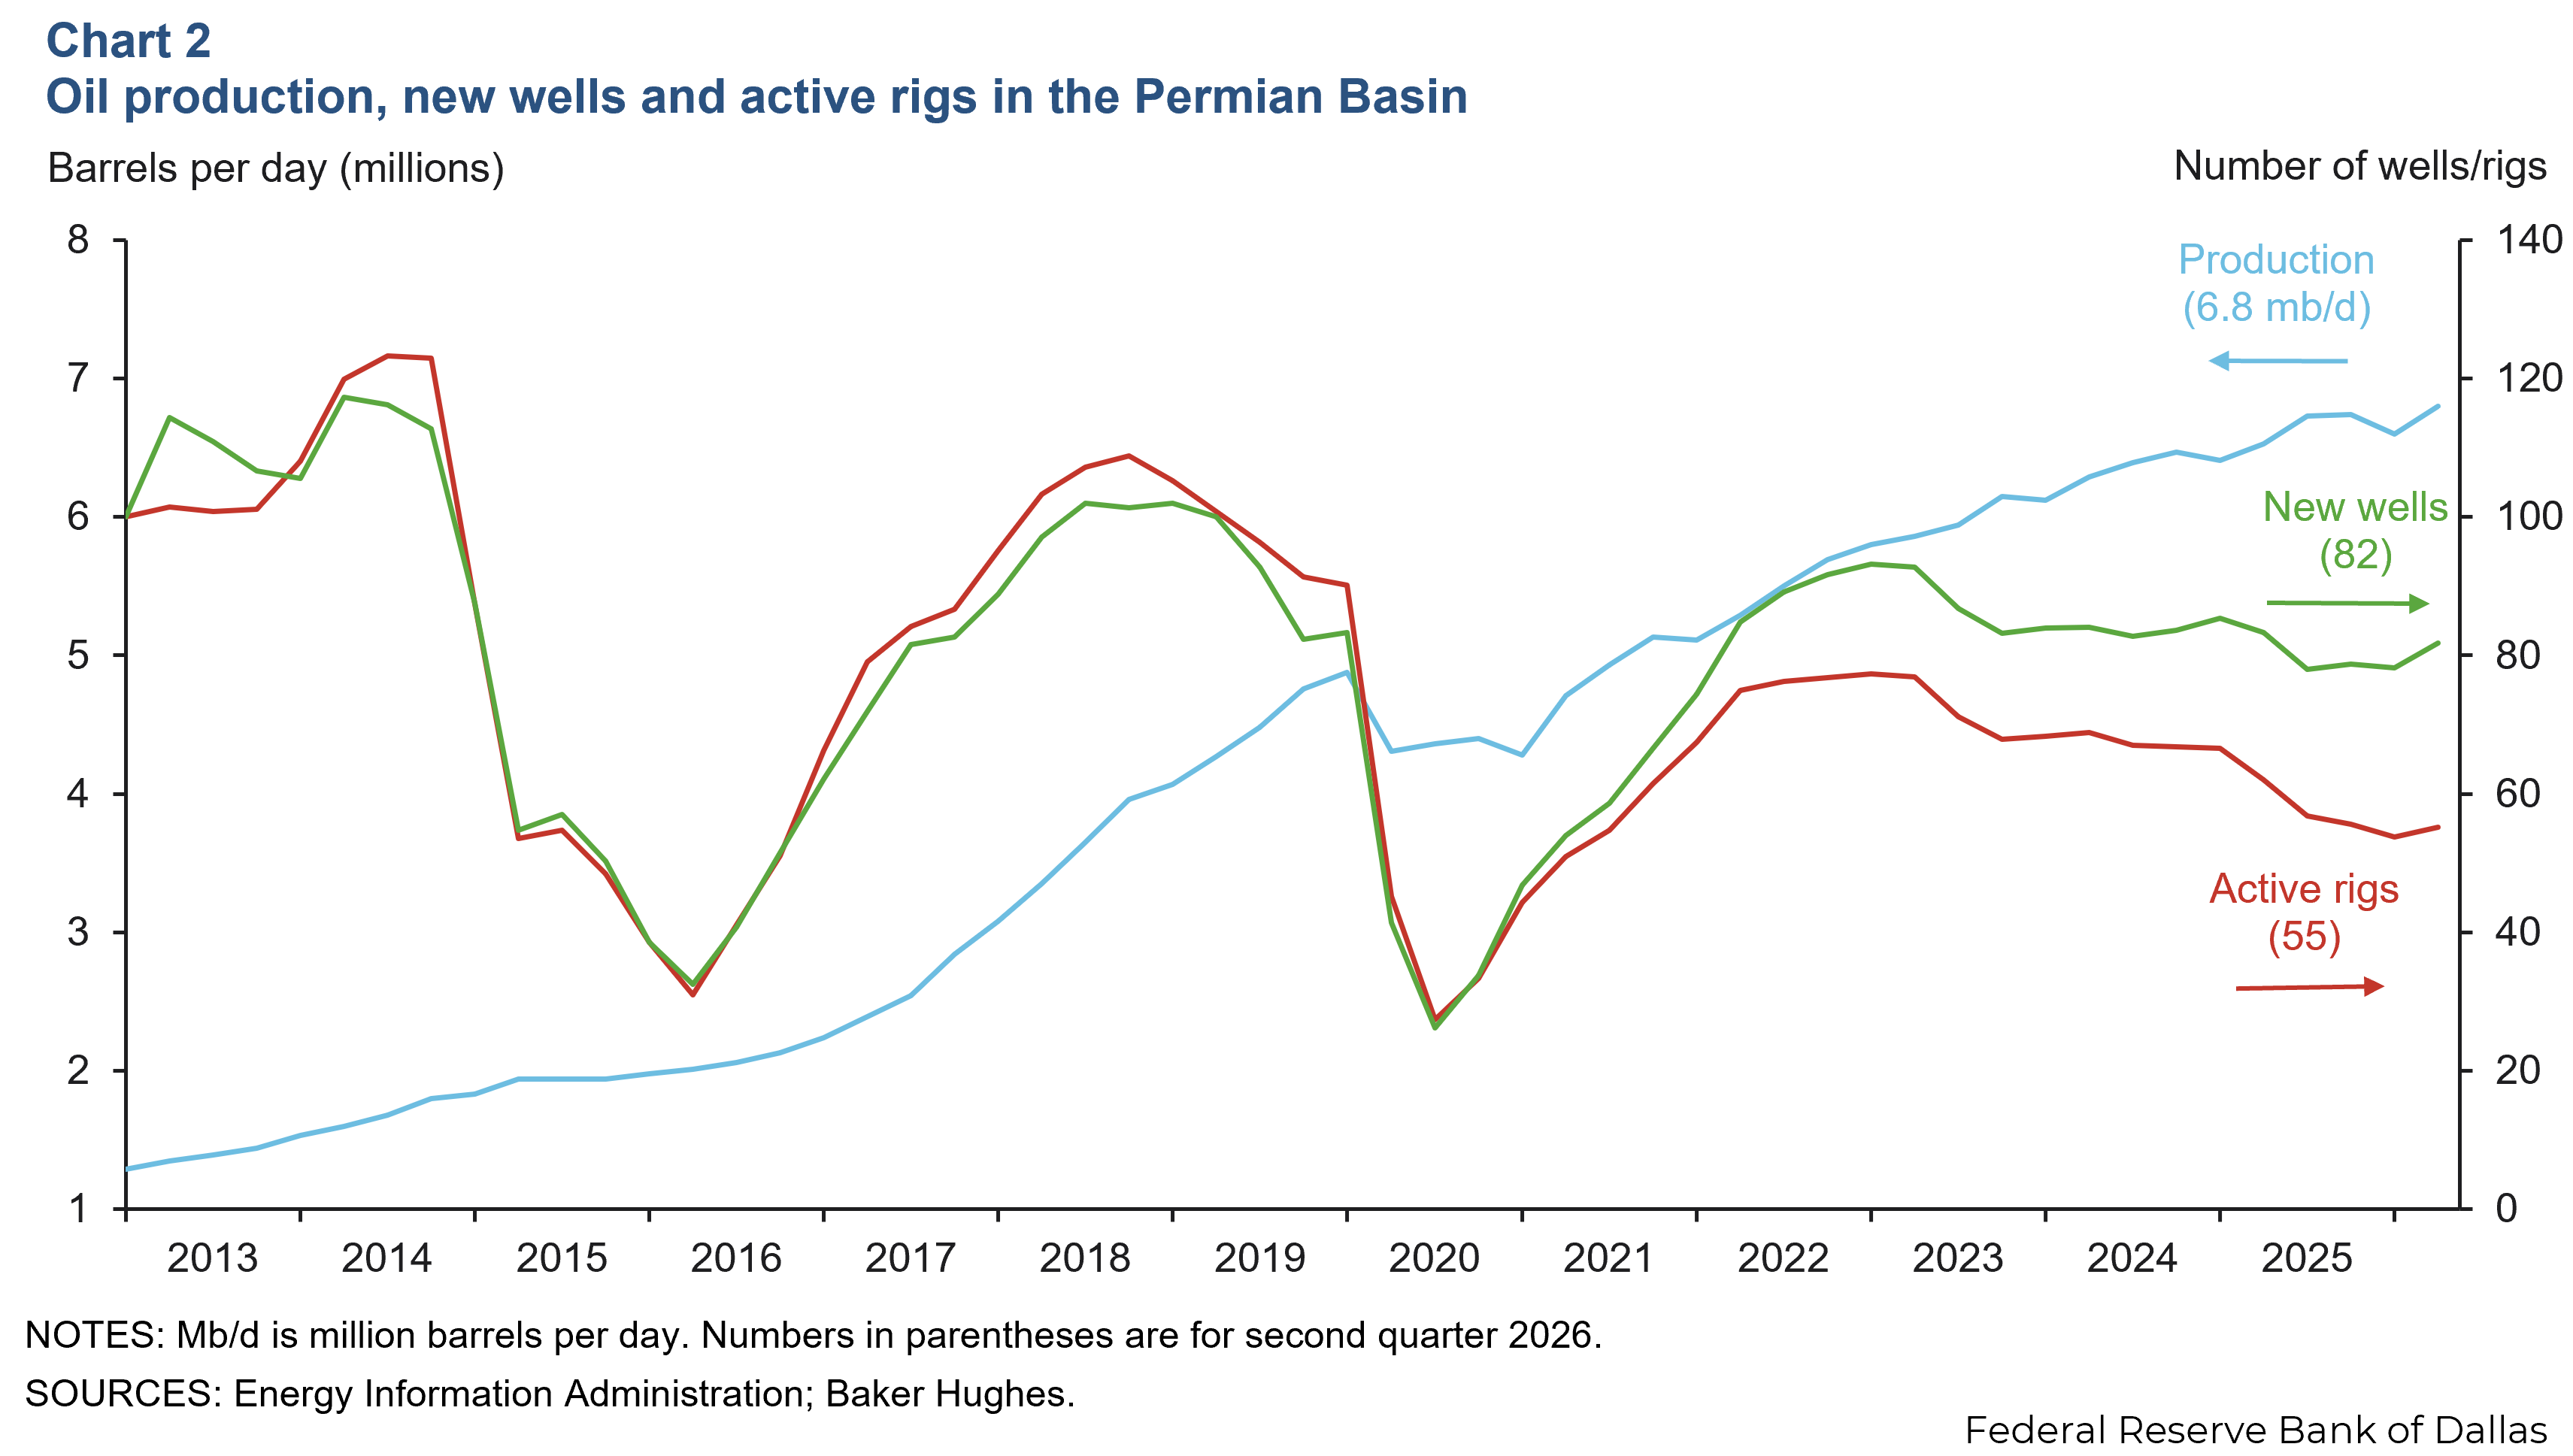
Oil production in the Permian Basin rose 3 percent to 6.8 million barrels per day (mb/d) in the second quarter from 6.6 mb/d in the first quarter. The number of new wells drilled and the number of active rigs increased 4.6 percent and 2.5 percent, respectively, over the same period (Chart 2). The boost seems to mainly come from smaller producers seeking to capitalize on higher oil prices as well as a previously scheduled uptick in activity driven by the expectation of new pipelines that will alleviate in-basin natural gas constraints.
Labor market
Employment increases in Midland–Odessa region
Total nonfarm employment in Midland–Odessa increased 3 percent from March through June (Chart 3). Total U.S. nonfarm employment edged up by 0.8 percent, and Texas nonfarm employment climbed 2.4 percent over the same period. From March to June most sectors saw increased employment in Midland–Odessa with the exception of financial activities, and information and other services, which decreased over the period.
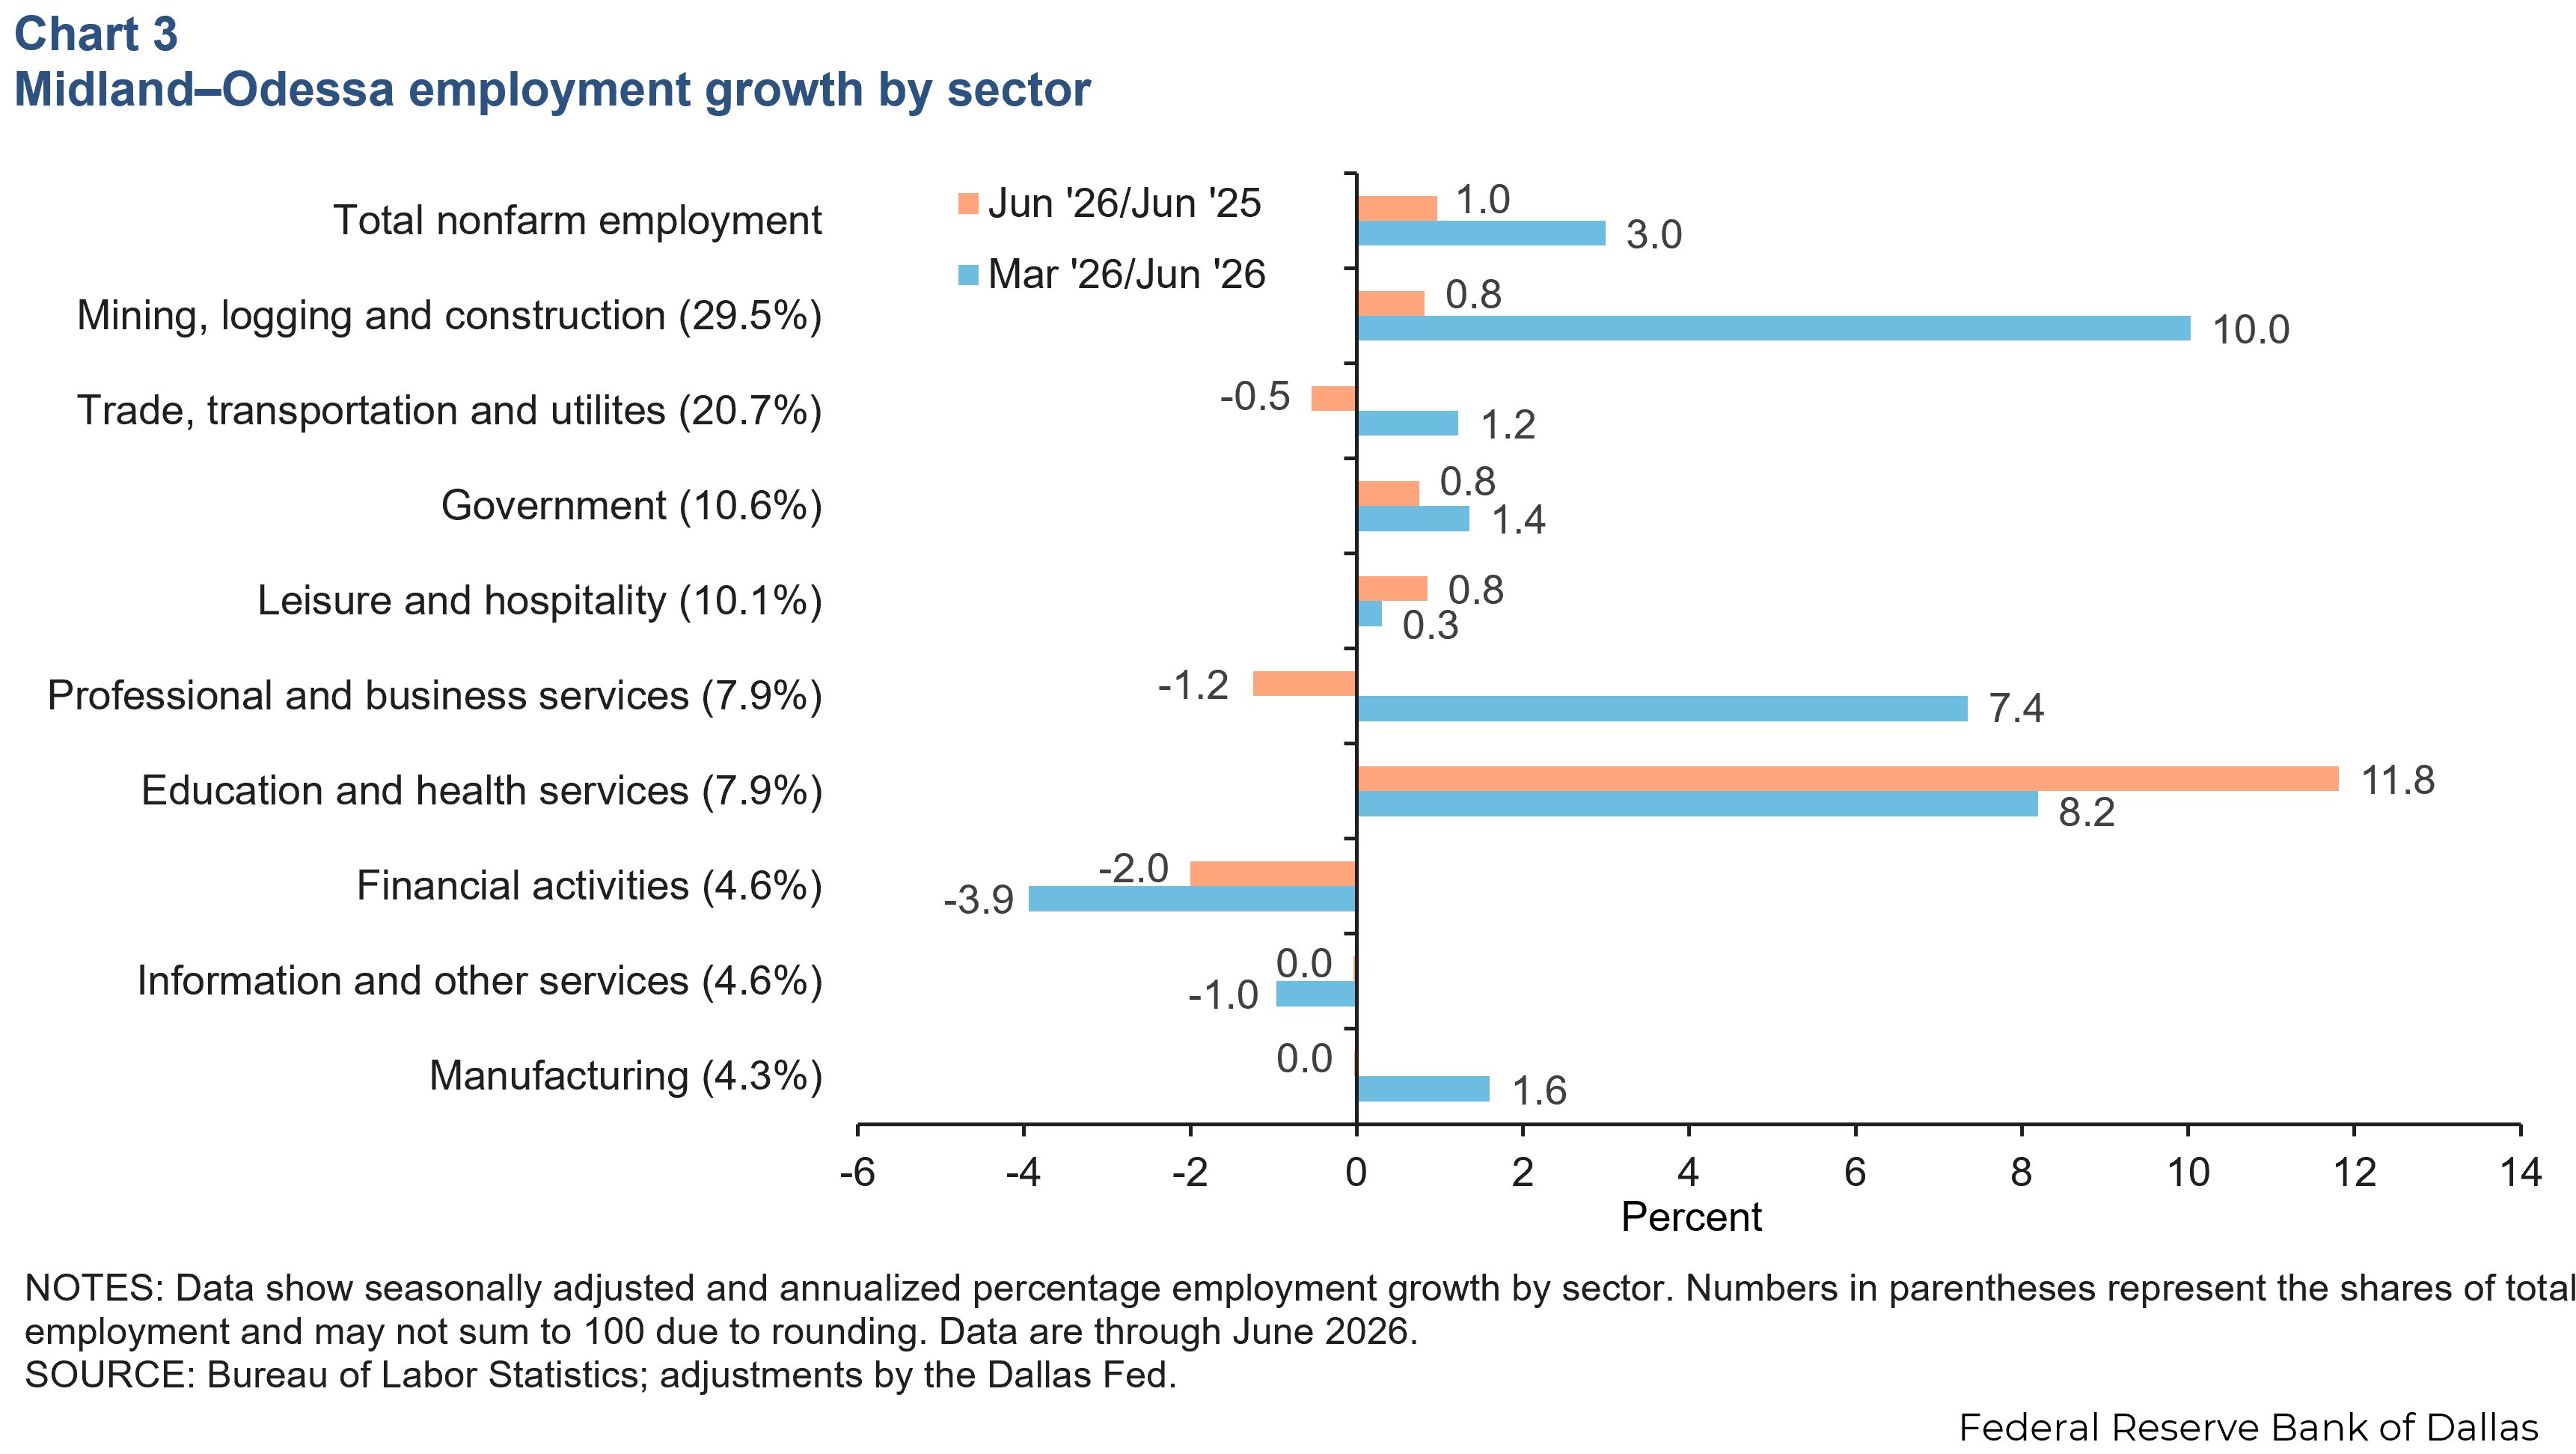
Year over year, employment in Midland–Odessa grew 1 percent in June. Employment for the year increased in most sectors except trade, transportation and utilities, professional and business services, and financial activities which experienced employment declines.
Unemployment rates tick up
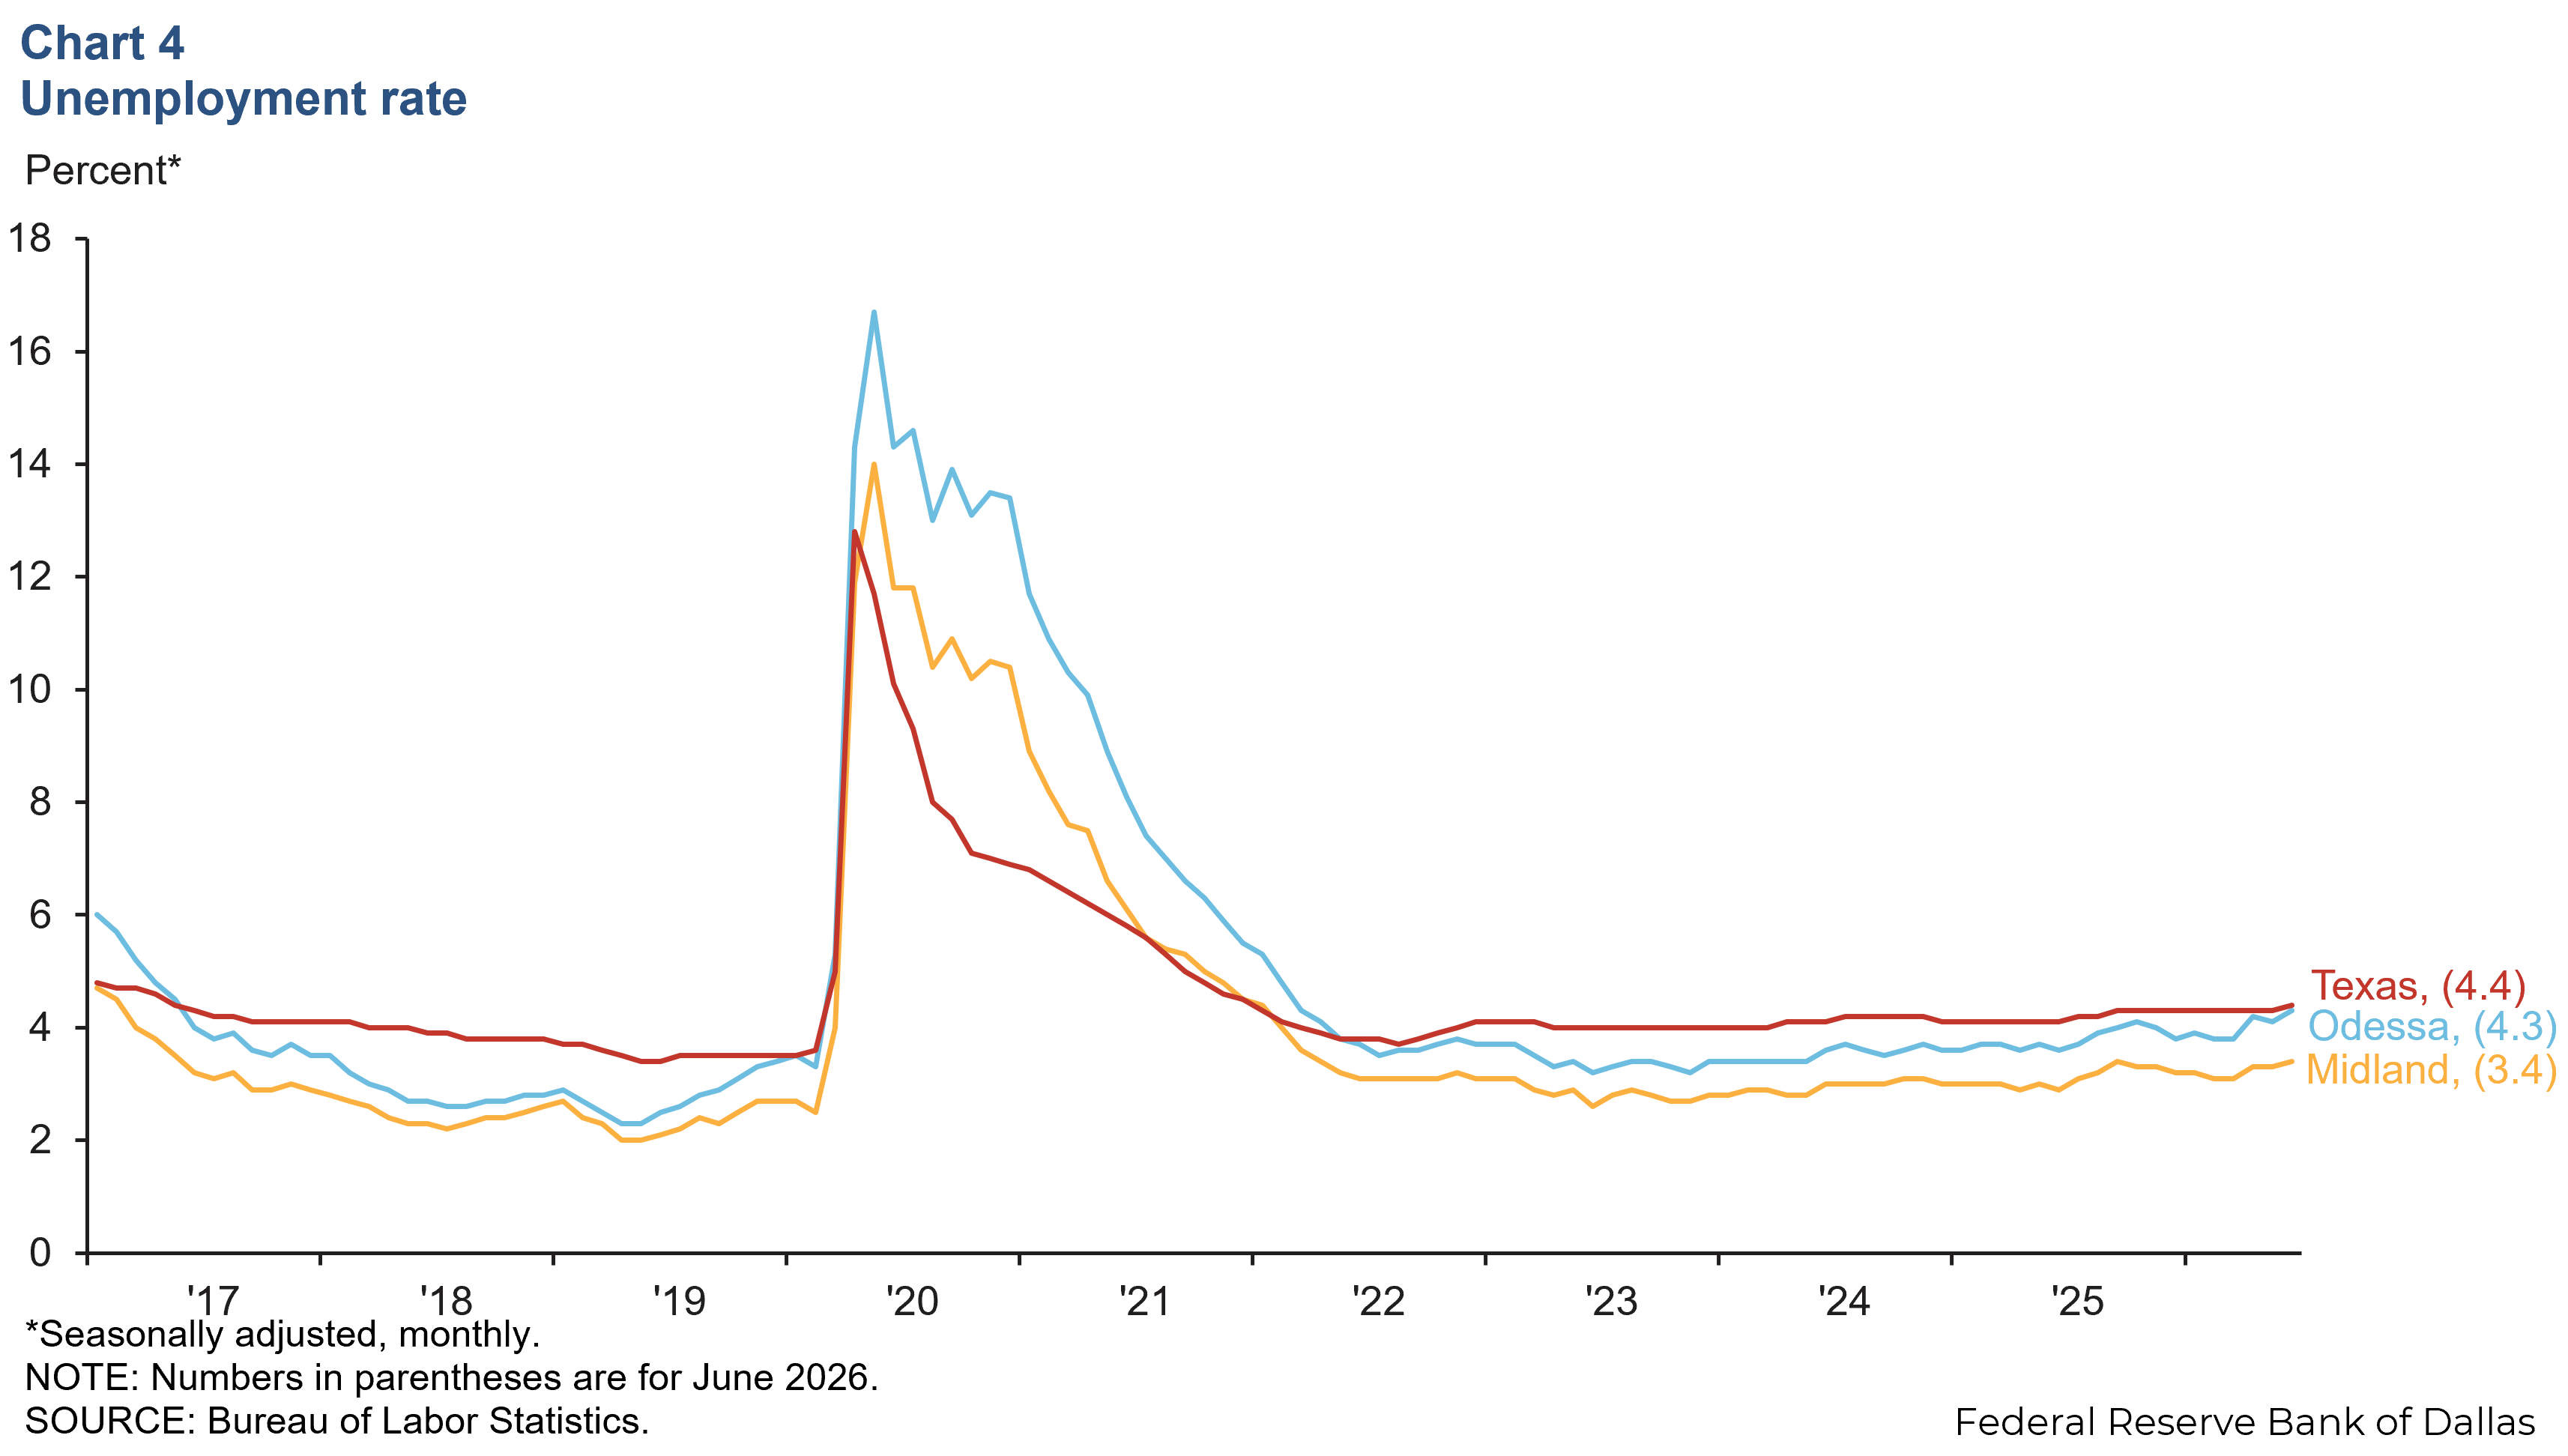
The unemployment rates in both Midland and Odessa were higher in June compared with March (Chart 4). Midland’s unemployment rate grew to 3.4 percent in June from 3.1 percent in March, while Odessa’s jobless rate increased to 4.3 percent from 3.8 percent over the same period. Meanwhile, Texas’ unemployment rate ticked up slightly to 4.4 percent in June compared to 4.3 percent in March.
Housing
Single-family housing permits decrease
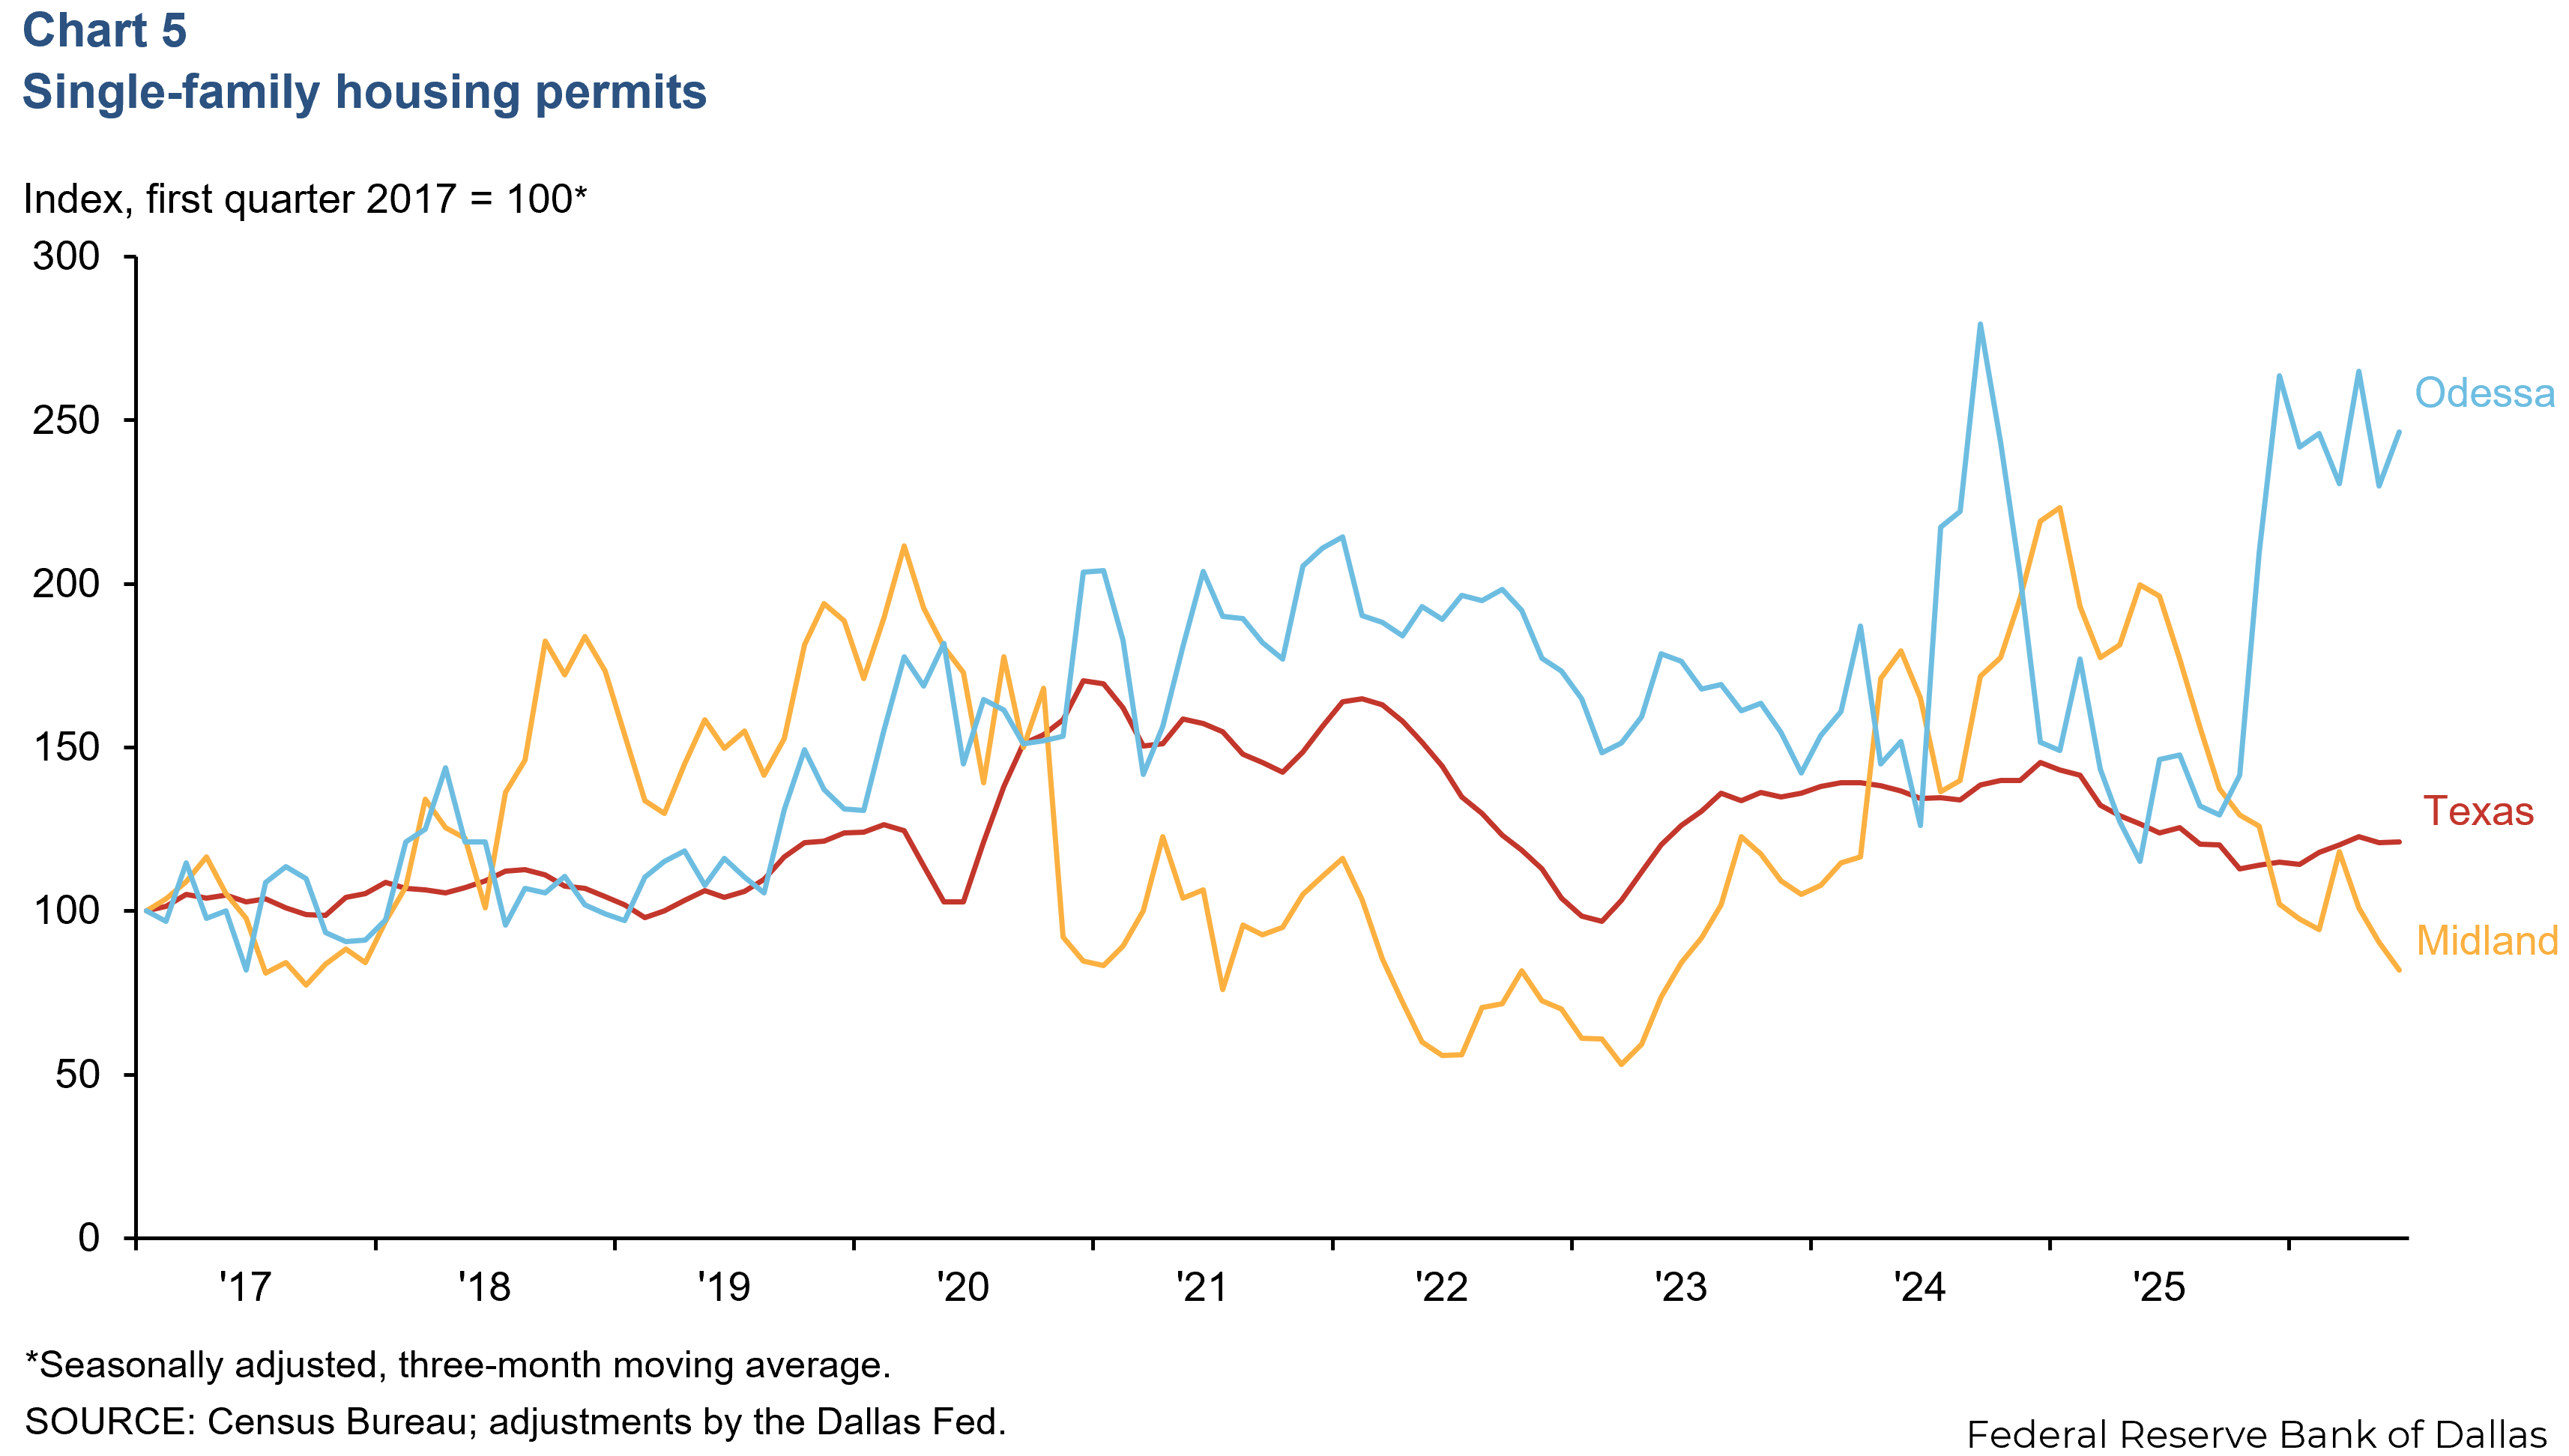
Single-family housing permits in Midland were down 30.5 percent in June compared with March but up 6.9 percent in Odessa (Chart 5). Altogether, from March to June, single-family permits were down 9.6 percent in the region, versus an uptick of 0.7 percent statewide over the same period.
Home sales and prices increase
Home sales in the Permian Basin were up 6.6 percent in June when compared with March 2026 and up 7.6 percent on a year-over-year basis (Chart 6). The nominal median price of homes that sold in June was $337,000, a decrease of 1.5 percent from March 2026 and essentially flat versus June 2025. By comparison, the median price in Texas was $332,000 in June (down 0.2 percent year over year).
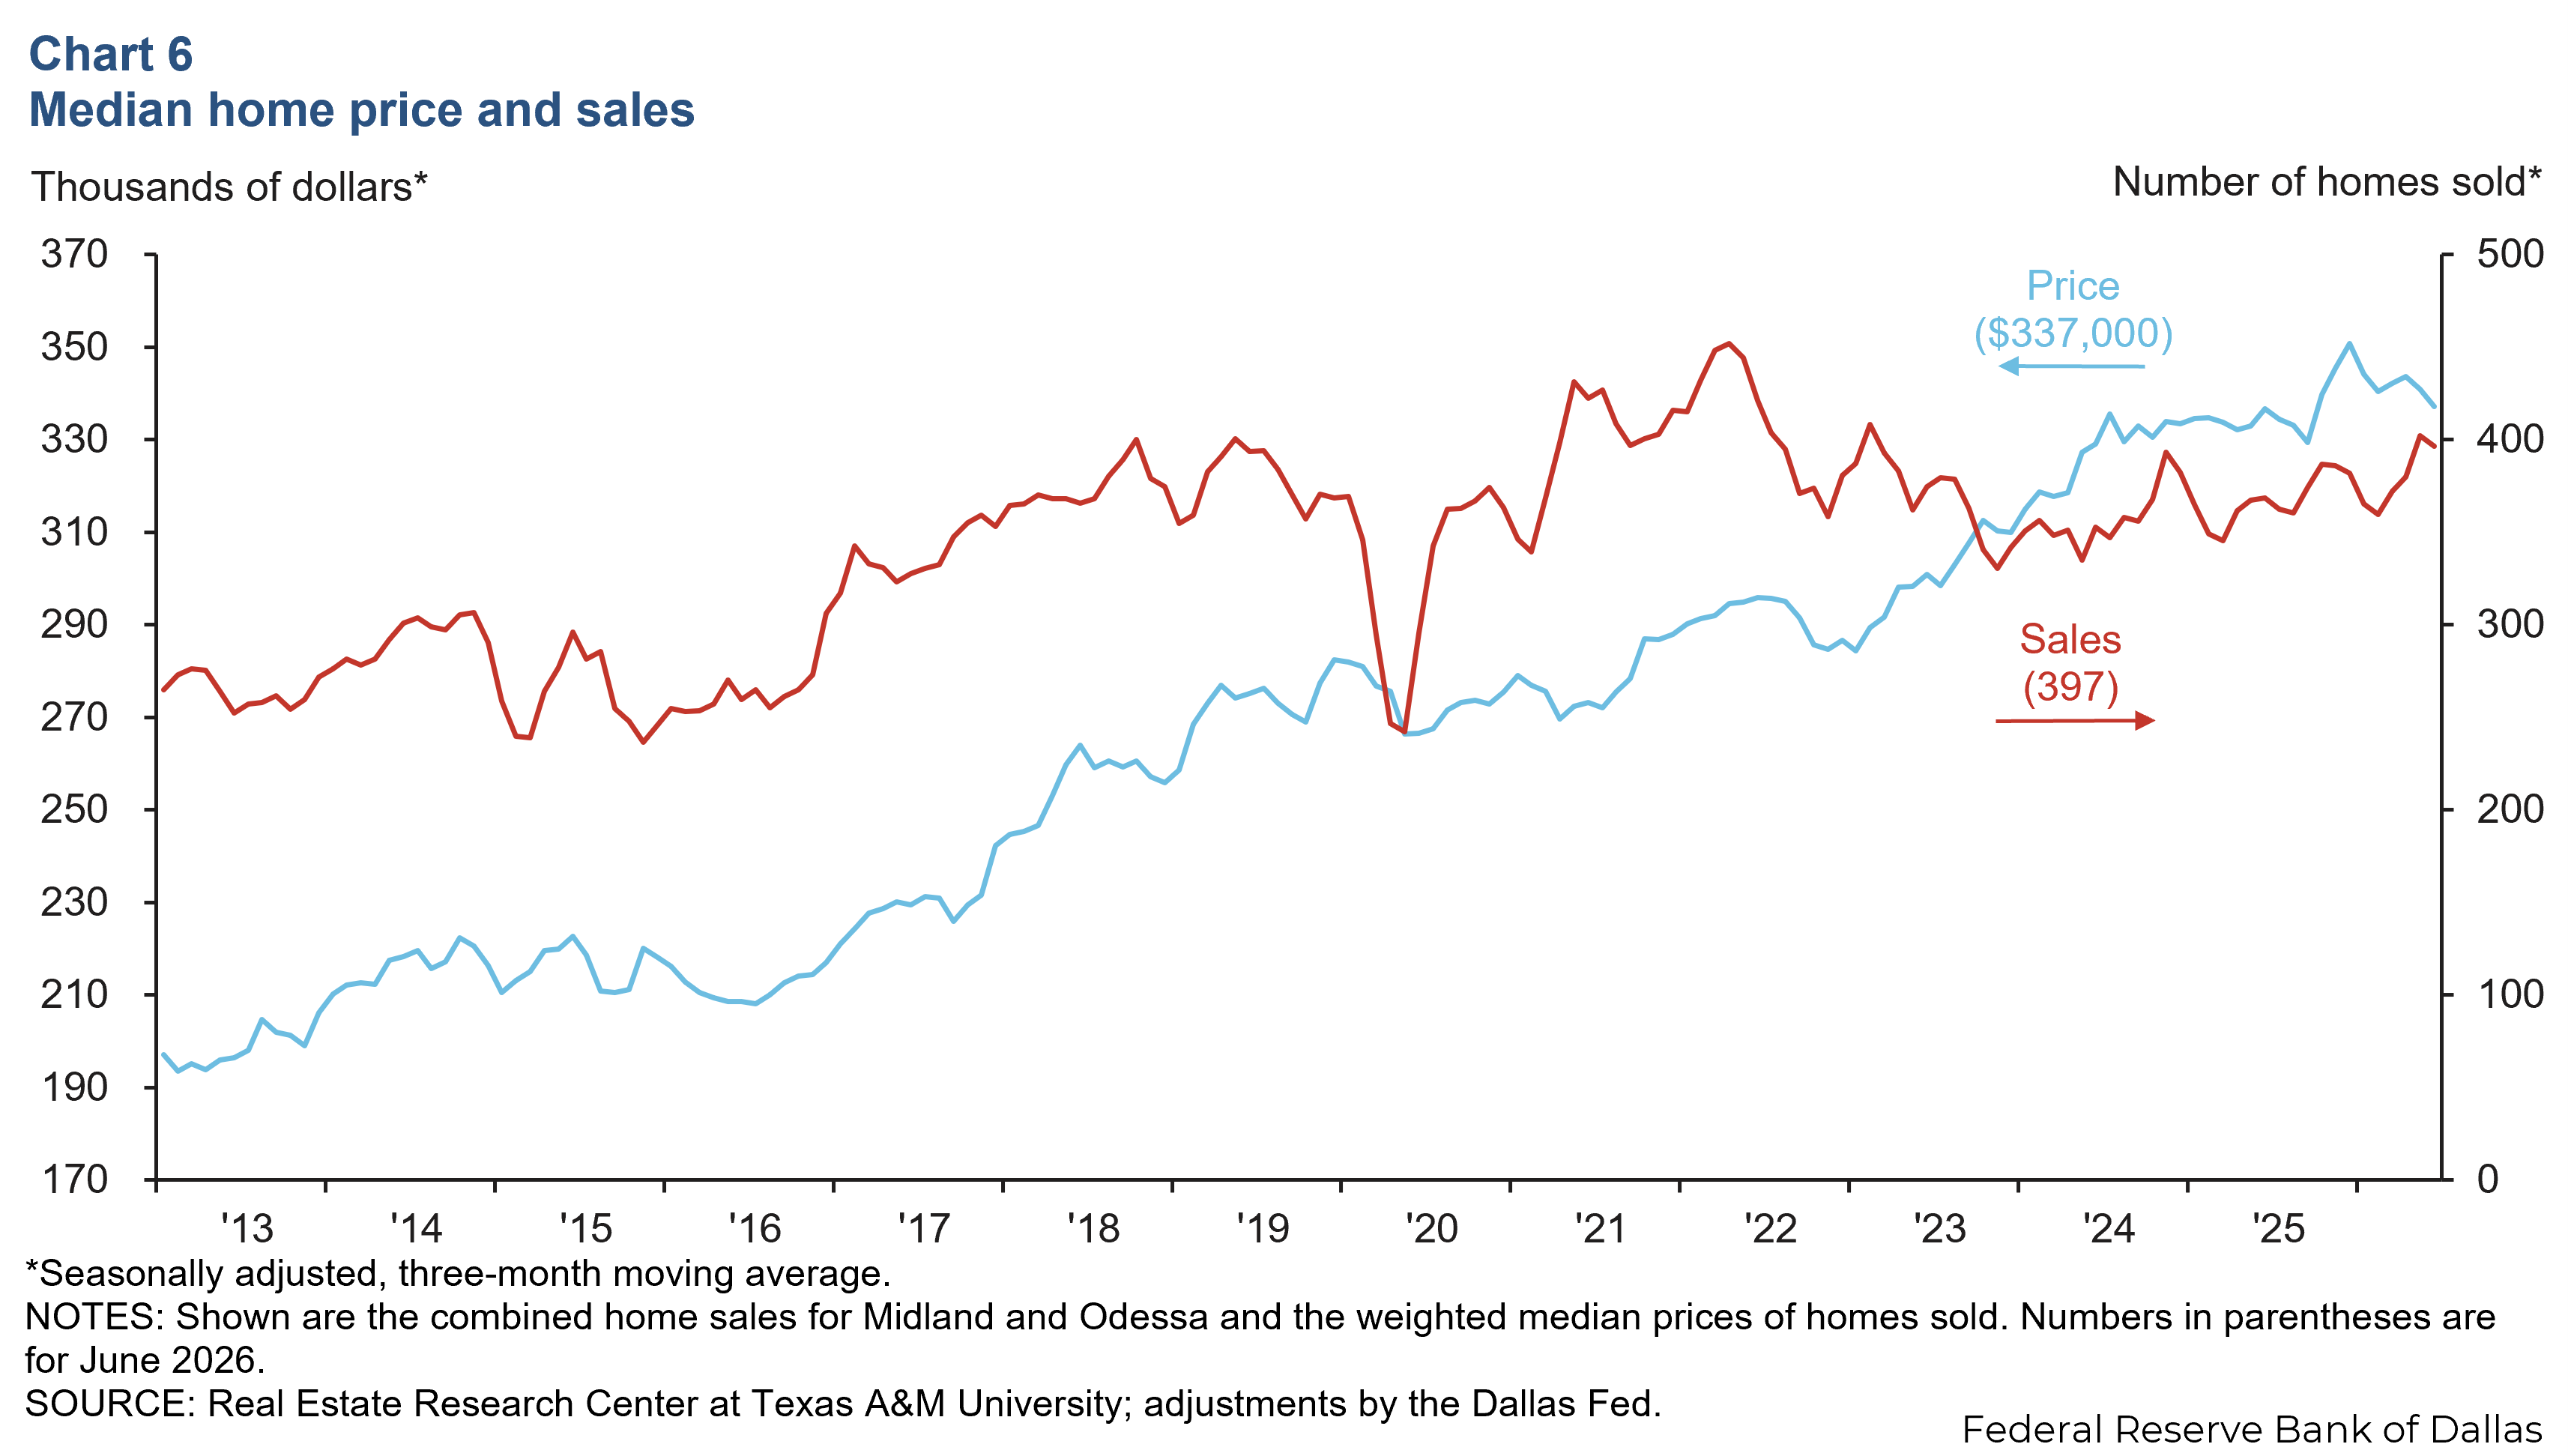
However, after adjusting for inflation, the real median price of homes sold in the Midland–Odessa region in June 2026 was down 1.9 percent from a year prior, while real prices were down 1.9 percent in Texas.
NOTES: Employment data are for the Midland and Odessa metropolitan statistical areas (Martin, Midland and Ector counties), unless otherwise specified. Energy data include the 55 counties in West Texas and southern New Mexico that make up the Permian Basin region. Data may not match previously published numbers due to revisions.
About Permian Basin Economic Indicators
Questions or suggestions can be addressed to Adefemi Abimbola. Permian Basin Economic Indicators is released quarterly.