Rio Grande Valley Economic Indicators

| Rio Grande Valley economy dashboard (June 2026) | ||||
| Job growth (annualized) March–June ’26 |
Unemployment rate |
Avg. hourly earnings |
Avg. hourly earnings growth y/y |
|
| Rio Grande Valley | 1.3% | 6.4% | $22.69 | 7.5% |
| Brownsville | 1.0% | 6.5% | $22.68 | 5.1% |
| McAllen | 1.5% | 6.4% | $22.69 | 8.7% |
Employment continued to expand in the Rio Grande Valley in the second quarter, despite a slight increase in joblessness. Year-over-year wages rose in both Brownsville and McAllen. Water storage in Rio Grande Valley reservoirs ticked up, though it remains well below historical levels. Cross-border trade and travel moderated, while encounters along the southern border remained subdued.
Labor market
Job growth persists
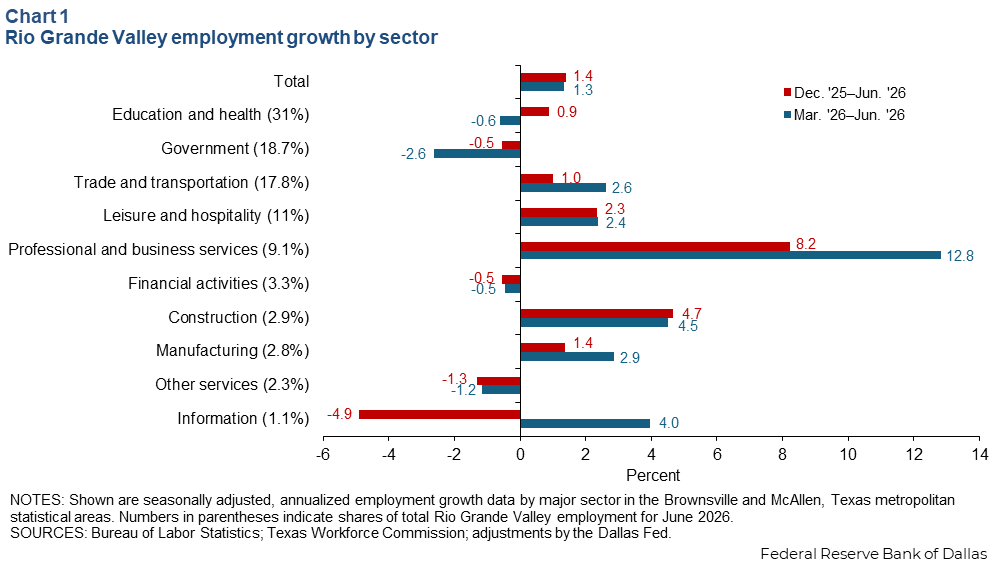
Rio Grande Valley employment rose an annualized 1.3 percent from March to June (1,540 jobs), slower than Texas (2.4 percent), but faster than the U.S. (0.2 percent) increase (Chart 1). Growth was led by professional and business services (1,270 jobs, 12.8 percent), trade and transportation (540 jobs, 2.6 percent), and construction (150 jobs, 4.5 percent). Employment contracted across some industries, including government (-580 jobs, -2.6 percent).
Unemployment converges in metros
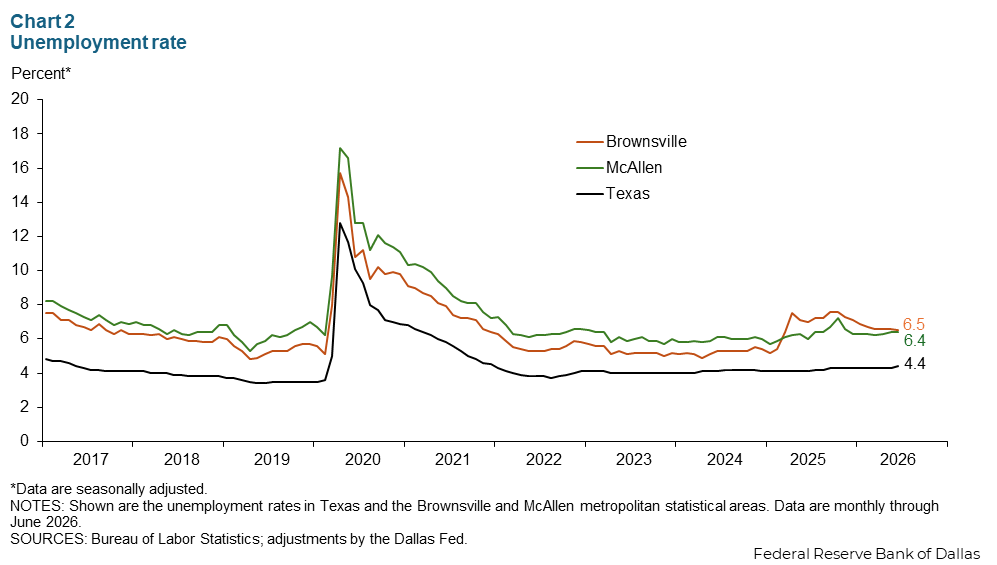
Unemployment slipped from 6.6 percent to 6.5 percent in Brownsville but rose from 6.2 percent to 6.4 percent in McAllen in the second quarter (Chart 2). Consistent with the past several years, unemployment remained two percentage points higher than the statewide rate. The national unemployment rate dipped to 4.2 percent in the second quarter.
Wage growth outpaces state increases
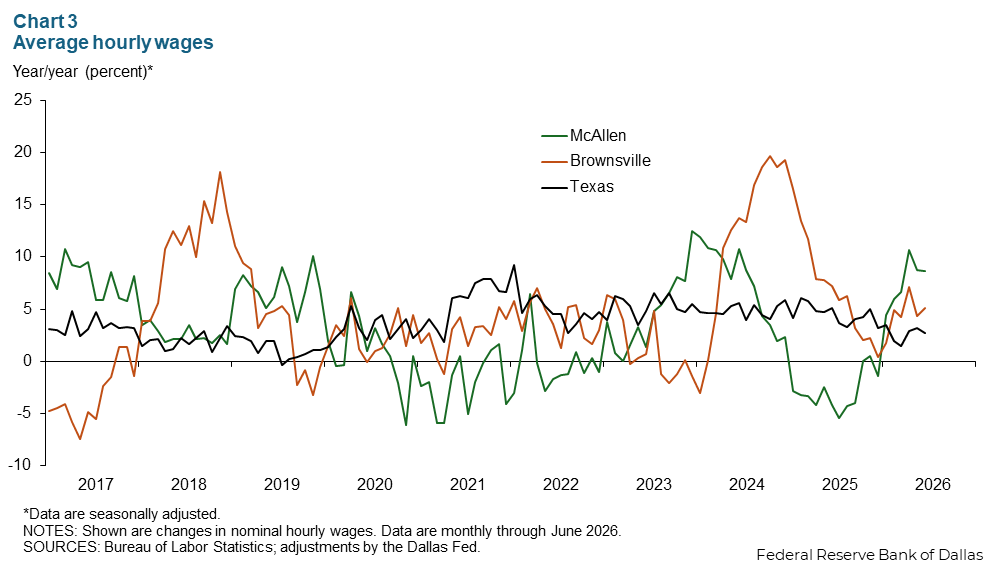
Private sector hourly wages increased in the Rio Grande Valley, up 5.1 percent in Brownsville and 8.7 percent in McAllen year over year in June (Chart 3). Wages across Texas rose as well, though more modestly at 2.7 percent over the same period.
Water availability
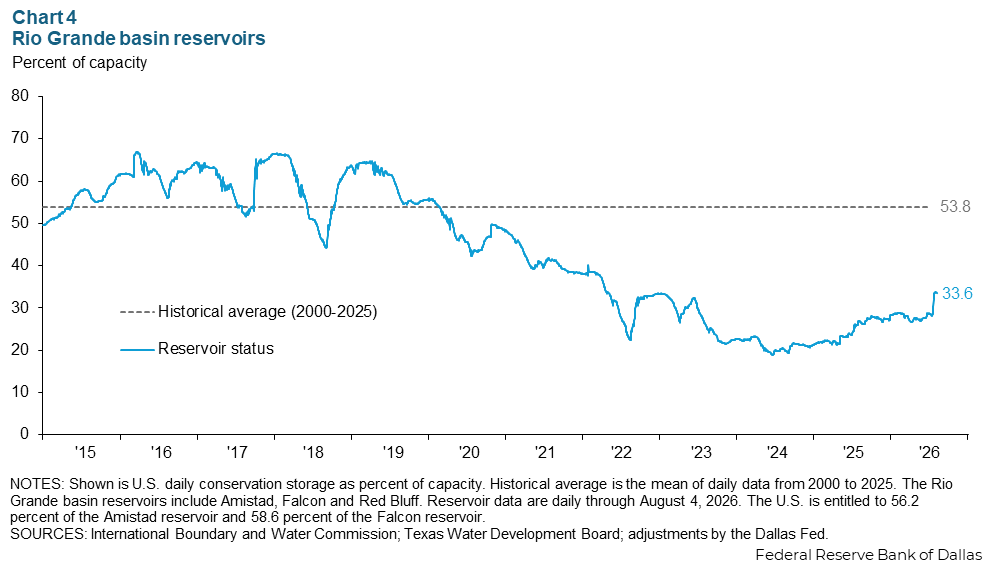
Reservoirs in the Rio Grande Valley saw an increase in water availability in recent months due to rainfall, reaching 33.6 percent of storage capacity in early August (Chart 4). Nonetheless, current levels remain 20-percentage points below the historical average. Water shortages have been impacted by reduced deliveries from Mexico under the 1944 U.S.–Mexico Water Treaty.
Border activity
Cross-border traffic slows
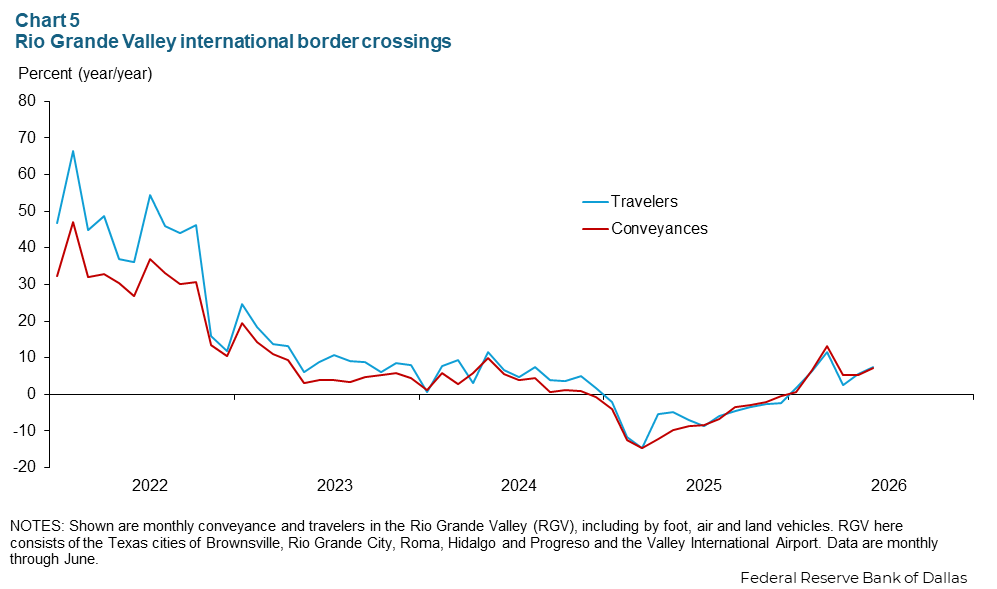
Growth in the movement of goods and people across the border slowed in the second quarter amid trade policy uncertainty, including the US–Mexico–Canada Agreement. In June, growth in both traveler and conveyance crossings dipped below 8 percent year over year (Chart 5). Travelers are individuals seeking entry into the U.S., while conveyances refer to modes of transportation crossing the border by land or air.
Border encounters remain low
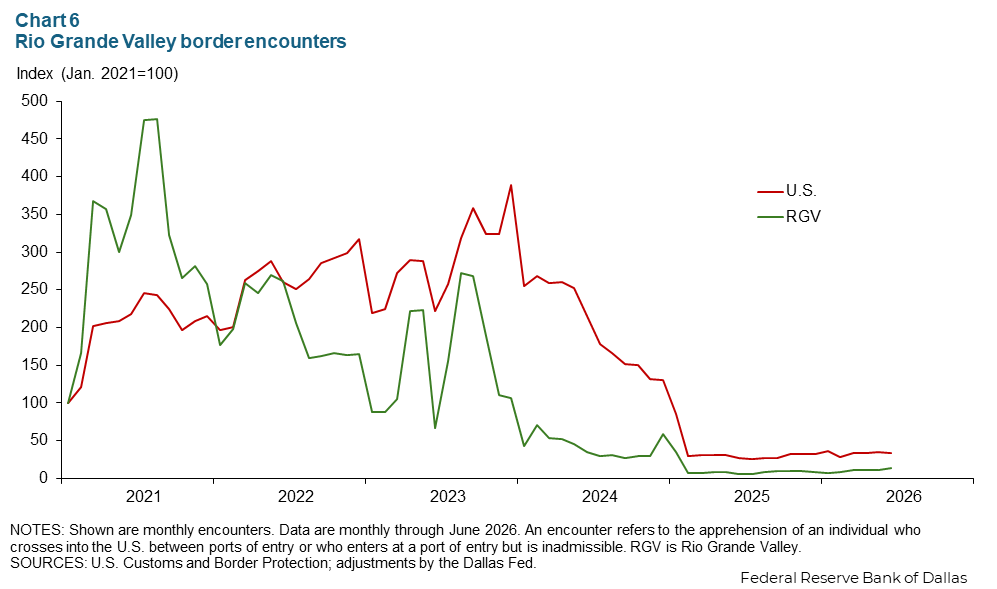
Border Patrol encounters remained steady in the second quarter of 2026, both nationally and in the Rio Grande Valley sector, continuing the trend of low activity since early 2025 (Chart 6). An encounter refers to apprehension of individuals crossing into the U.S. between ports of entry, as well as individuals deemed inadmissible at ports of entry.
NOTE: Data may not match previously published numbers due to revisions.
About Rio Grande Valley Economic Indicators
Questions or suggestions can be addressed to Sebastian Naginski. Rio Grande Valley Economic Indicators is released quarterly.