San Antonio Economic Indicators

April 24, 2020
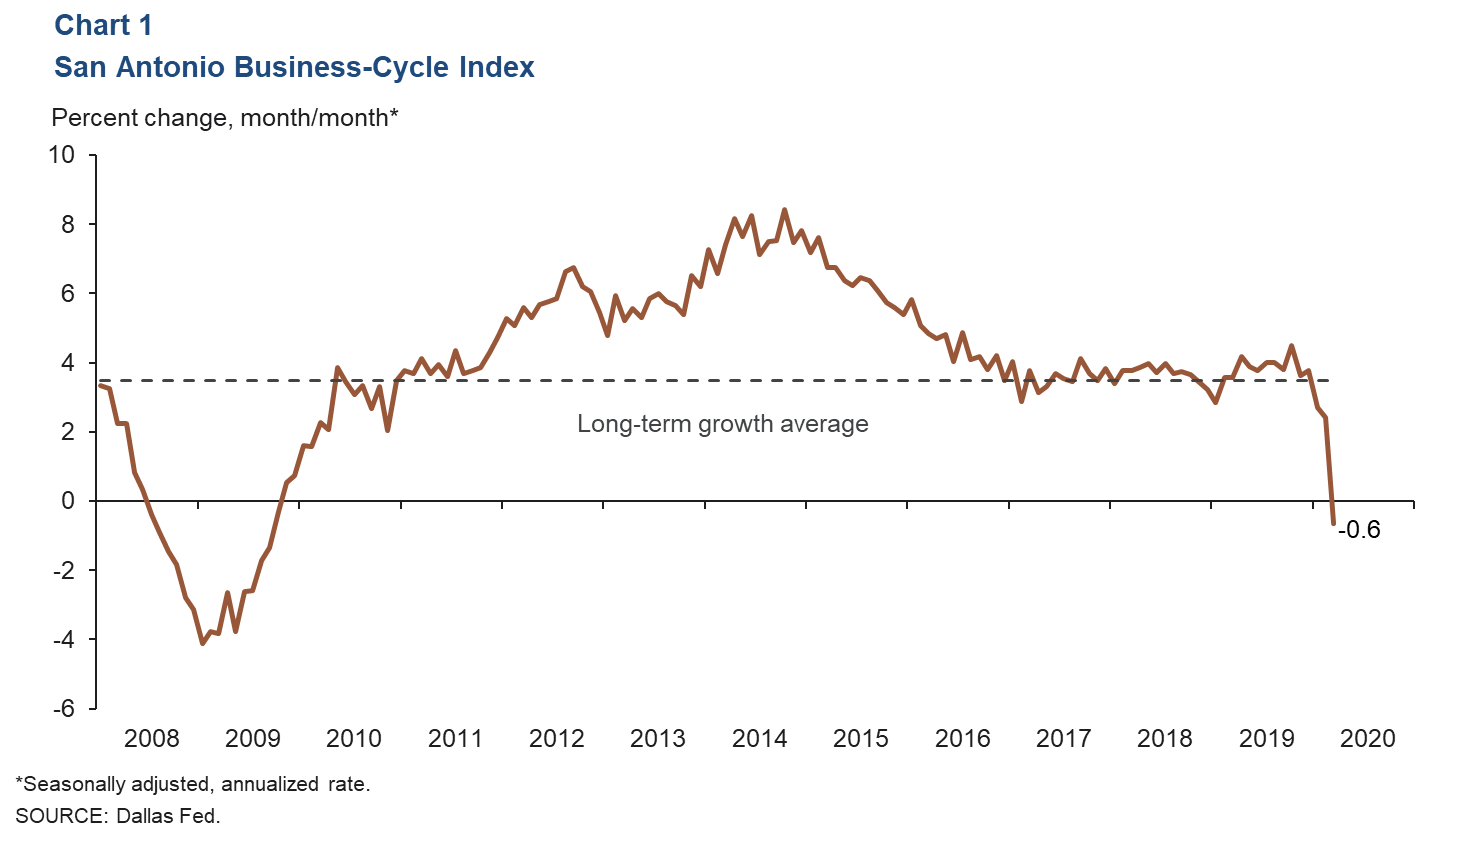
San Antonio’s economy contracted in March as impacts of COVID-19 (coronavirus) began to surface. The San Antonio Business-Cycle Index declined for the first time since November 2009. The unemployment rate increased, recent payrolls declined, and initial claims for unemployment insurance surged. Home sales activity declined in March, and stock prices of San Antonio-based companies were unchanged on net in late March and most of April.
Business-Cycle Index
The San Antonio Business-Cycle Index—a broad measure of economic activity in the metro—contracted at 0.6 percent annualized in March, well below the long-term average of 3.5 percent (Chart 1). Weakness in the index can be attributed to higher unemployment and job decreases.
Labor Market
Unemployment Rate Rises
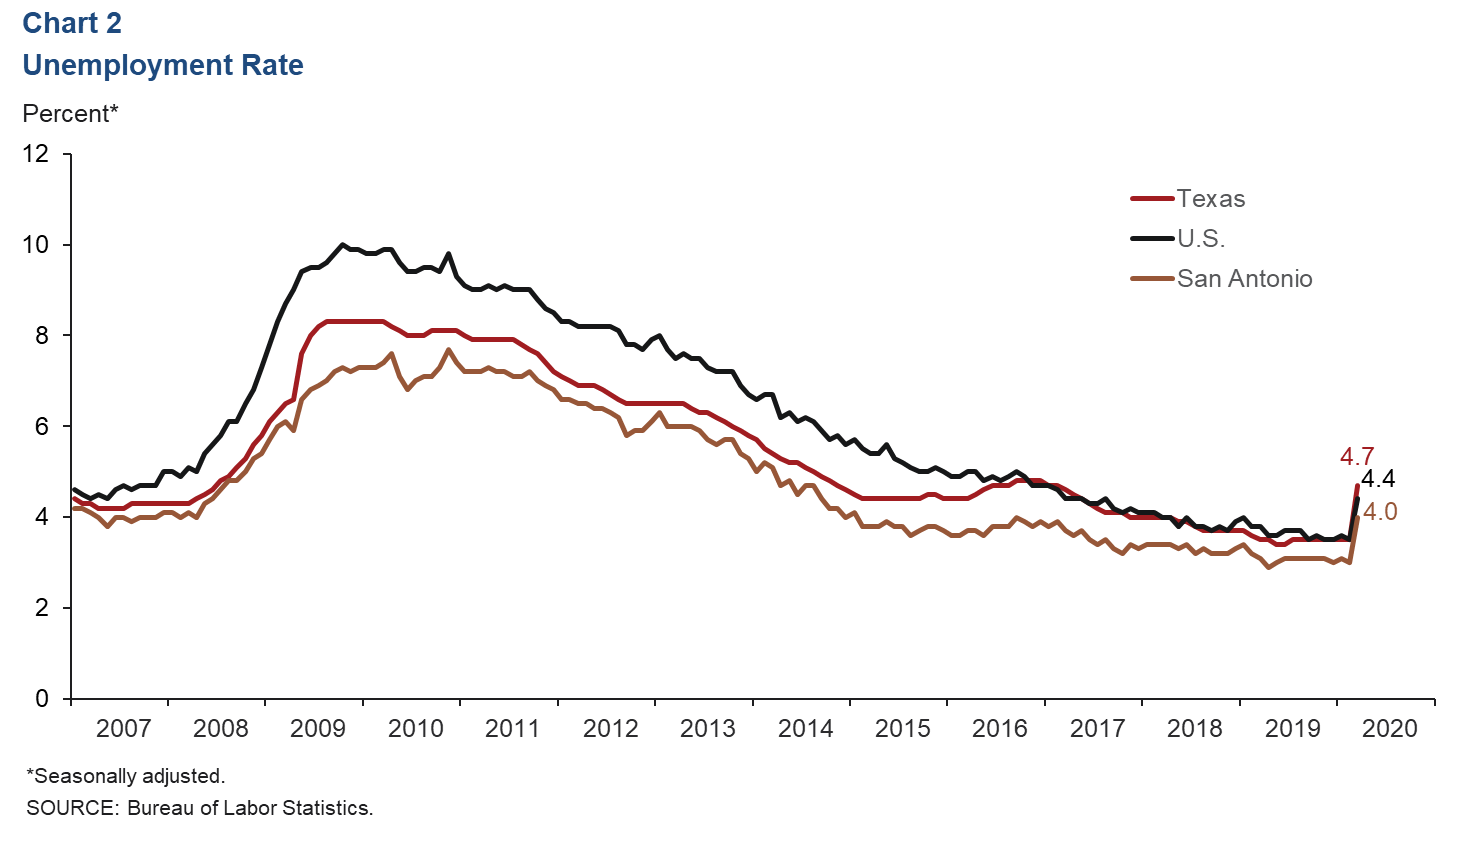
The metro unemployment rate increased to 4.0 percent in March, while the state and national rates rose to 4.7 and 4.4 percent, respectively (Chart 2). Because unemployment data are measured for the week that includes the 12th of the month, the effect of coronavirus in San Antonio was not fully represented by the March data.
Payrolls Decline in First Quarter
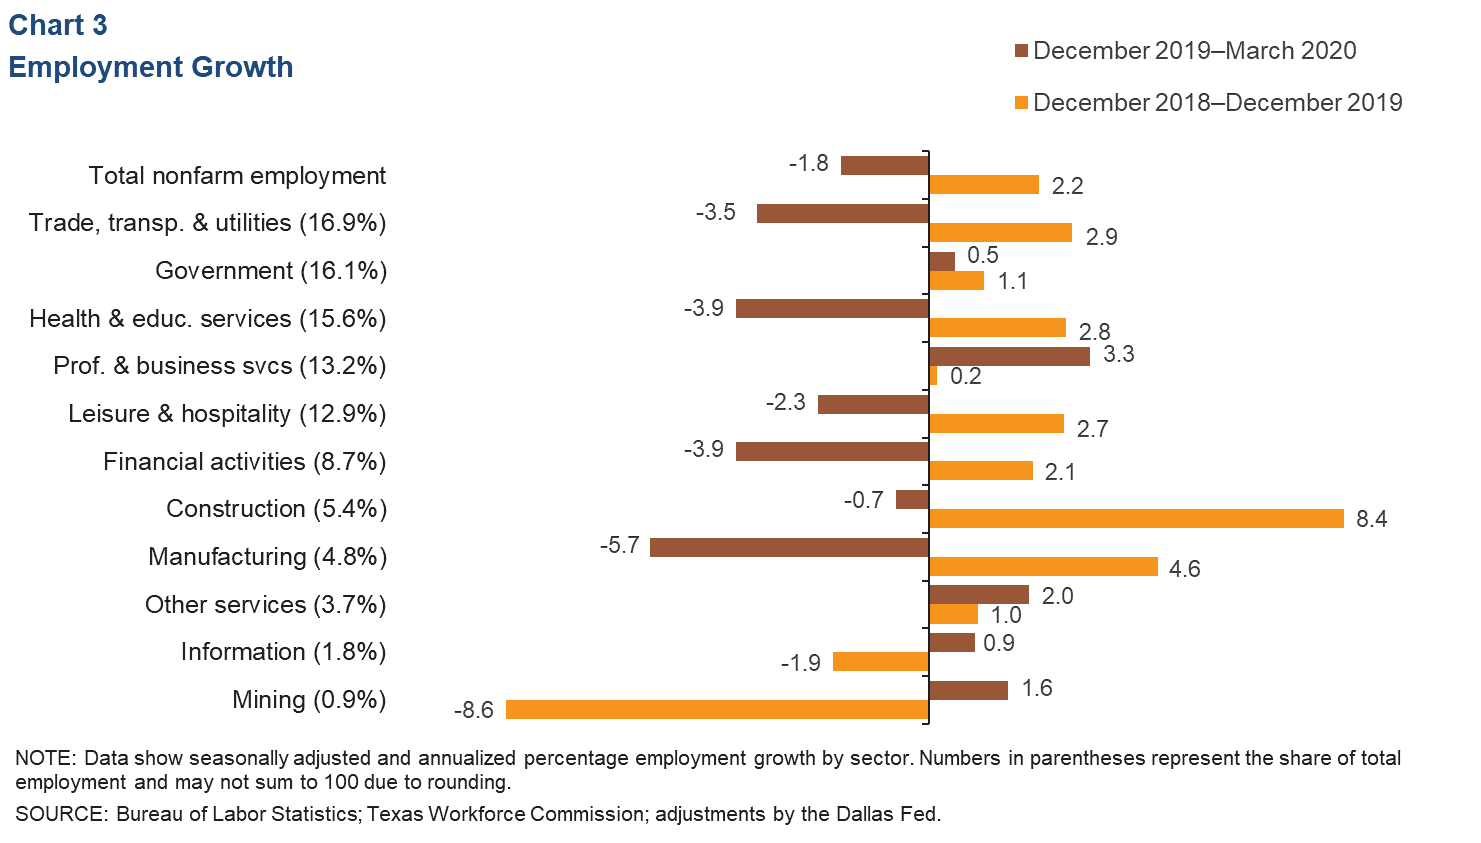
San Antonio jobs decreased 1.8 percent annualized in the first quarter (Chart 3). The job loss was concentrated in March when jobs declined by 8.1 percent and private sector jobs declined by 9.3 percent. Most sectors experienced job loss during the quarter, although the professional and business services, mining, information and other services sectors posted job growth. Manufacturing saw the largest employment declines (-5.7 percent annualized, or 770 net jobs) and was followed by health and education (-3.9 percent, or 1,700 jobs), financial activities (-3.9 percent, or 3,780 jobs), and trade, transportation and utilities (-3.5 percent, or 6,580 jobs).
Unemployment Claims Surge
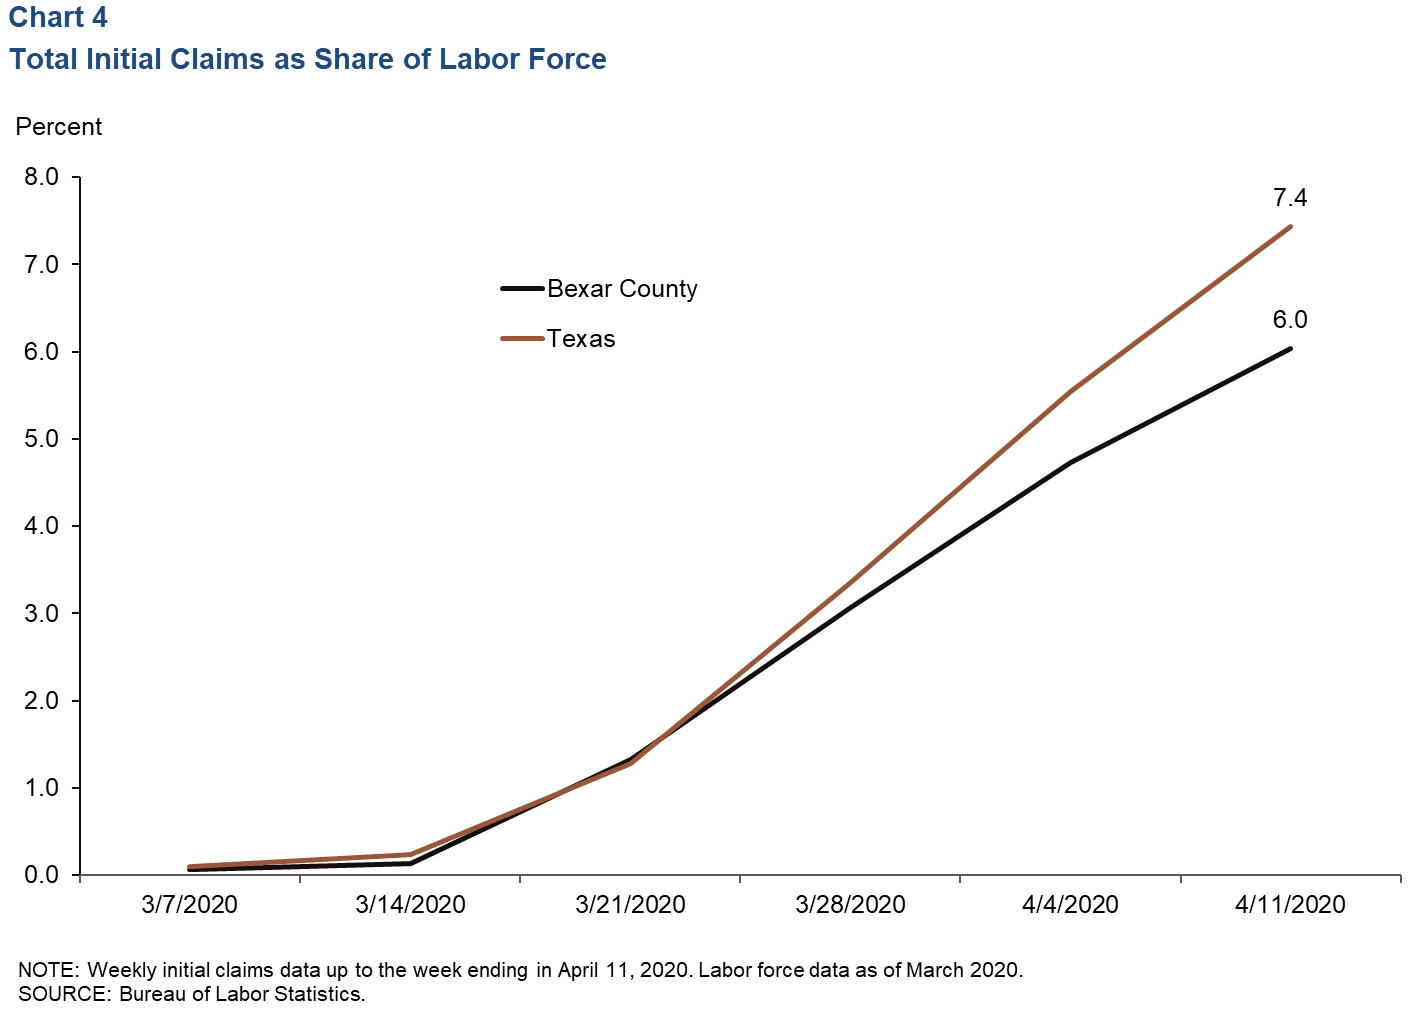
Initial claims for unemployment insurance benefits for the week ending April 11 were 15,720. As of April 11, total initial claims filed since March 7 (72,650) represented 6.0 percent of the labor force in Bexar County, slightly lower than Texas’ 7.4 percent (1.04 million total initial claims filed during the same time period) (Chart 4).
Real Estate
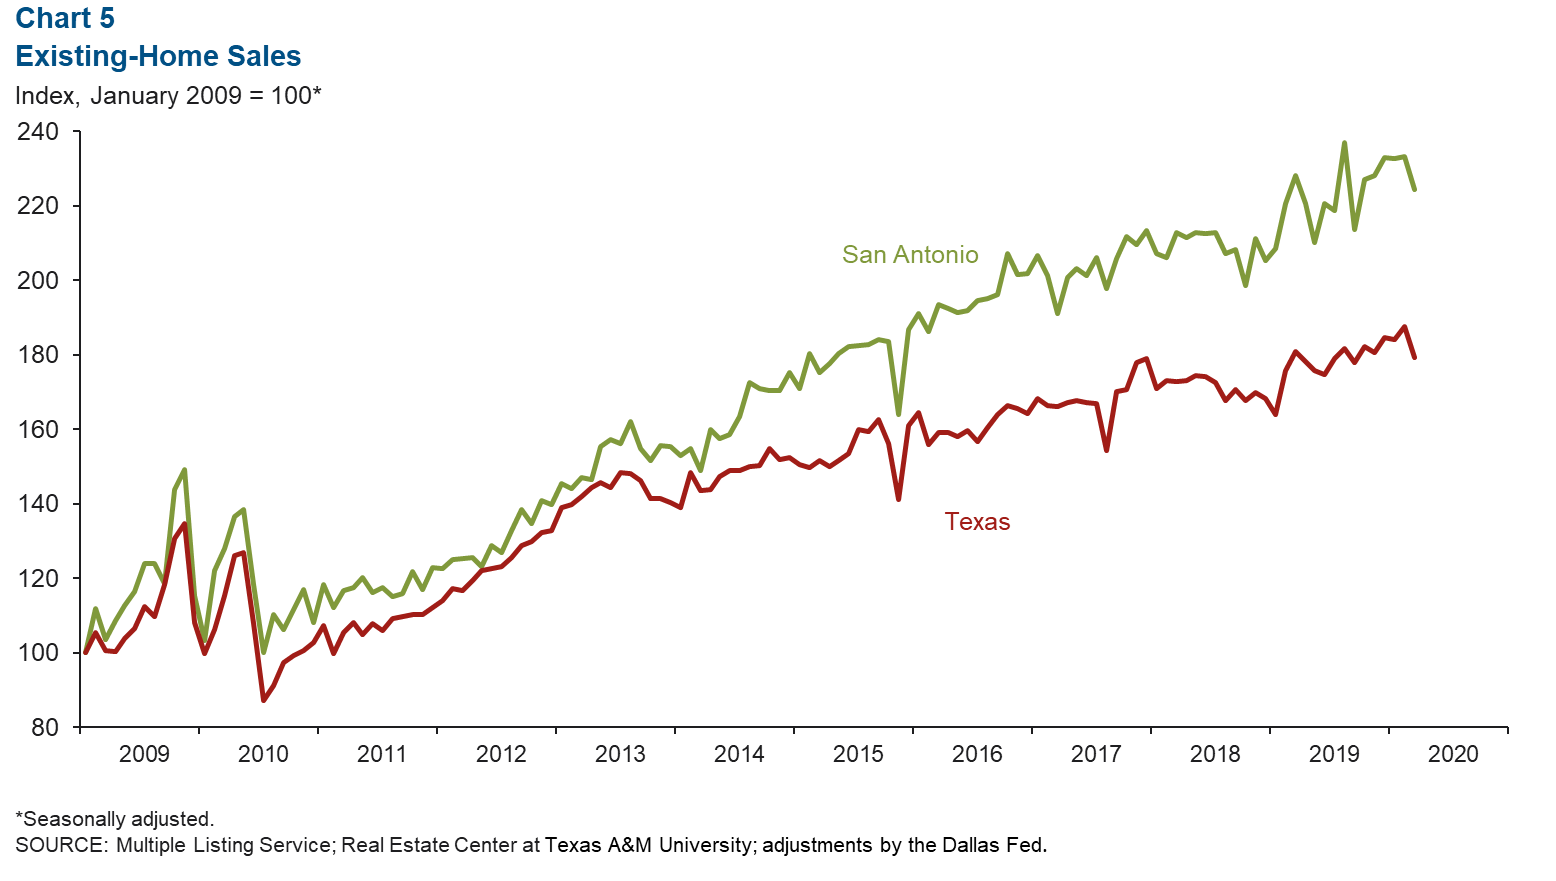
Existing-home sales in the metro declined 3.8 percent in March, a little less than the state’s 4.5 percent decrease (Chart 5). Relative to fourth quarter 2019, first-quarter sales were unchanged in the metro and up 1.0 percent in the state. In March, the median price of homes sold in San Antonio was $242,772 (5.0 percent increase year/year) and $248,681 (4.3 percent increase year/year) in Texas.
Stock Prices
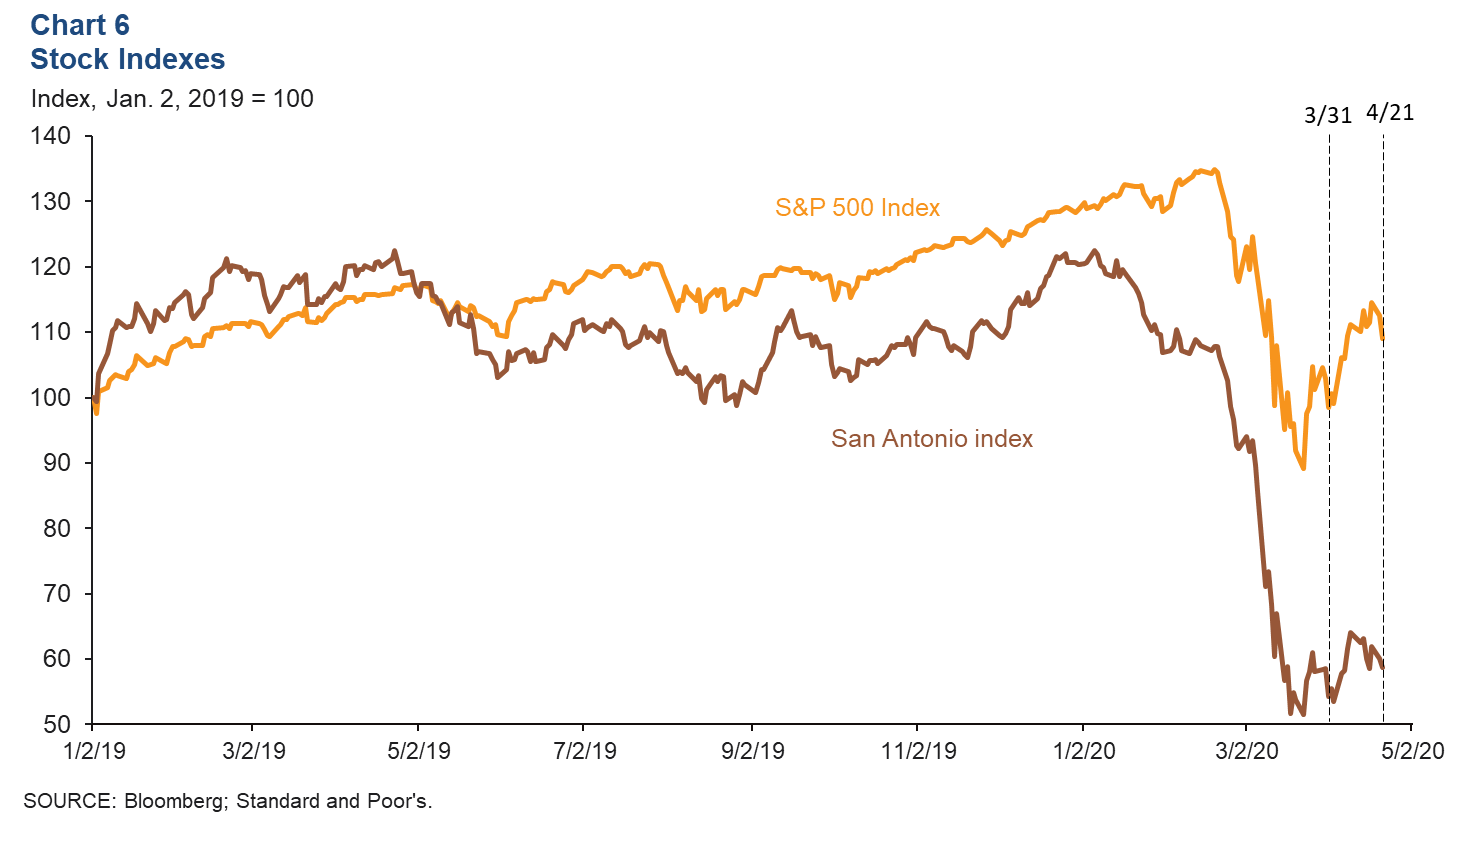
Stock prices of San Antonio-based companies have on net remained unchanged from March 31 to April 21, while the S&P 500 posted a 5.9 percent increase during the same period (Chart 6). The manufacturing, energy and communications industries saw modest recoveries. Firms related to manufacturing experienced continued loss in stock value, while companies in the communications and finance sectors posted mixed performances.
NOTE: Data may not match previously published numbers due to revisions.
About San Antonio Economic Indicators
Questions can be addressed to Judy Teng at judy.teng@dal.frb.org. San Antonio Economic Indicators is published every month on the Thursday after state and metro employment data are released.