San Antonio Economic Indicators

March 18, 2021
The San Antonio Business-Cycle Index weakened slightly in January. While the unemployment rate ticked down, jobs contracted. Payroll changes were mixed across industries. Local consumer spending declined in mid-February due to a strong winter storm. Home sales activity surged in January. The number of individuals currently hospitalized with COVID-19 continues to decrease after peaking in late January.
Business-Cycle Index
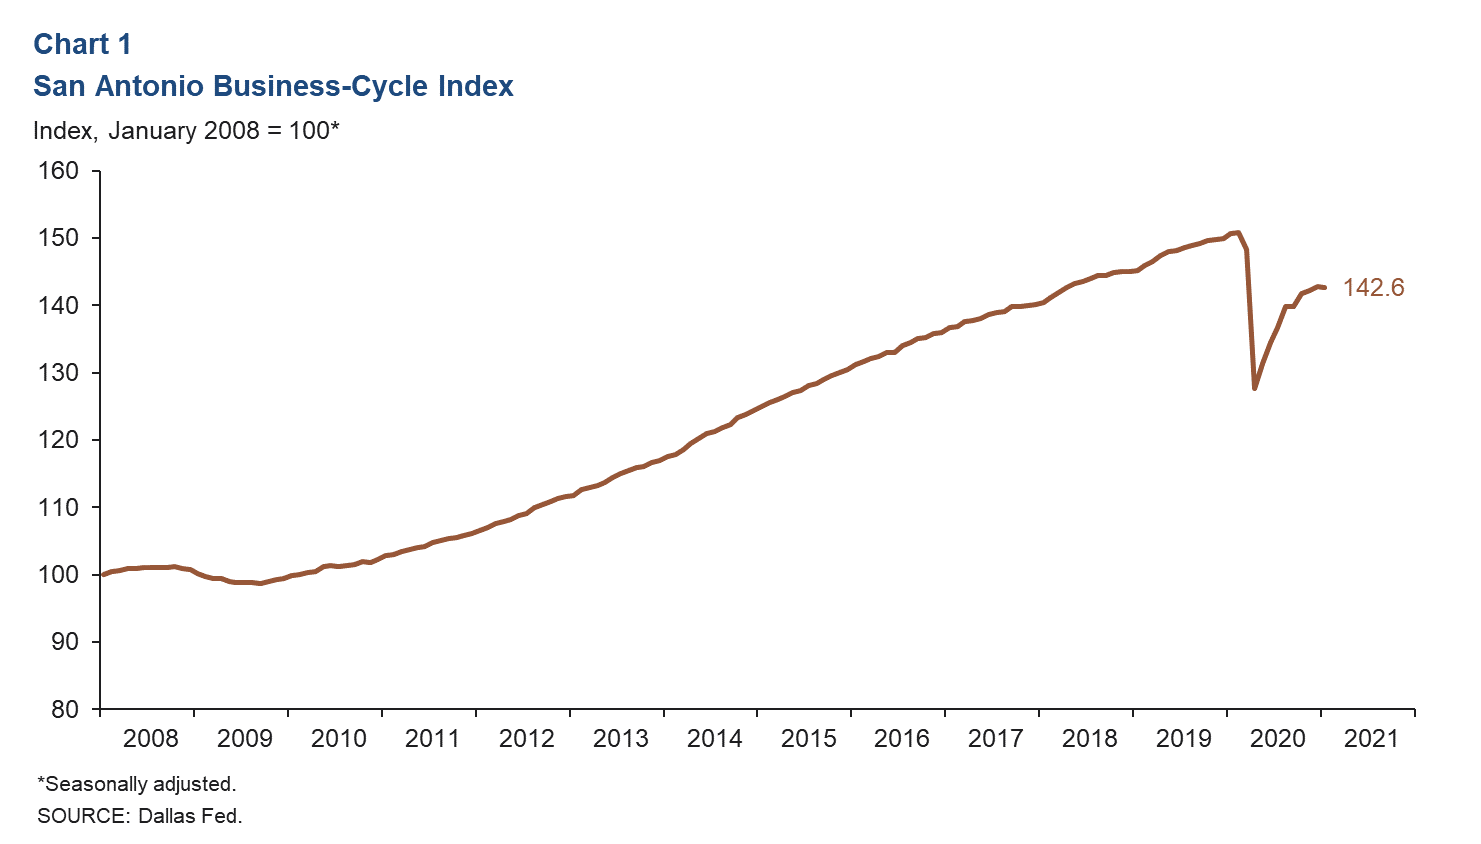
The San Antonio Business-Cycle Index—a broad measure of economic activity in the metro—declined 1.7 percent in January. Overall, the index has flattened out somewhat since COVID-19 hospitalizations surged late in 2020 (Chart 1). The recent weakening is mainly due to to the payroll decline.
Labor Market
Unemployment Rate Ticks Down
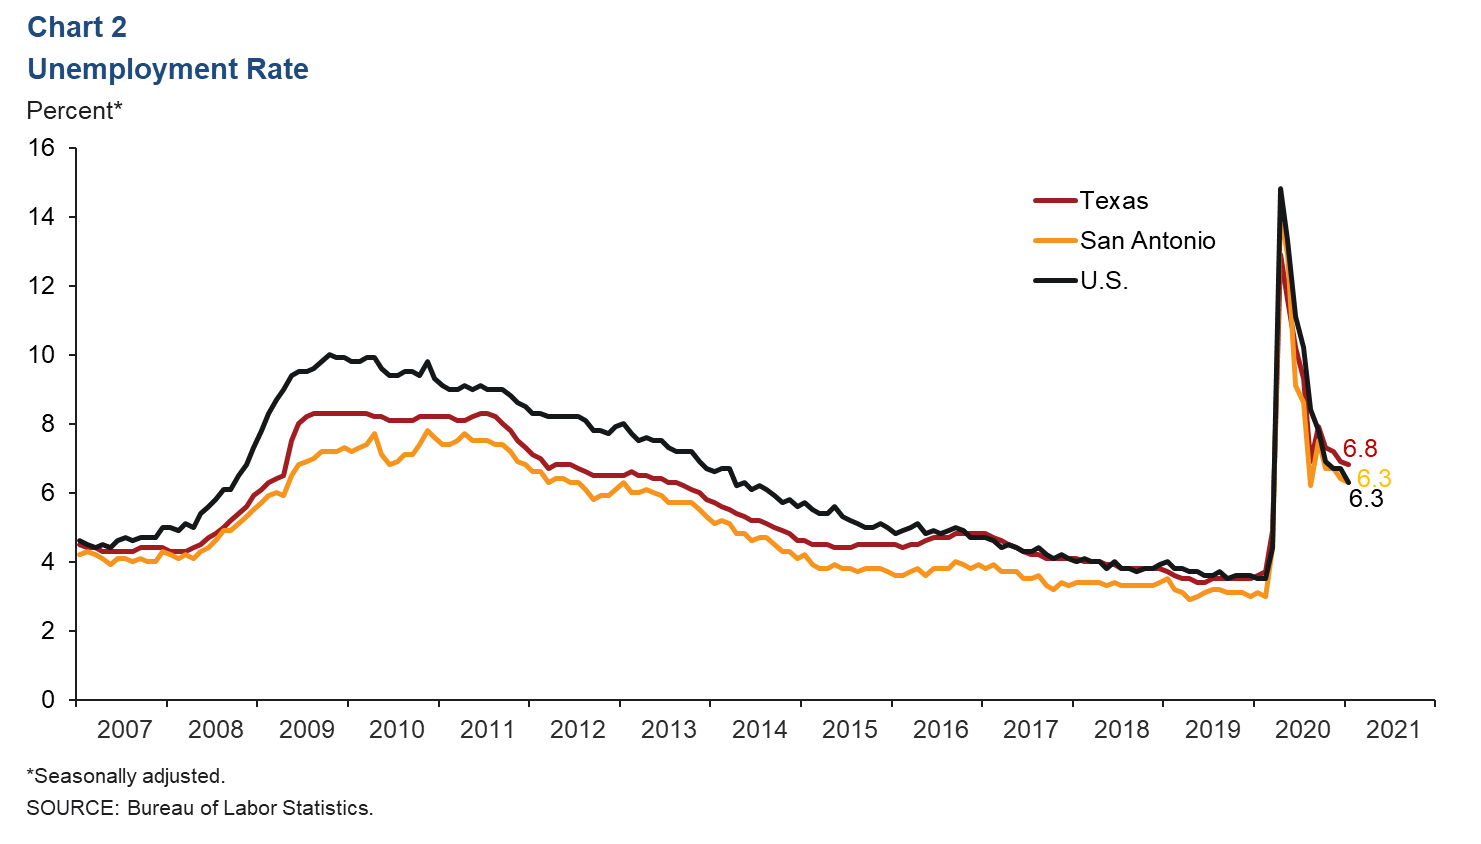
The metro’s unemployment rate fell in January to 6.3 percent. The state and national unemployment rates also declined in January, to 6.8 percent and 6.3 percent, respectively (Chart 2).
Job Growth by Industry Mixed in Recent Months
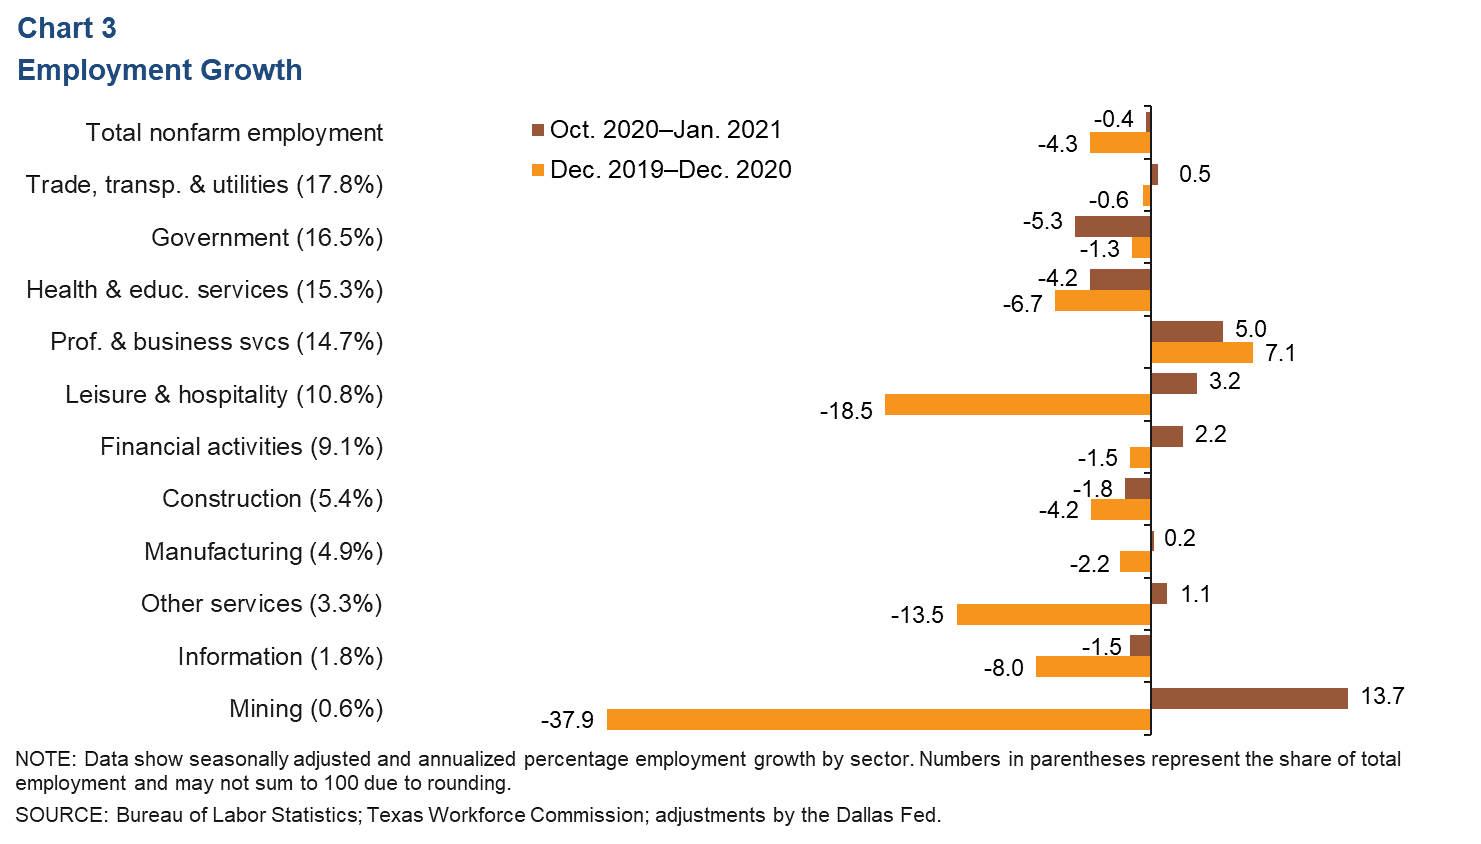
Net payrolls in San Antonio decreased an annualized 0.4 percent (-975 jobs) in the three months ending in January, with performances mixed across industries (Chart 3). The Texas Workforce Commission recently released the annual benchmark revision to job growth from April 2019 to September 2020. This resulted in a revision to the Dallas Fed estimate of 2020 job growth from -6.4 percent to -4.3 percent for San Antonio. Employment fell across all sectors in 2020, with the most significant declines occurring in mining and leisure and hospitality.
Consumer Spending
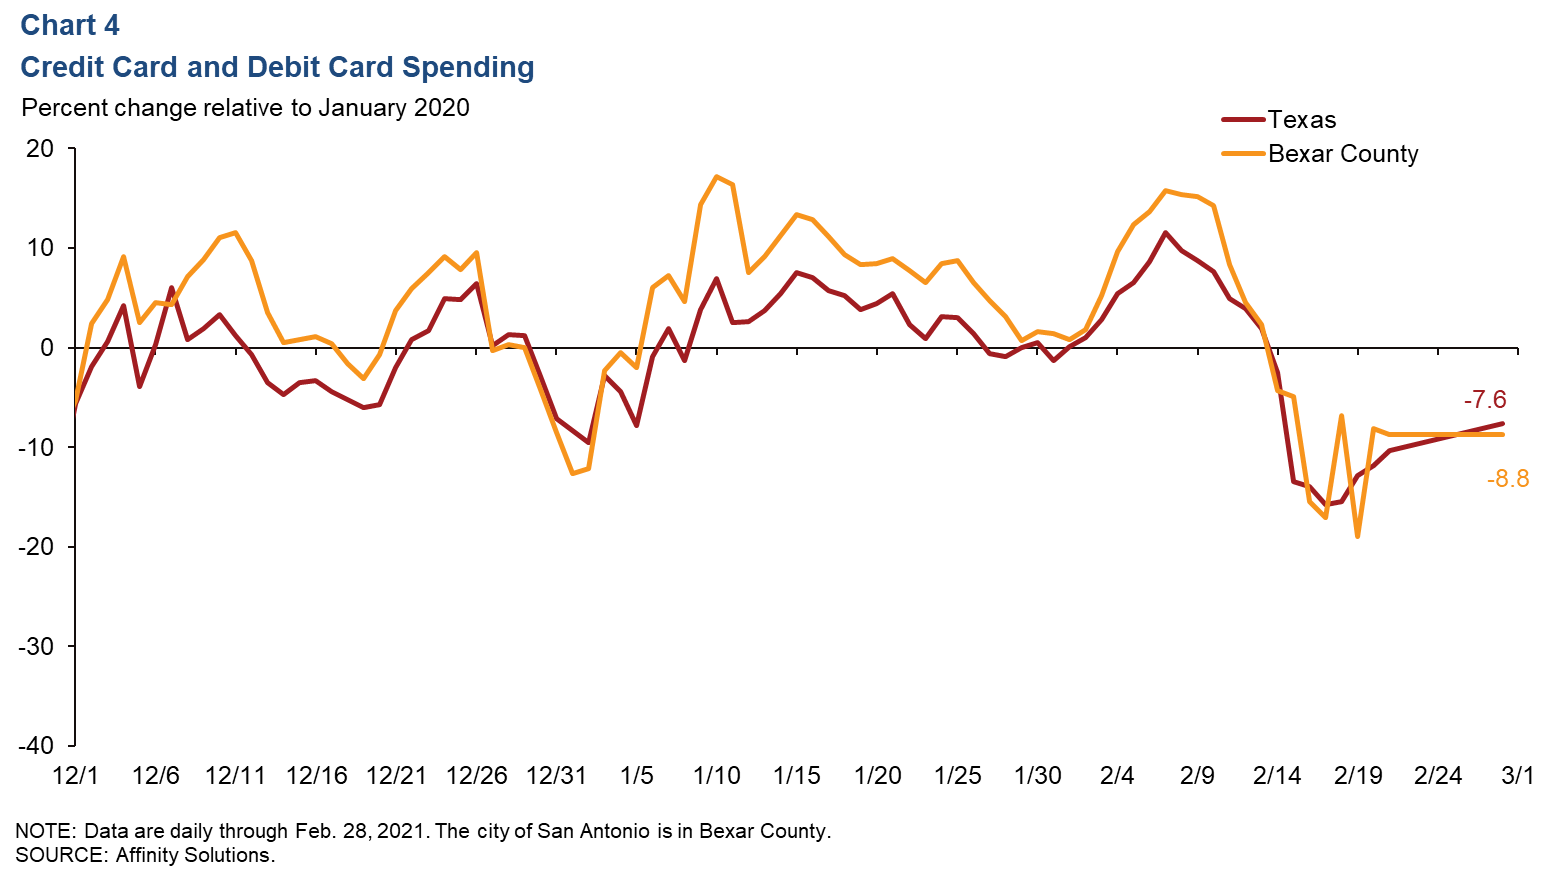
Since early December 2020, consumer spending has remained generally above January 2020 levels, except for brief dips to below prepandemic levels during mid-December and the Christmas and New Year’s holiday weeks. Since Feb. 14, consumer spending has remained below prepandemic levels due to the polar vortex storm. As of Feb. 28, spending was down 8.8 percent in Bexar County and 7.6 percent in the state relative to January 2020 (Chart 4).
Real Estate
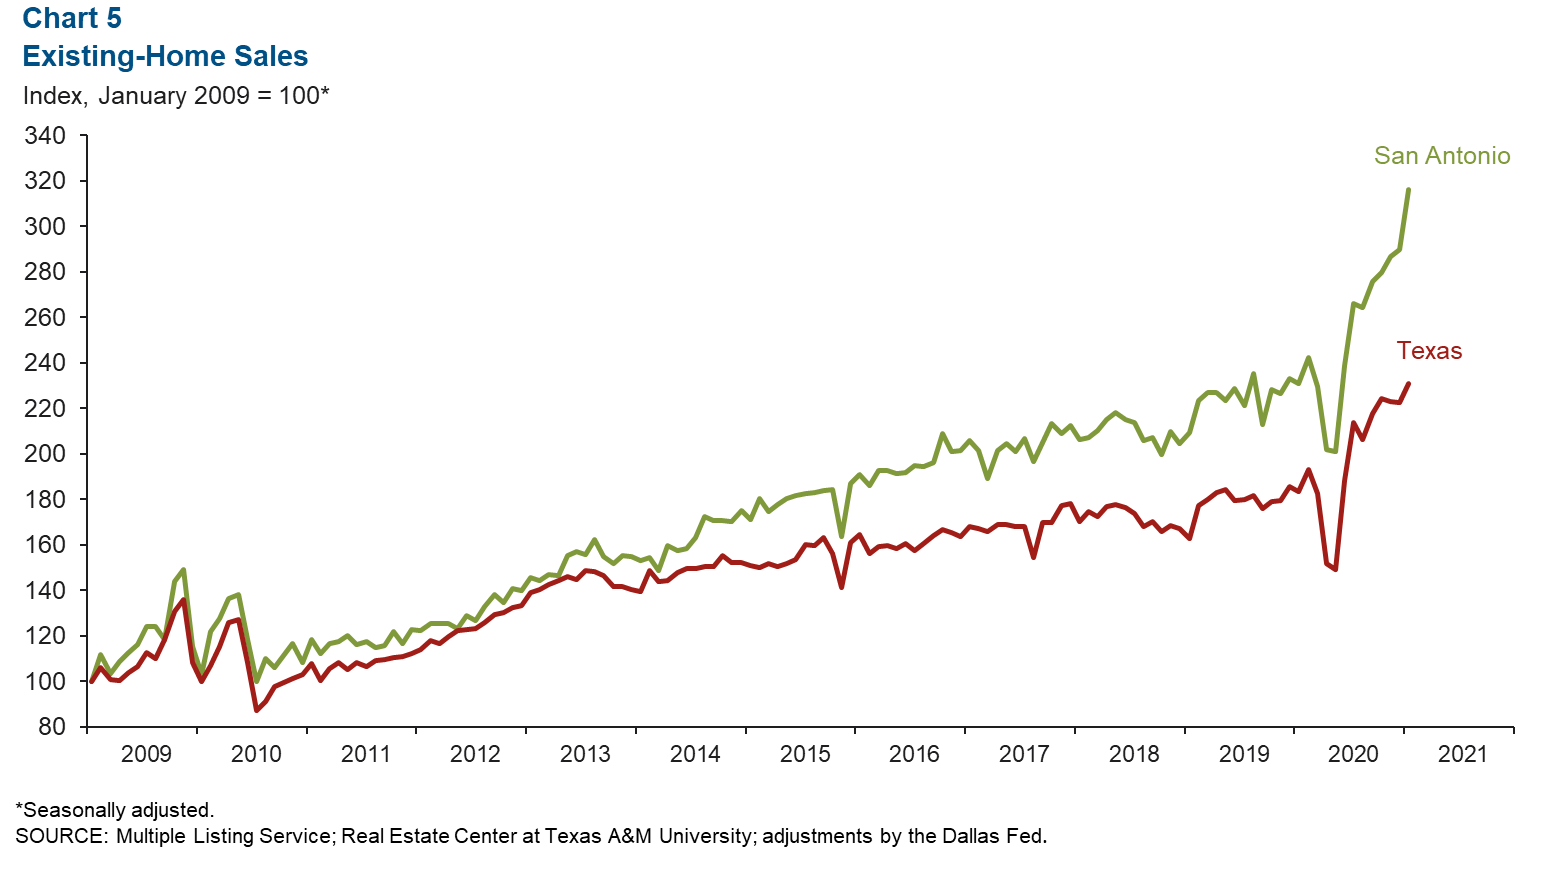
Existing-home sales in January increased 9.2 percent in San Antonio and 3.8 percent in the state (Chart 5). In 2020, the metro’s home sales were up 11.5 percent from 2019—the largest year-over-year increase since 2014 and slightly above the state’s 9.7 percent growth. The median price of homes sold in January was $267,493 in the metro—a 17-year-record rise of 12.6 percent year over year—and $276,779 in Texas, an 11.0 percent gain.
COVID-19 Hospitalizations
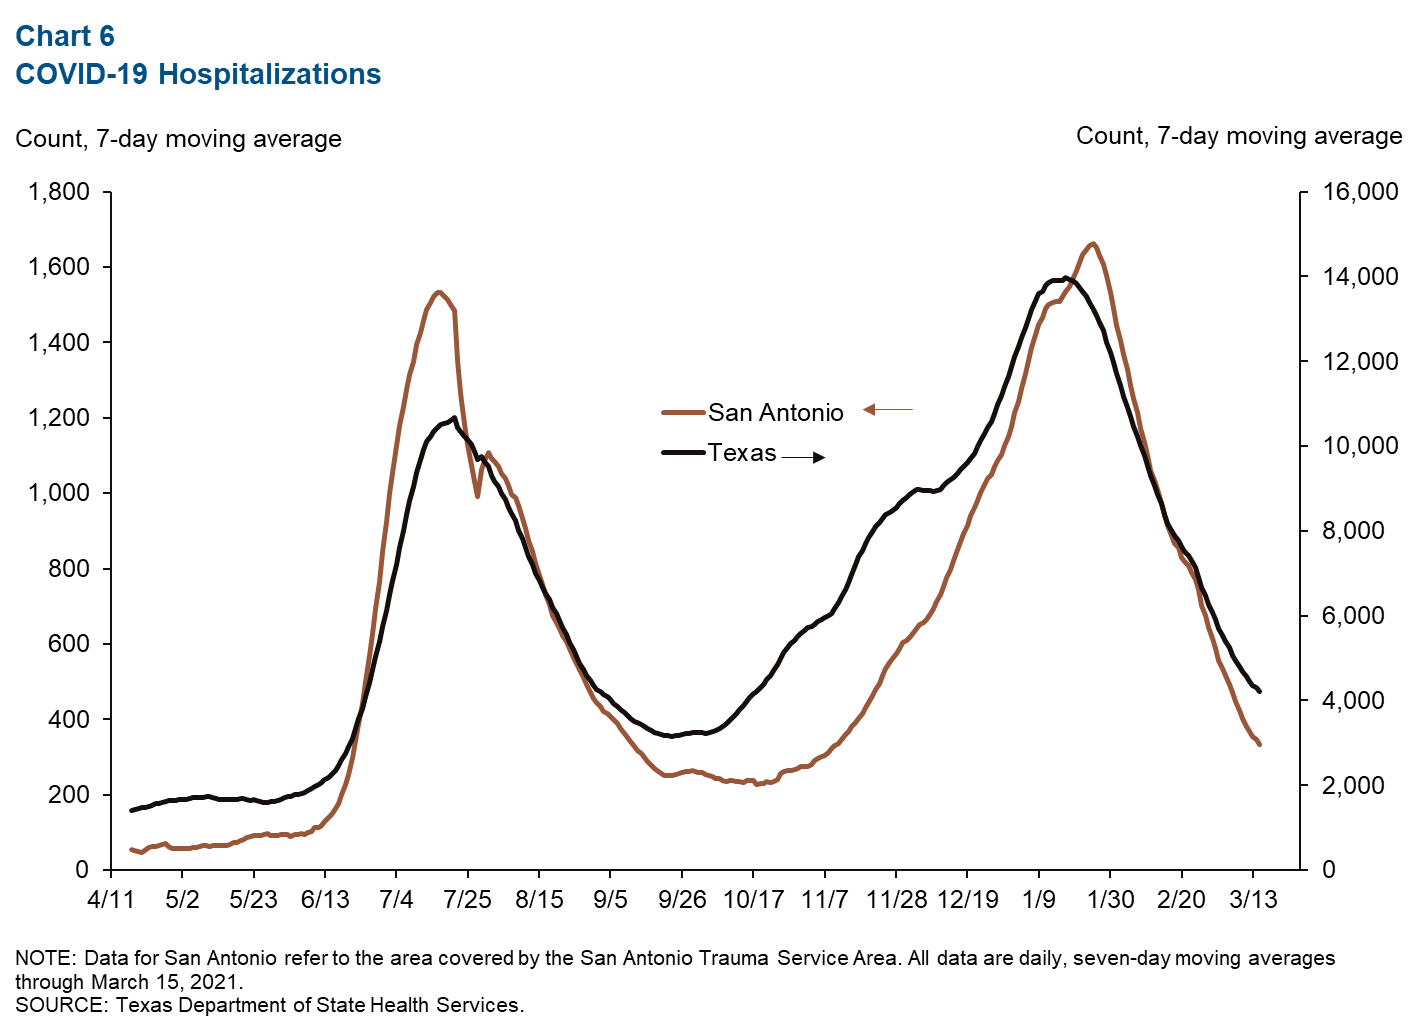
The number of individuals currently hospitalized with COVID-19 in San Antonio has been on the decline since peaking Jan. 25 at 1,661 (Chart 6). At the state level, the number currently hospitalized peaked Jan. 17 at 13,977. As of March 15, the numbers were 334 in San Antonio and 4,211 in Texas.
NOTE: Data may not match previously published numbers due to revisions.
About San Antonio Economic Indicators
Questions can be addressed to Judy Teng at judy.teng@dal.frb.org. San Antonio Economic Indicators is published every month during the week after state and metro employment data are released.