San Antonio Economic Indicators

December 2, 2021
Broad measures of the San Antonio economy were largely positive in October. The San Antonio Business-Cycle Index increased, jobs were added at a moderate pace and the unemployment rate was steady. Consumer spending has slipped recently but remains above prepandemic levels. Home sales slowed in October, and recent COVID-19 hospitalizations leveled out after declining from their most recent peak in late August.
Business-Cycle Index
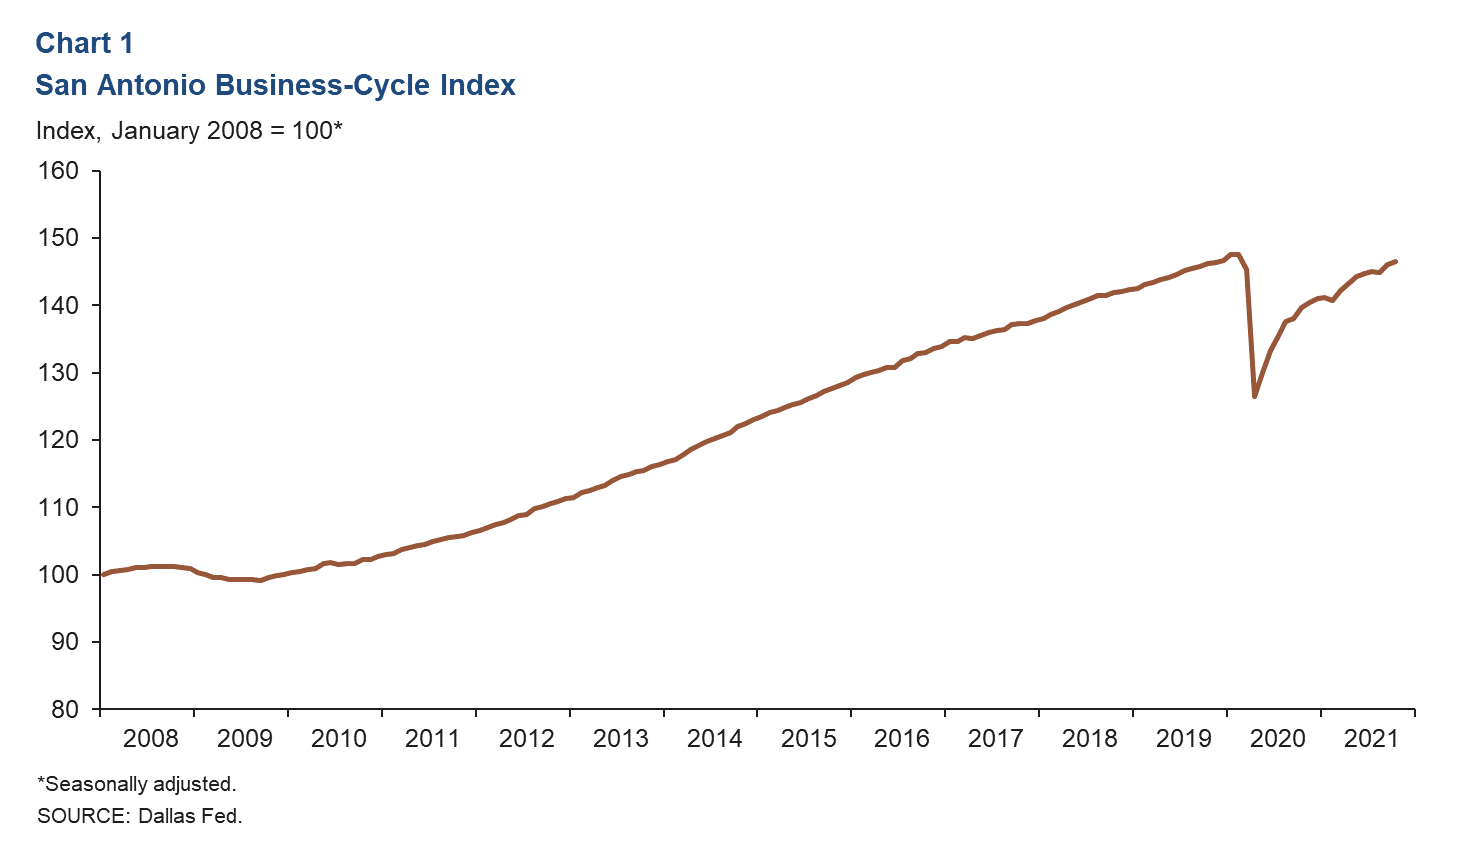
The San Antonio Business-Cycle Index—a broad measure of economic activity in the metro—increased an annualized 3.2 percent in October after strengthening 10.5 percent in September (Chart 1). Recent growth in the index can be largely attributed to net job gains.
Labor Market
Unemployment Rate Unchanged
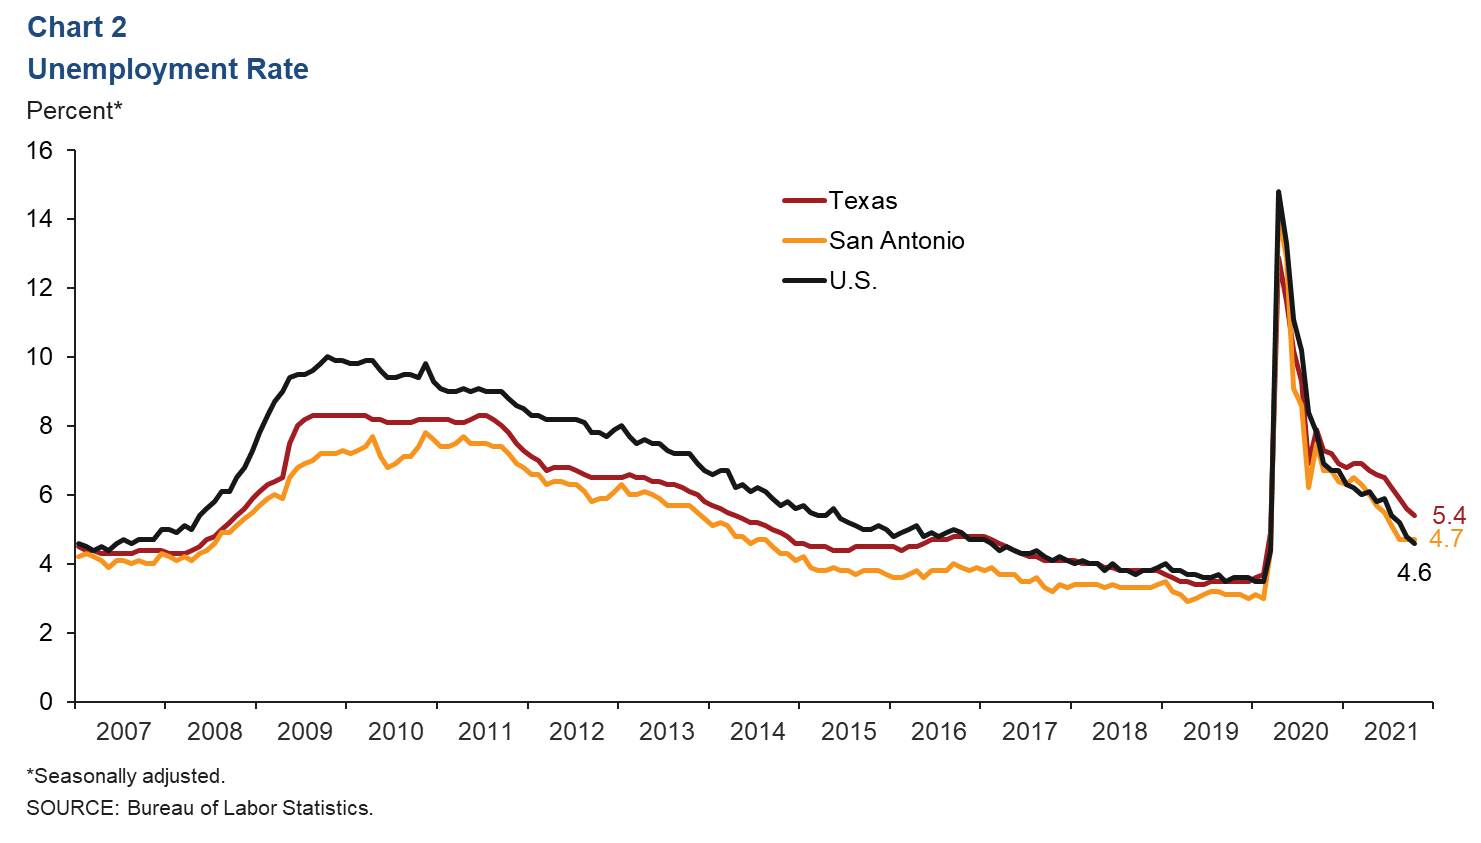
The metro’s unemployment rate was 4.7 percent in October, unchanged since August (Chart 2). The state’s jobless rate declined slightly to 5.4 percent, and the nation’s rate fell to 4.6 percent, the lowest since March 2020. In the three months ending in October, San Antonio’s labor force expanded 6.2 percent, well above Texas’ 2.8 percent and the nation’s 0.3 percent gains.
Job Gains Broad Based
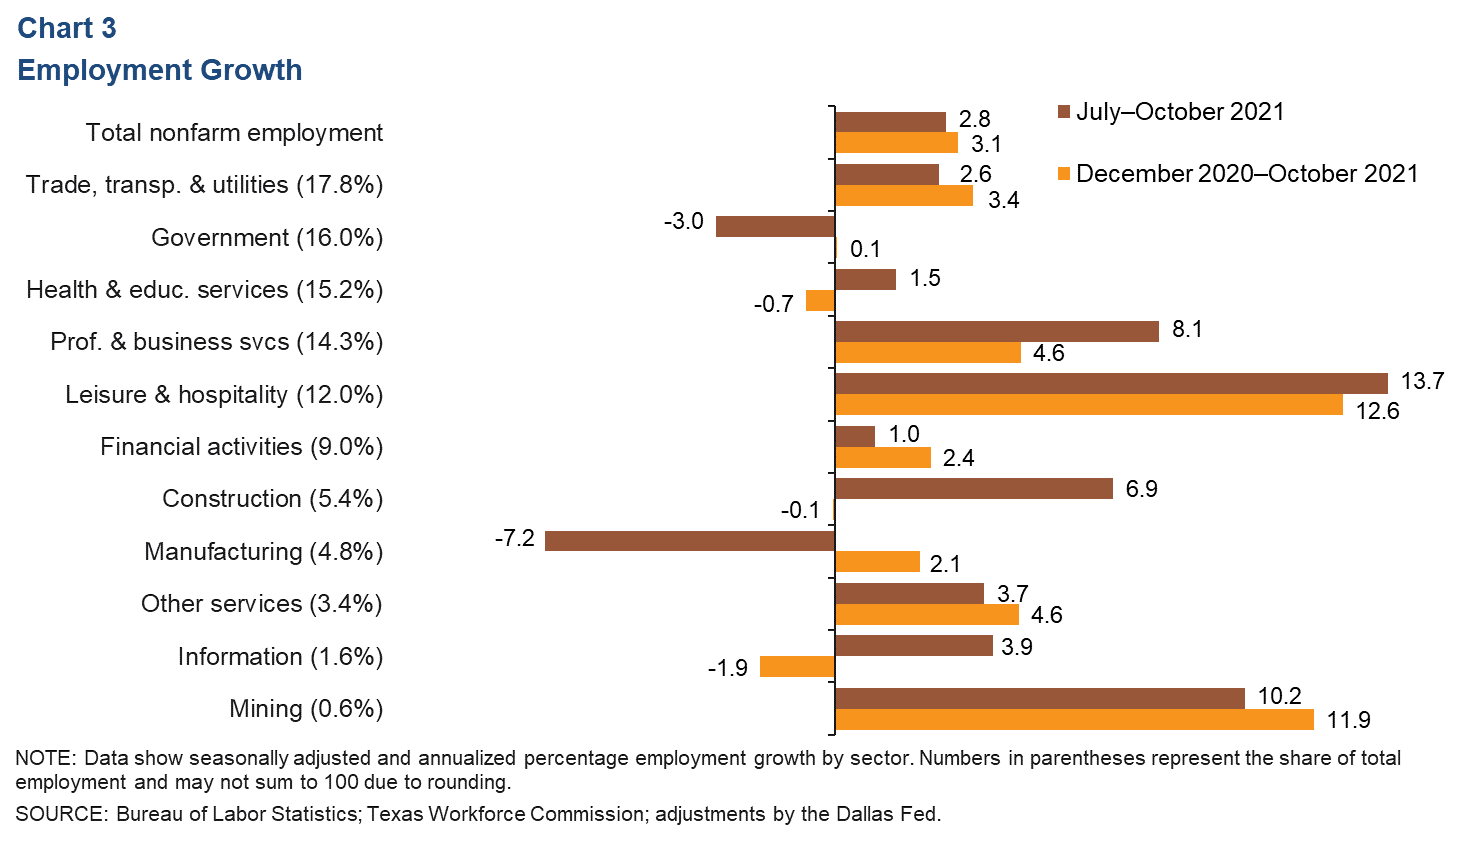
San Antonio payrolls expanded an annualized 2.8 percent (7,251 jobs) in the three months ending in October (Chart 3). The leisure and hospitality sector led growth (13.7 percent, or 4,070 jobs) and was followed by mining (10.2 percent, or 165 jobs), professional and business services (8.1 percent, or 2,940 jobs) and construction (6.9 percent, or 950 jobs). Industries that posted net declines were manufacturing (-7.2 percent, or 970 jobs) and government (-3.0 percent, or 1,295 jobs). In March and April 2020 combined, 138,332 jobs were lost as the pandemic hit. As of October 2021, 84.8 percent of those jobs had been recovered.
Consumer Spending
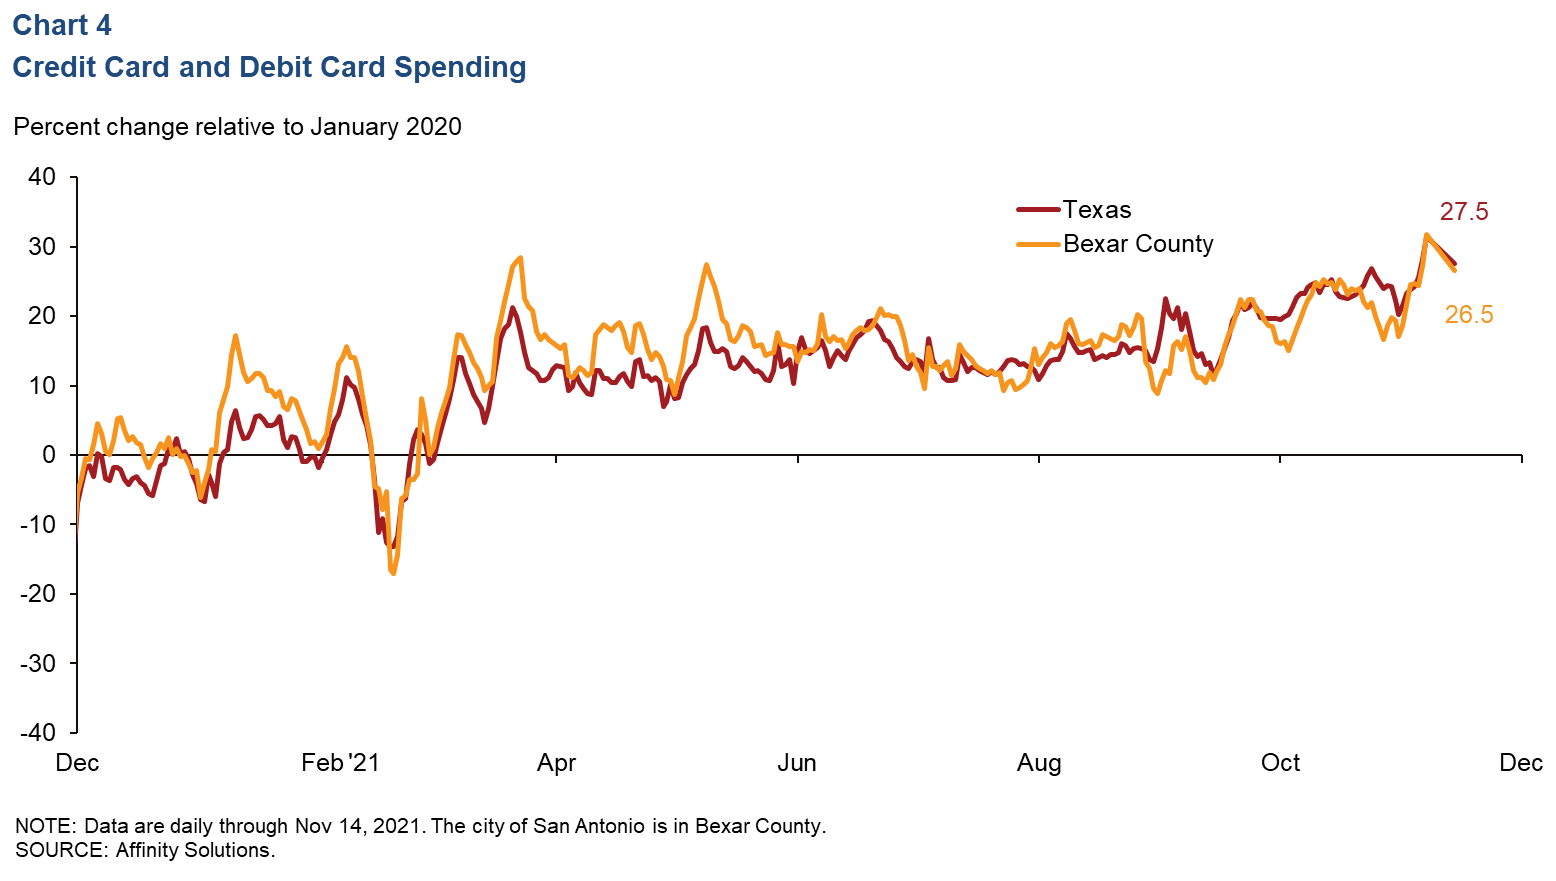
Since early February 2021, consumer spending in Bexar County has remained generally above January 2020 levels, except for a brief dip during the week of Winter Storm Uri in mid-February. Spending (as measured by debit and credit card activity) fell in early November but remains strong. As of Nov. 14, spending was 26.5 percent higher relative to January 2020 levels (Chart 4). In Texas, spending was 27.5 percent higher relative to January 2020.
Real Estate
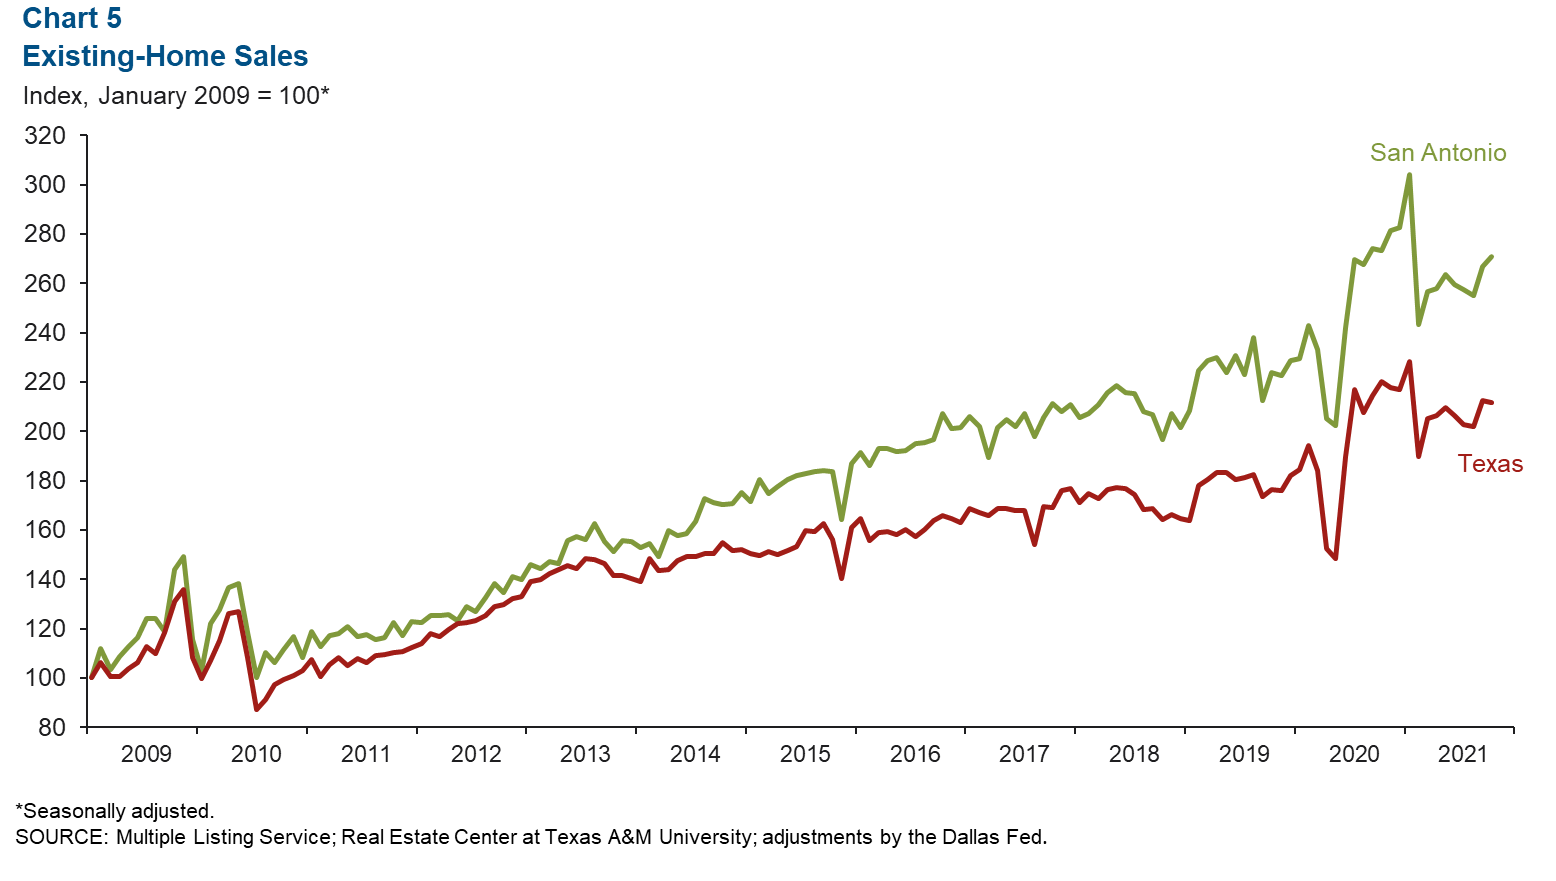
San Antonio existing-home sales increased 1.5 percent in October after posting a 4.5 percent gain in September (Chart 5). Statewide, sales contracted 0.3 percent in October. In the first 10 months of the year, the metro’s home sales were up 8.0 percent compared with the same period in 2020—slightly below the state’s 8.4 percent increase. The median price of homes sold in San Antonio in September was $304,296—an 11.9 percent gain year over year. In the state, the median home price was $312,903, an 8.4 percent jump.
COVID-19 Statistics
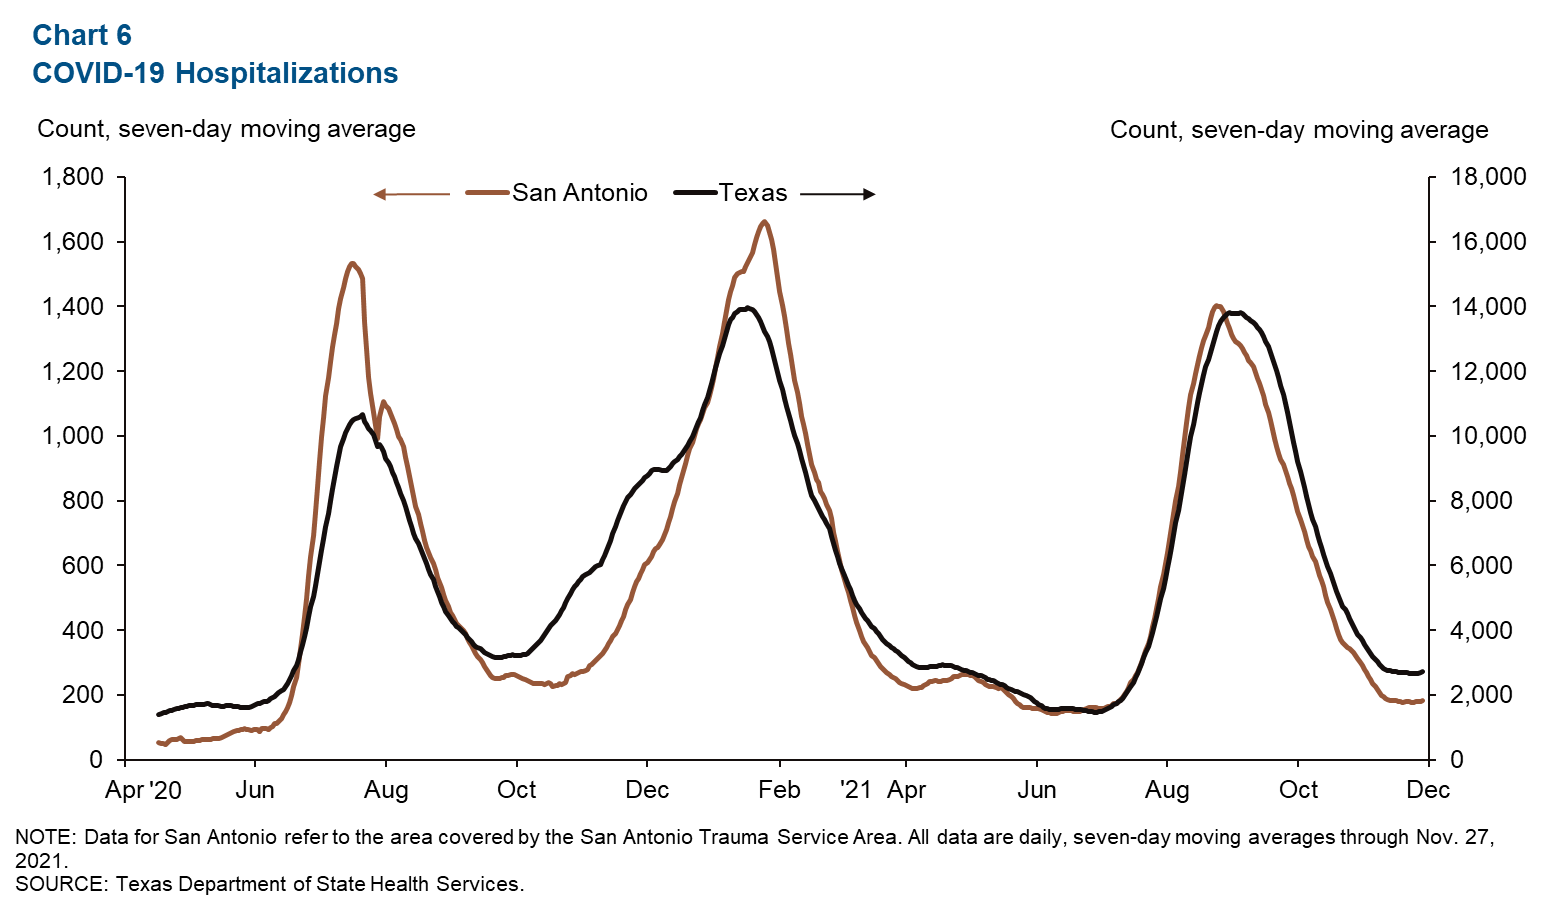
After declining the previous two months, the number of people currently hospitalized with COVID-19 in San Antonio and the state began to level out in November (Chart 6). As of Nov. 27, 182 people in San Antonio and 2,796 in the state were hospitalized with COVID-19.
NOTE: Data may not match previously published numbers due to revisions.
About San Antonio Economic Indicators
Questions can be addressed to Judy Teng at judy.teng@dal.frb.org. San Antonio Economic Indicators is published every month during the week after state and metro employment data are released.