San Antonio Economic Indicators

February 8, 2022
Broad measures of the San Antonio economy were mostly positive in December, though less so than in previous months. The San Antonio Business-Cycle Index rose in December, albeit at a slower pace, and the unemployment rate continued to fall. Meanwhile, employment dipped but the three-month change remained positive. While COVID-19 cases have recently declined, a spike in cases early in the year coincided with decreases in dining out and mobility in the metro area.
Business-cycle index
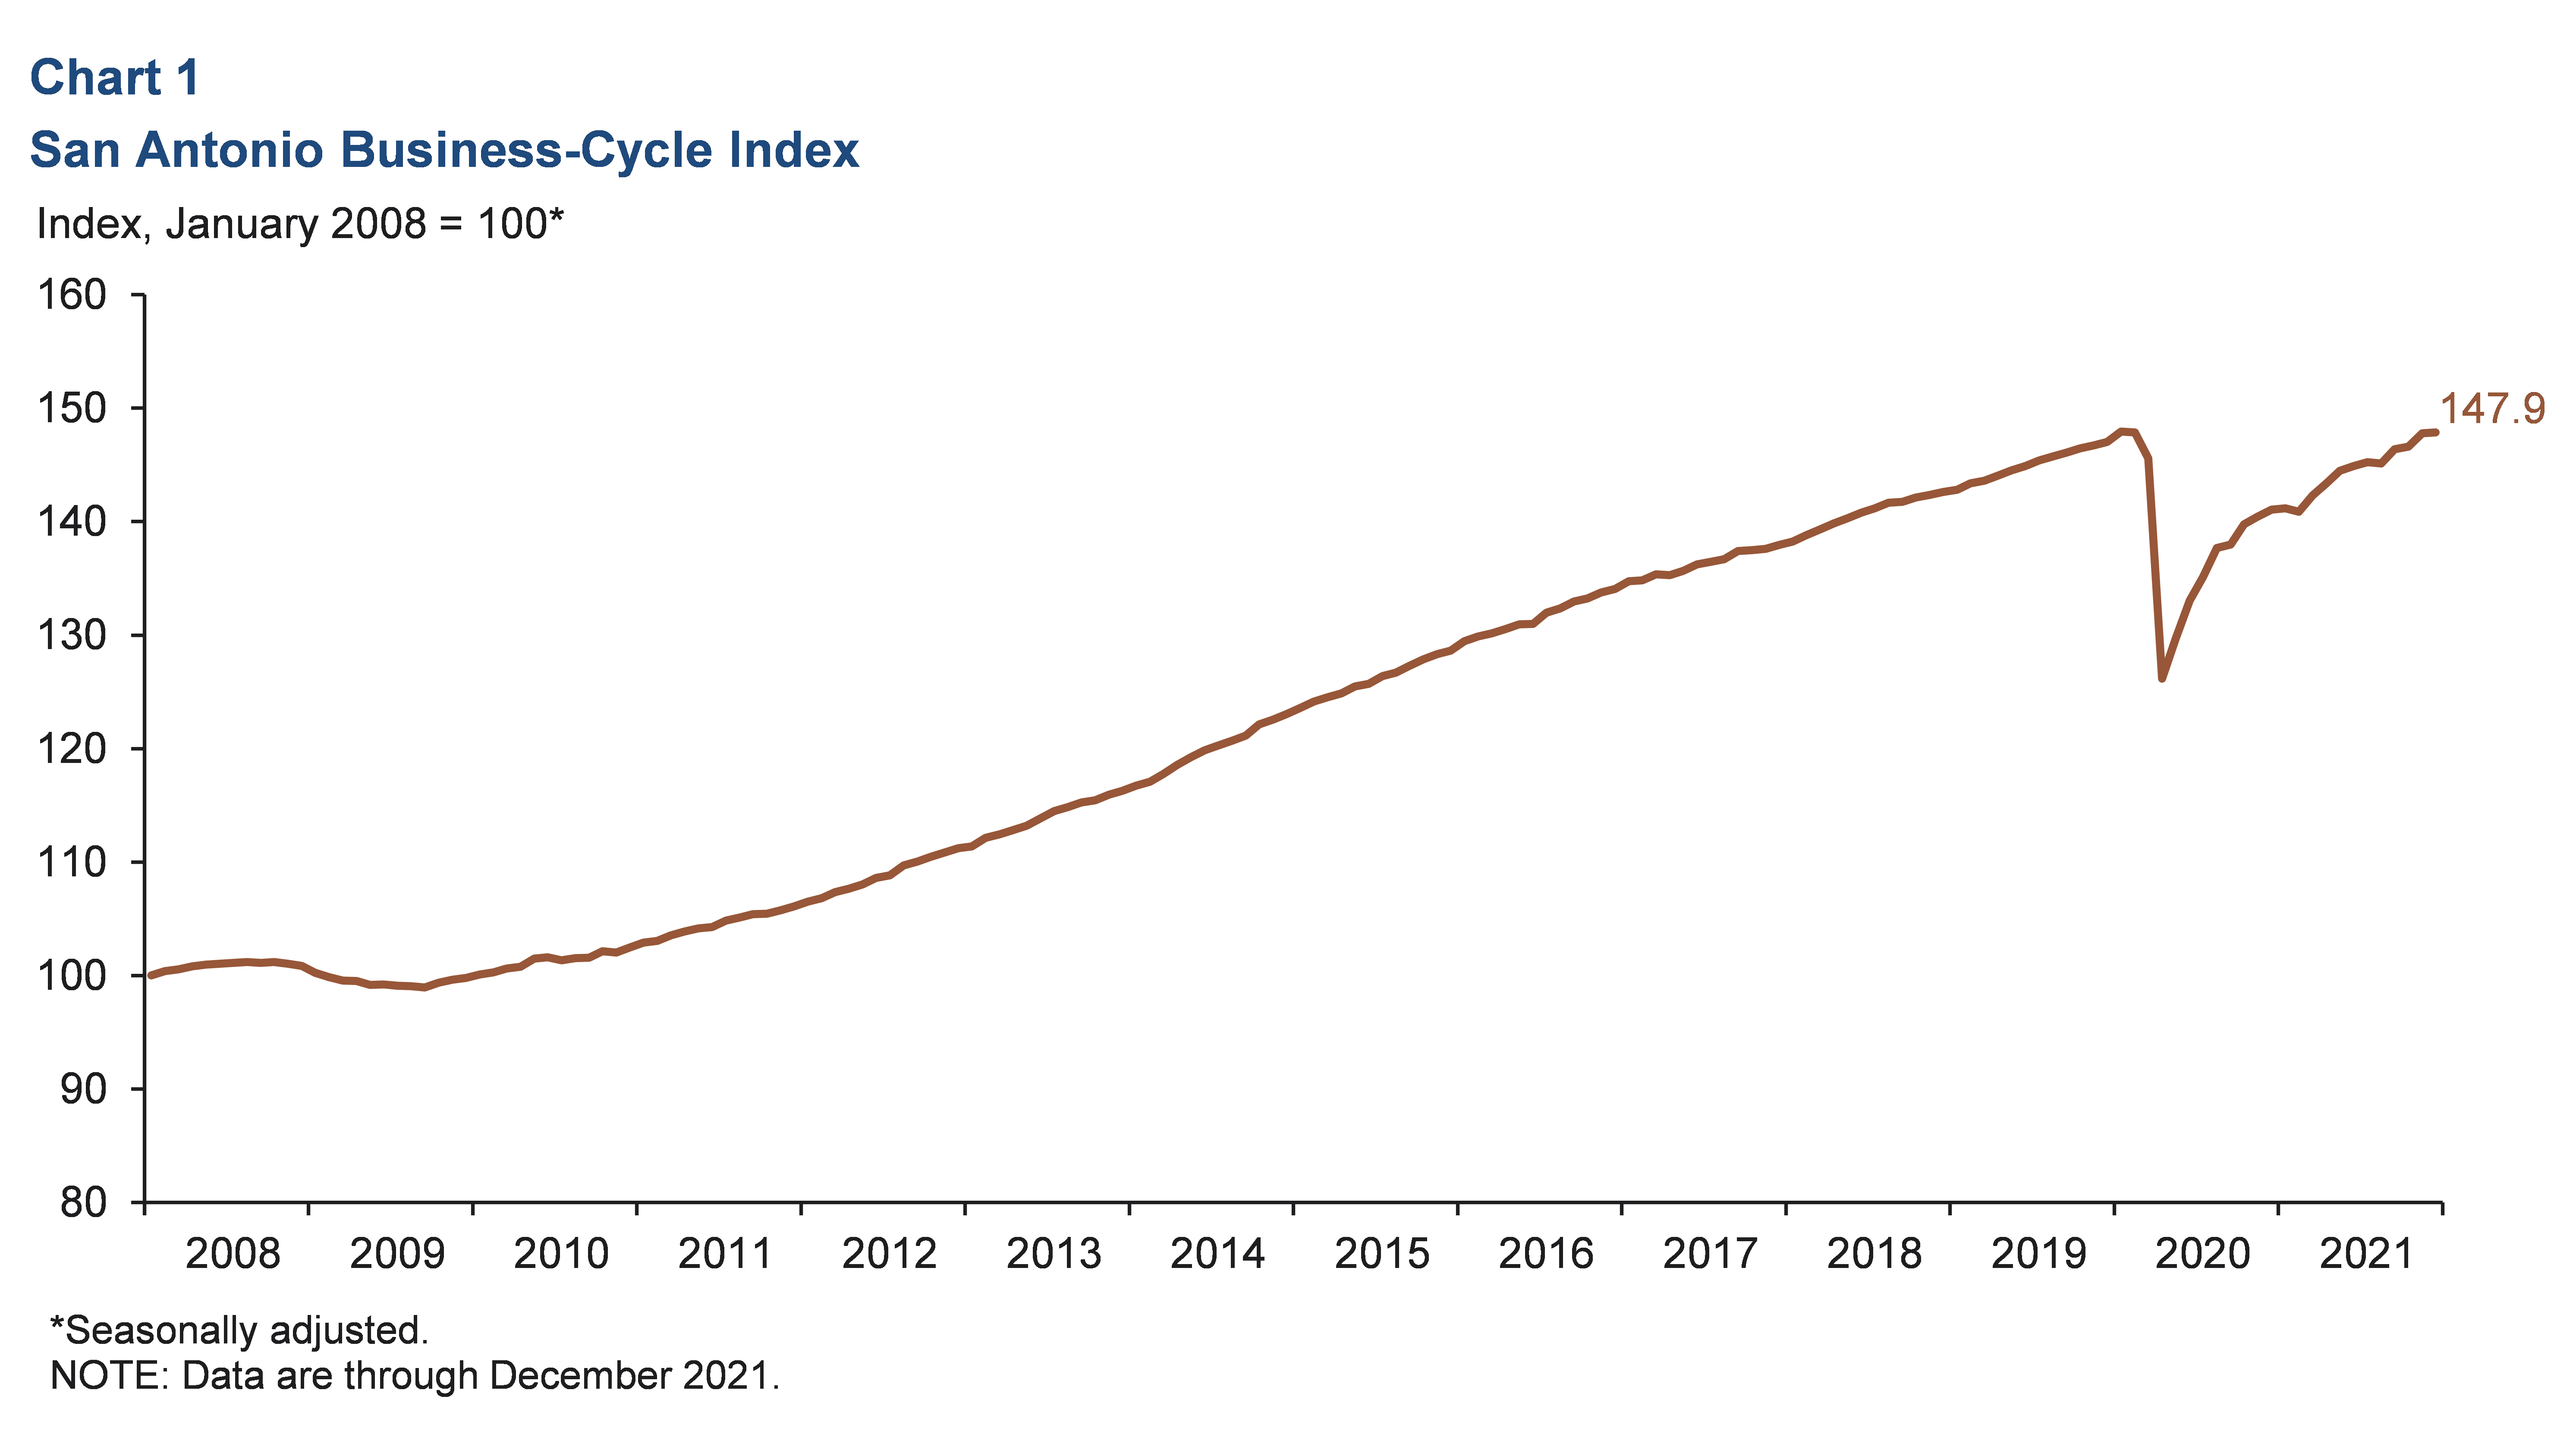
The San Antonio Business-Cycle Index—a broad measure of economic activity in the metro— grew 0.7 percent in December after rising 10.2 percent in November (Chart 1). The deceleration in index growth is largely attributable to December employment declines.
Labor market
Unemployment rate declines
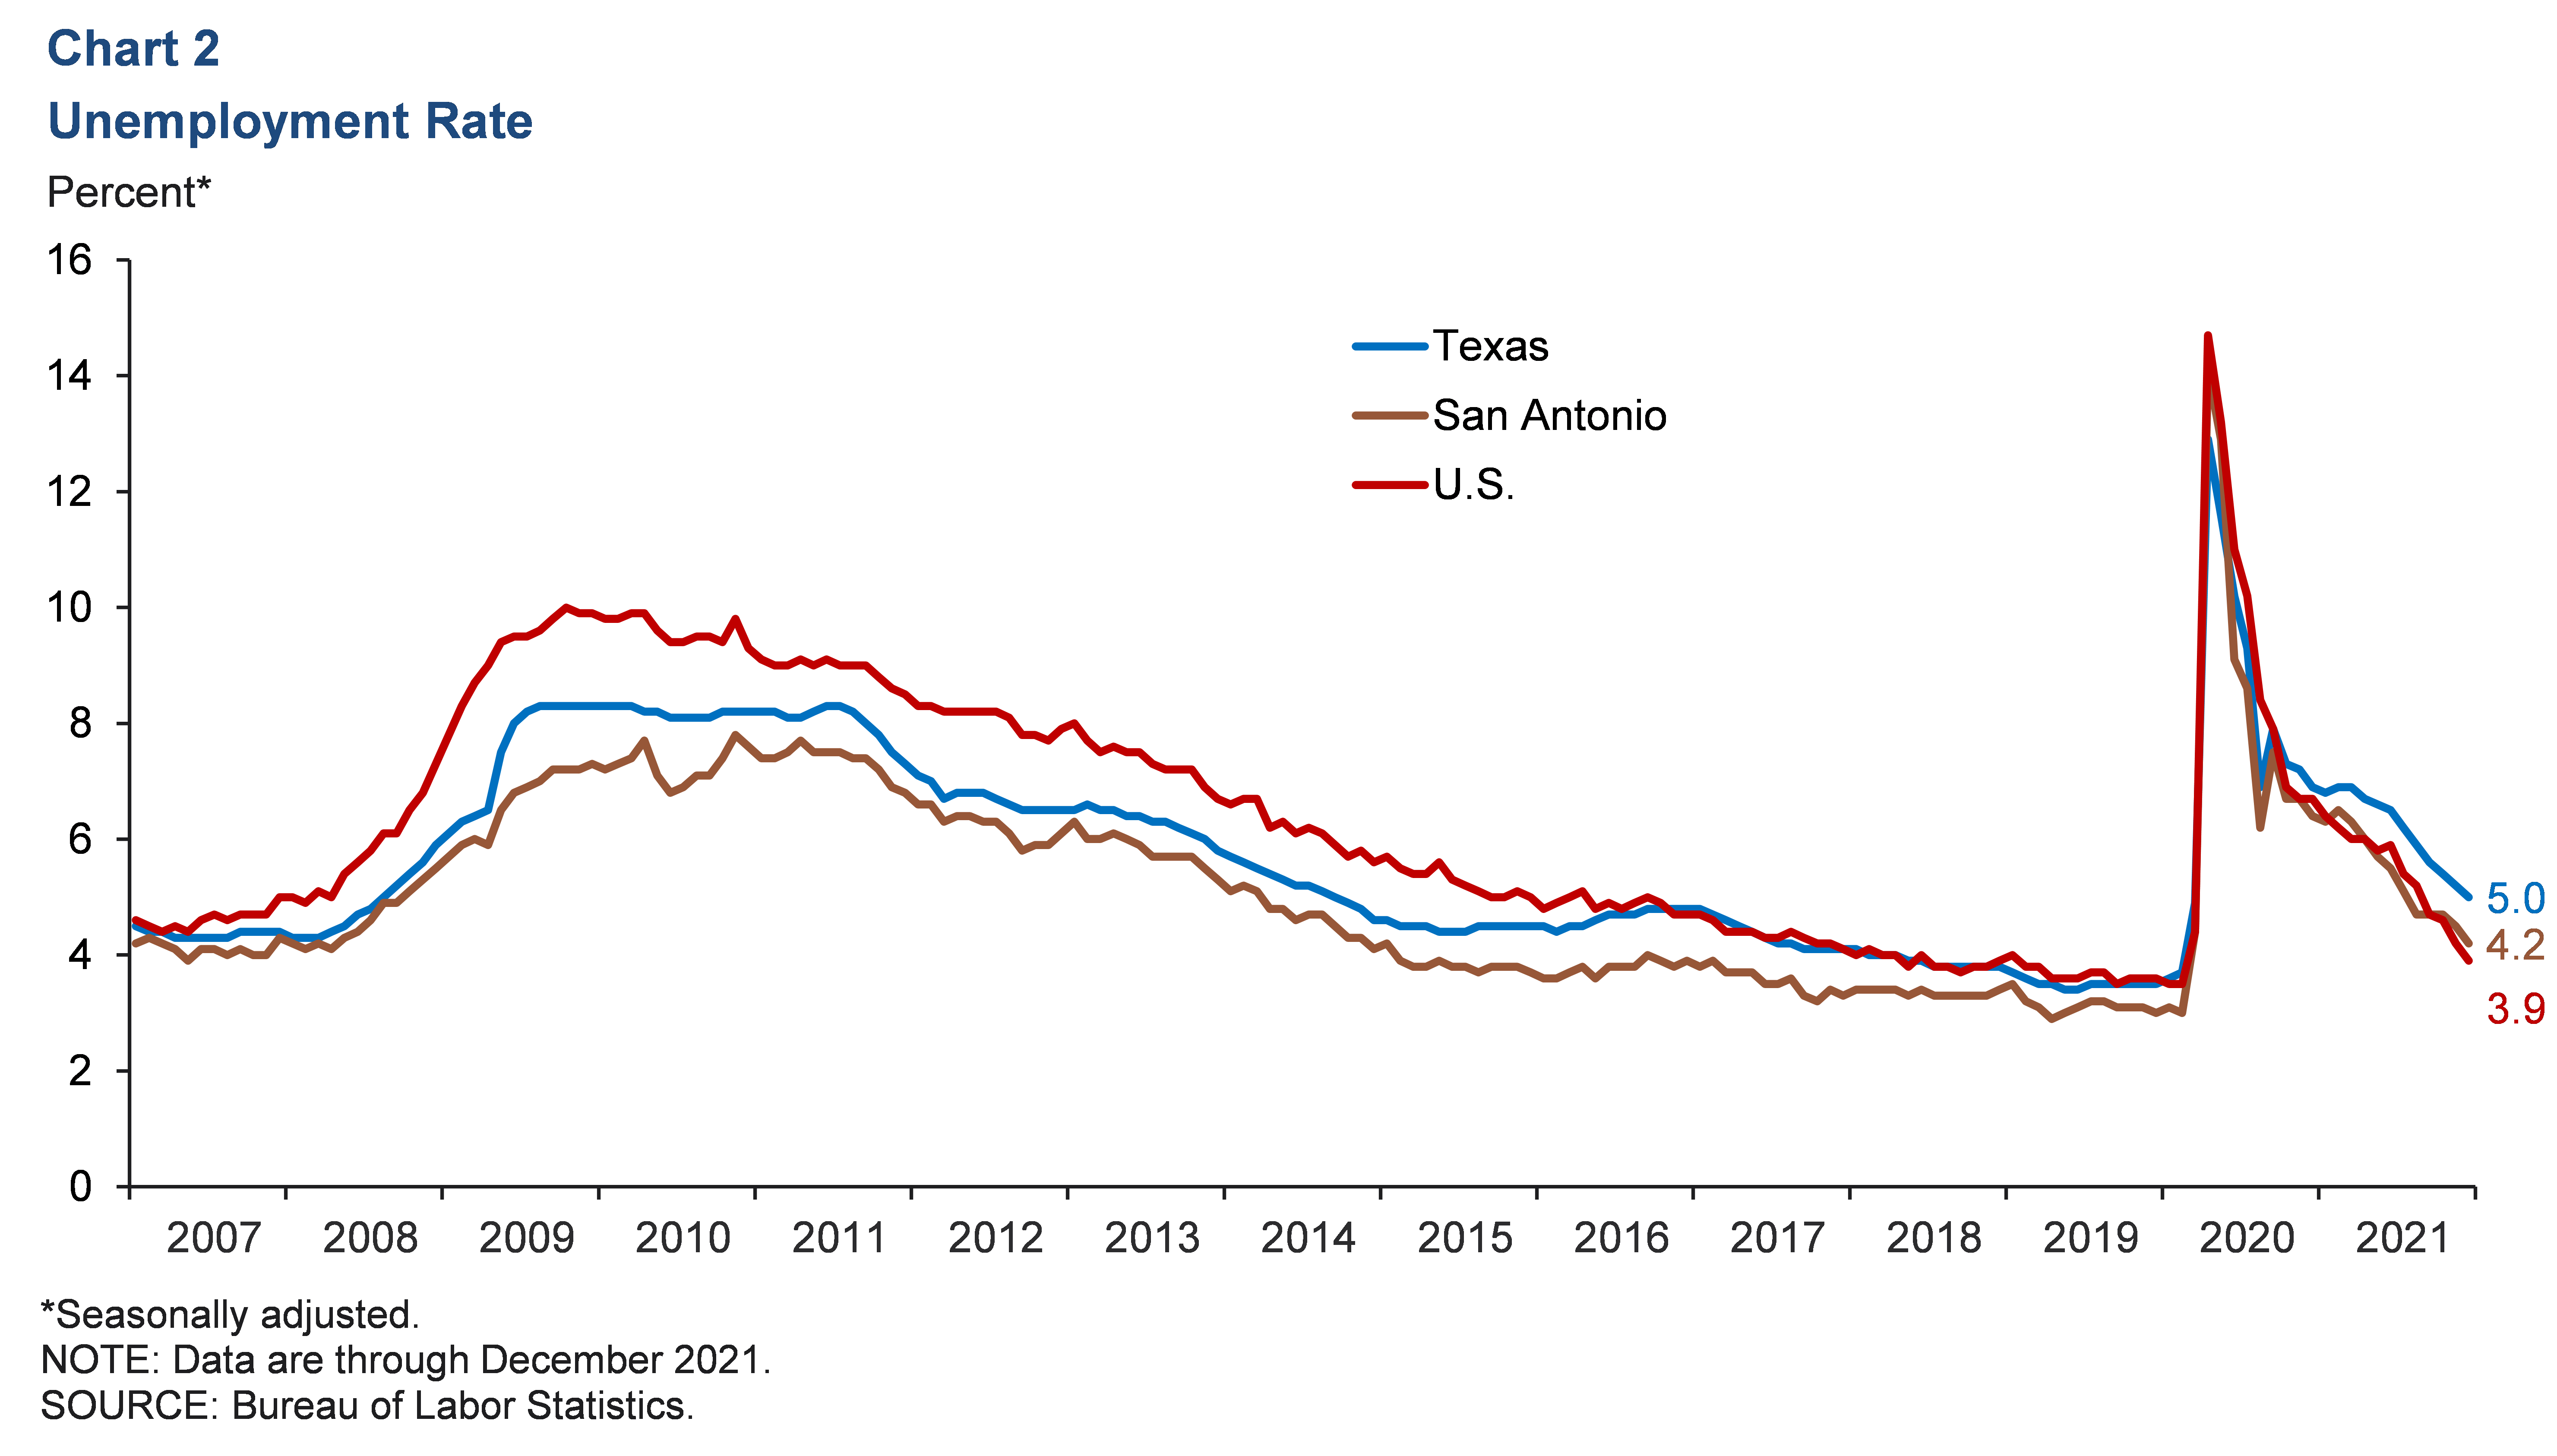
The metro’s unemployment rate fell to 4.2 percent in December, the lowest since March 2020 (Chart 2). The state’s jobless rate decreased slightly to 5.0 percent, and the nation’s rate dipped to 3.9 percent, also the lowest since March 2020. In the three months ending in December, San Antonio’s labor force expanded an annualized 2.7 percent, slightly above the nation’s 2.1 percent gain but below Texas’ 3.8 percent increase.
Recent job gains mostly positive
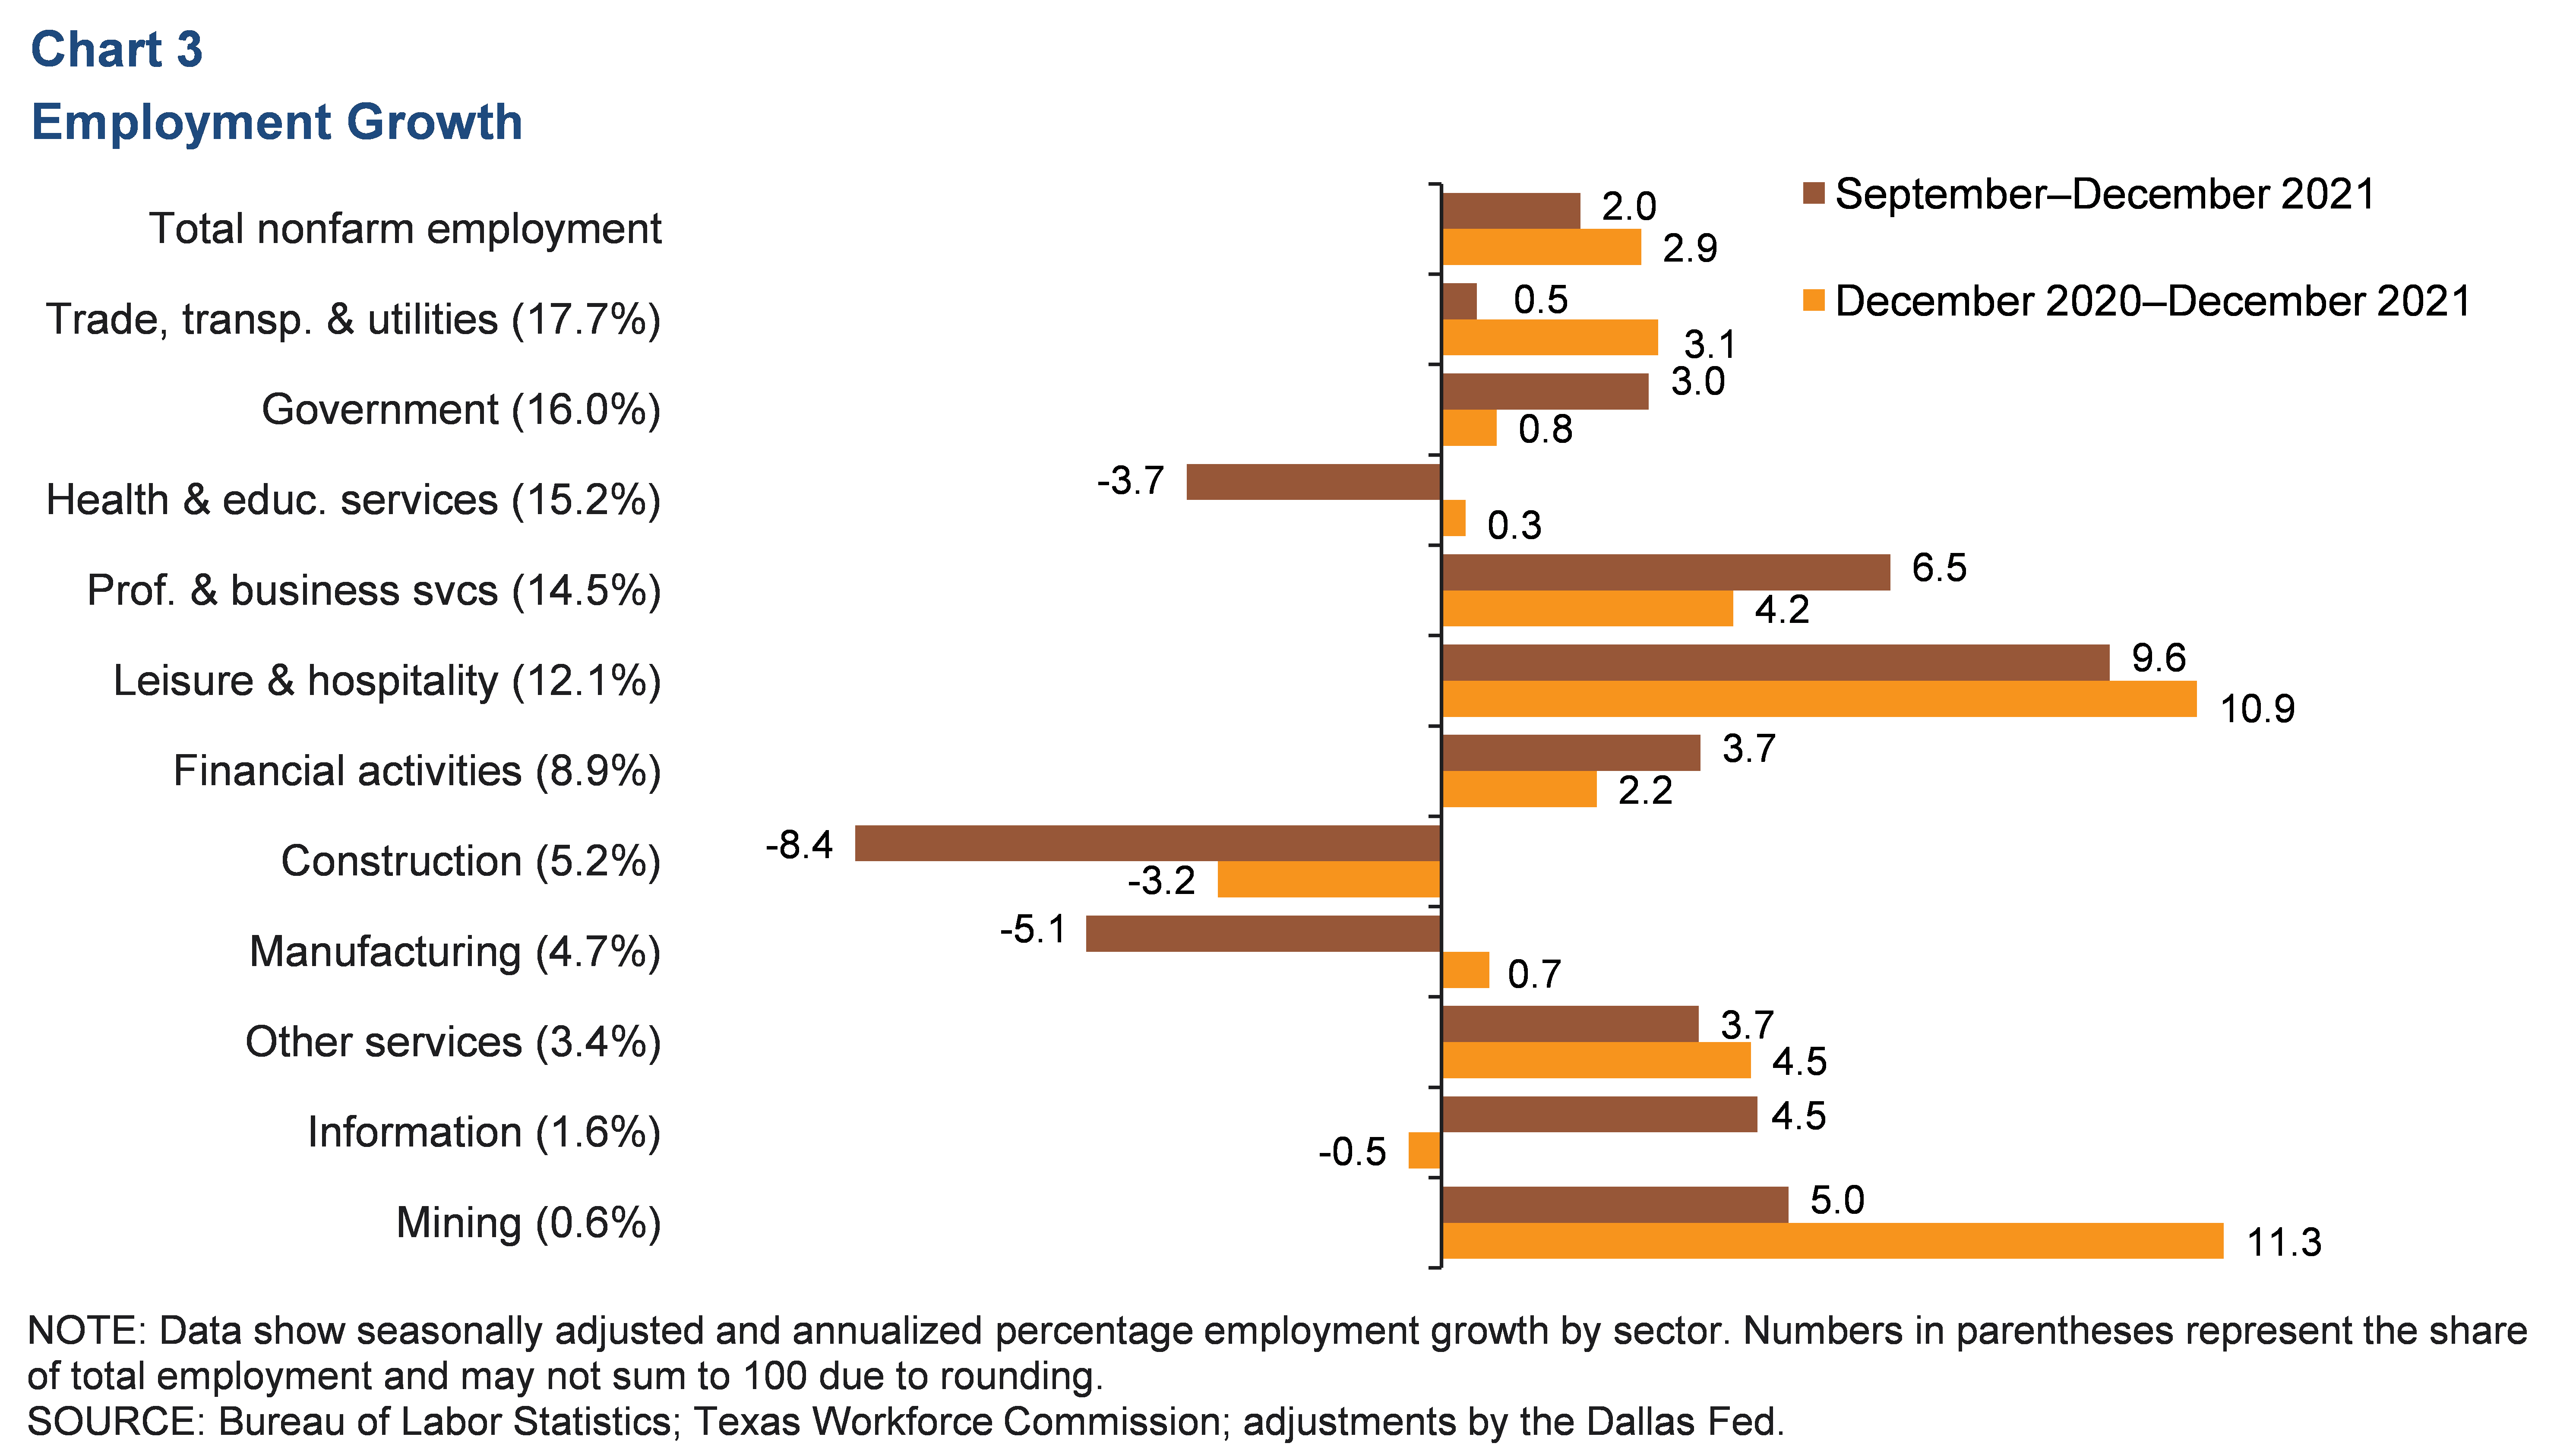
San Antonio payrolls expanded an annualized 2.0 percent (5,289 jobs) in the three months ending in December (Chart 3). The leisure and hospitality sector led growth (9.6 percent, or 2,926 jobs) and was followed by professional and business services (6.5 percent, or 2,389 jobs), mining (5.0 percent, or 84 jobs) and government (3.0 percent, or 1,263 jobs). Industries that posted the largest contractions were construction (-8.4 percent, or 1,238 jobs), manufacturing (-5.1 percent, or 672 jobs), and health and educational services (-3.7 percent, or 1,536 jobs). In March and April 2020 combined, 138,332 jobs were lost in the metro as the pandemic hit. As of December 2021, 98.4 percent of those jobs had been recovered.
COVID-19
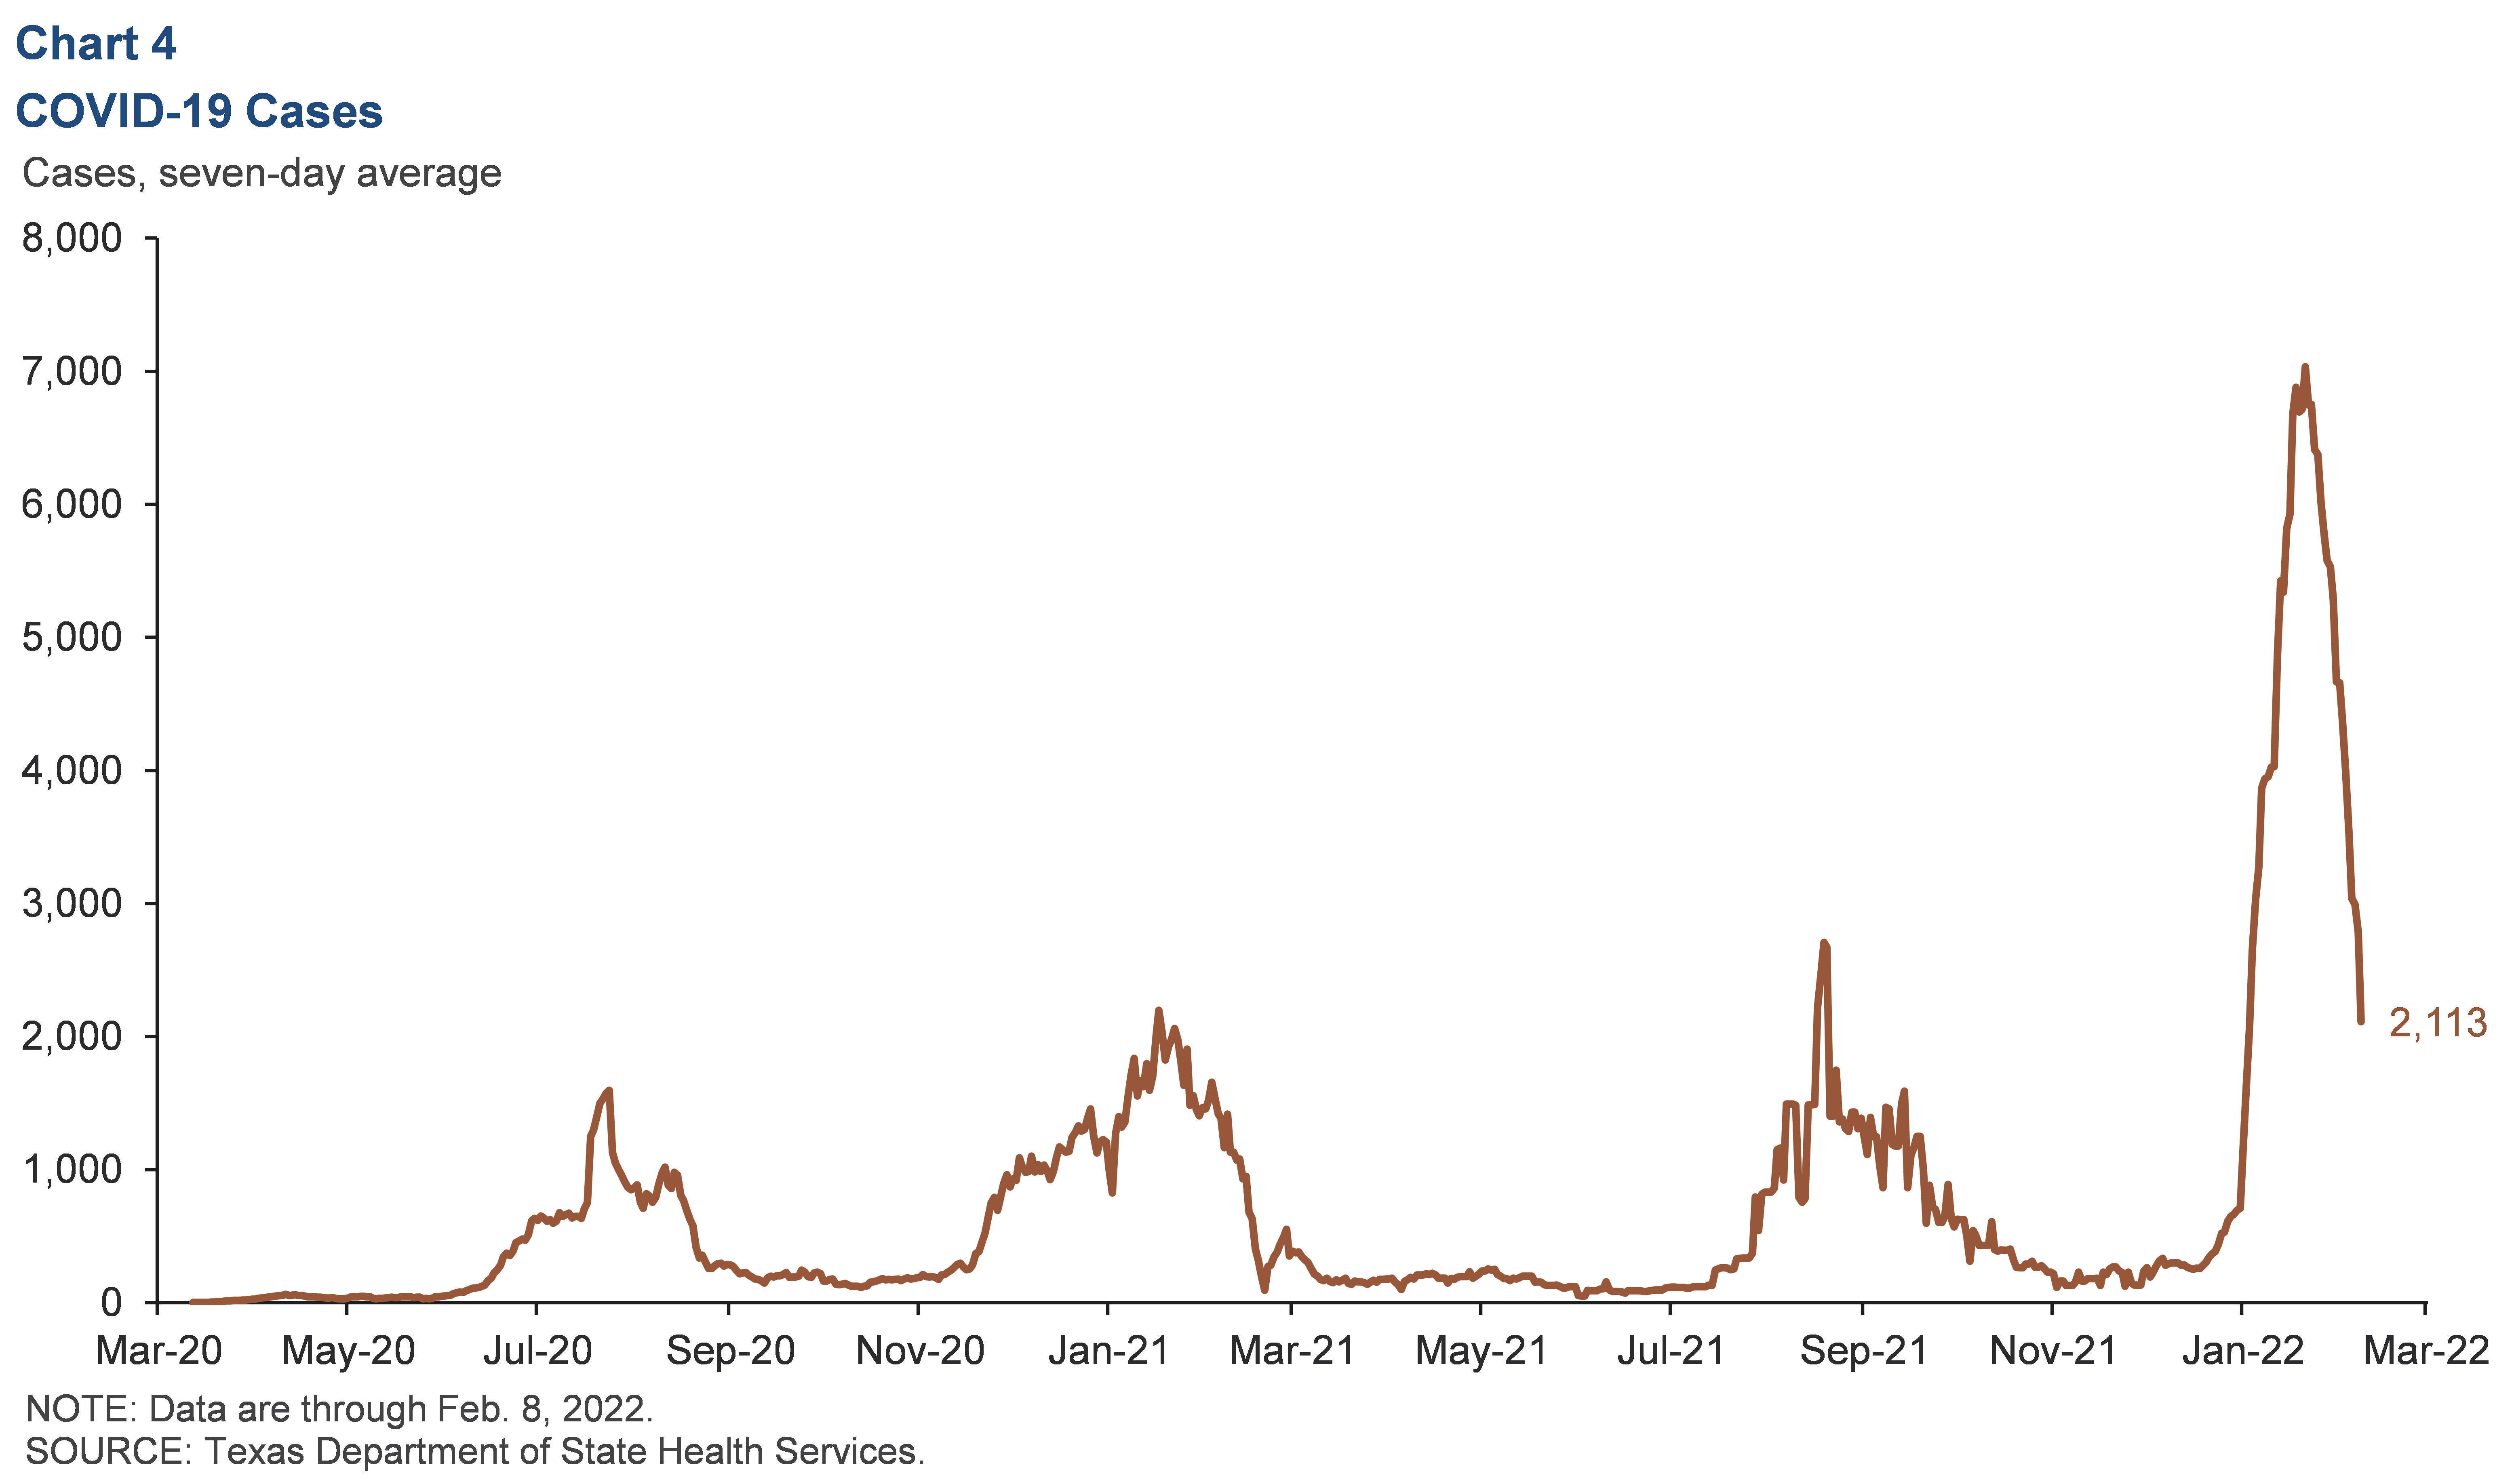
Daily new COVID-19 cases in San Antonio climbed to their highest levels since the start of the pandemic before easing (Chart 4). Compared with the previous seven-day average peak of 2,707 cases per day in mid-August 2021, San Antonio saw 7,035 cases per day at the peak of the most recent (omicron) wave. While new cases have fallen sharply recently, the most recent data indicate levels remain elevated.
Dining activity
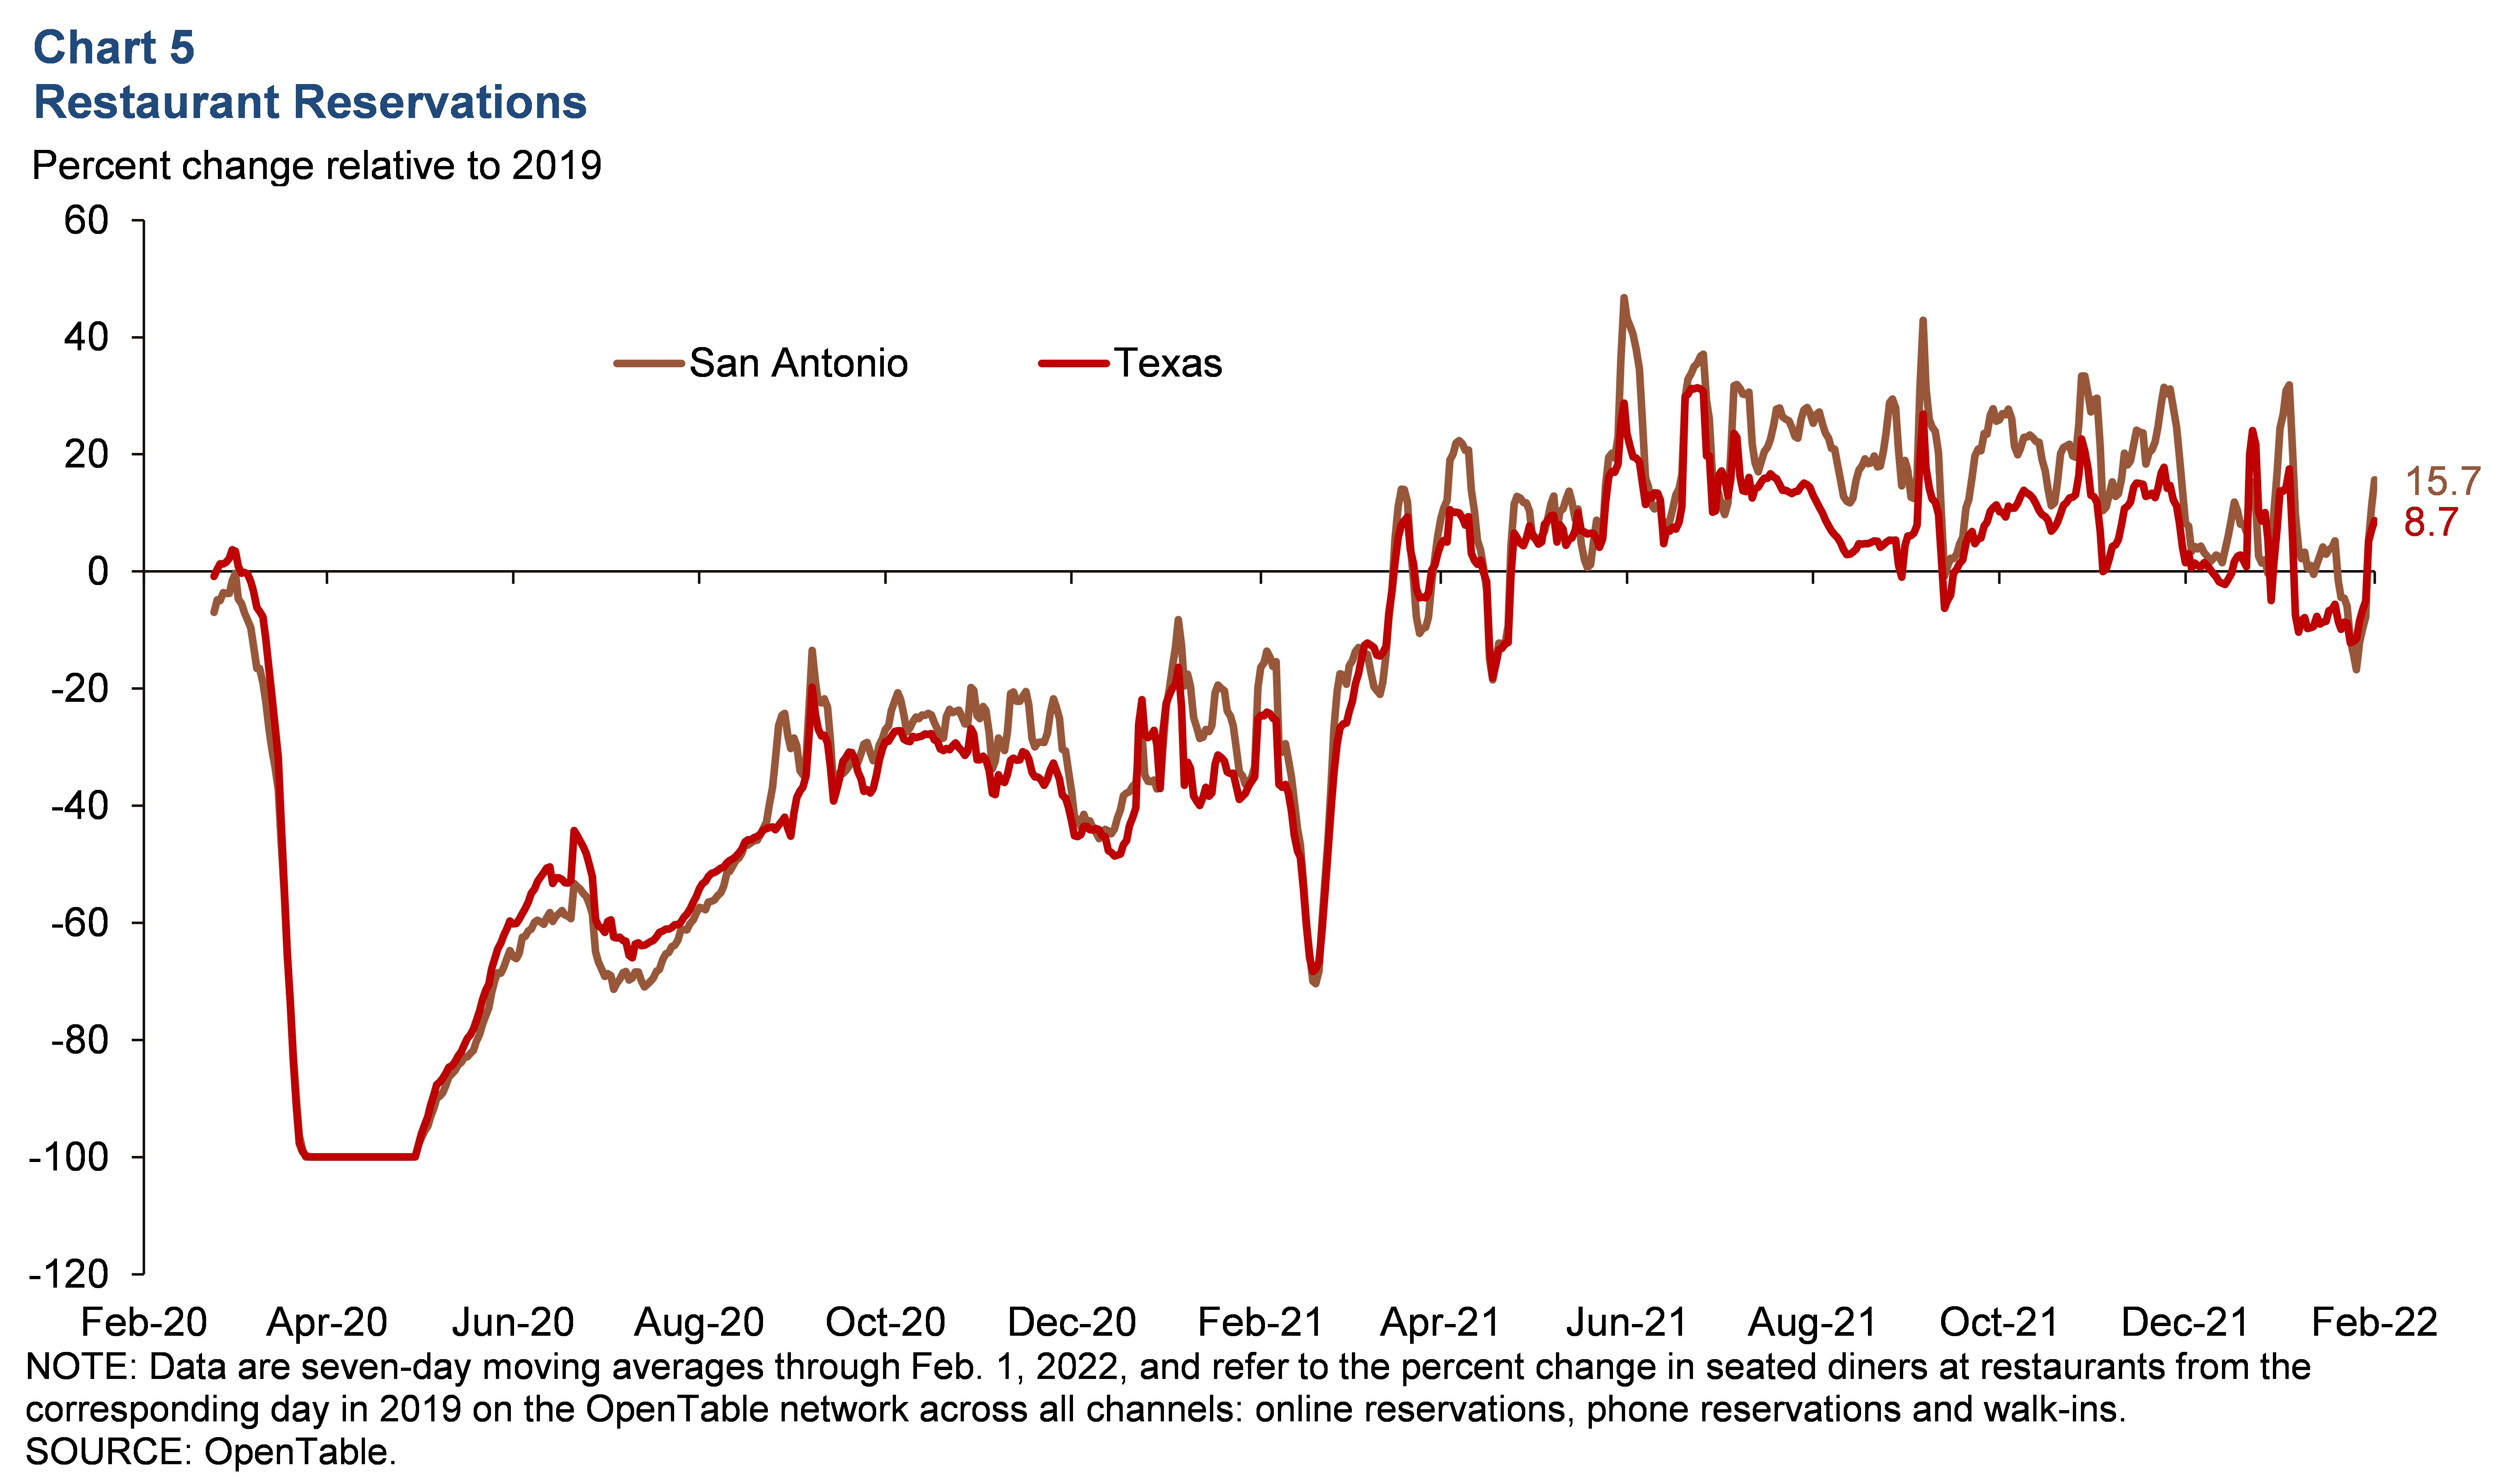
San Antonio dining activity fell briefly in late January 2022 but has since shown signs of recovering (Chart 5). While initially falling as far as 16.8 percent below corresponding levels in 2019 on Jan. 26, activity improved the following week. As of Feb. 1, dining out was 15.7 percent higher than it was three years ago and well above Texas’ increase of 8.7 percent.
Mobility
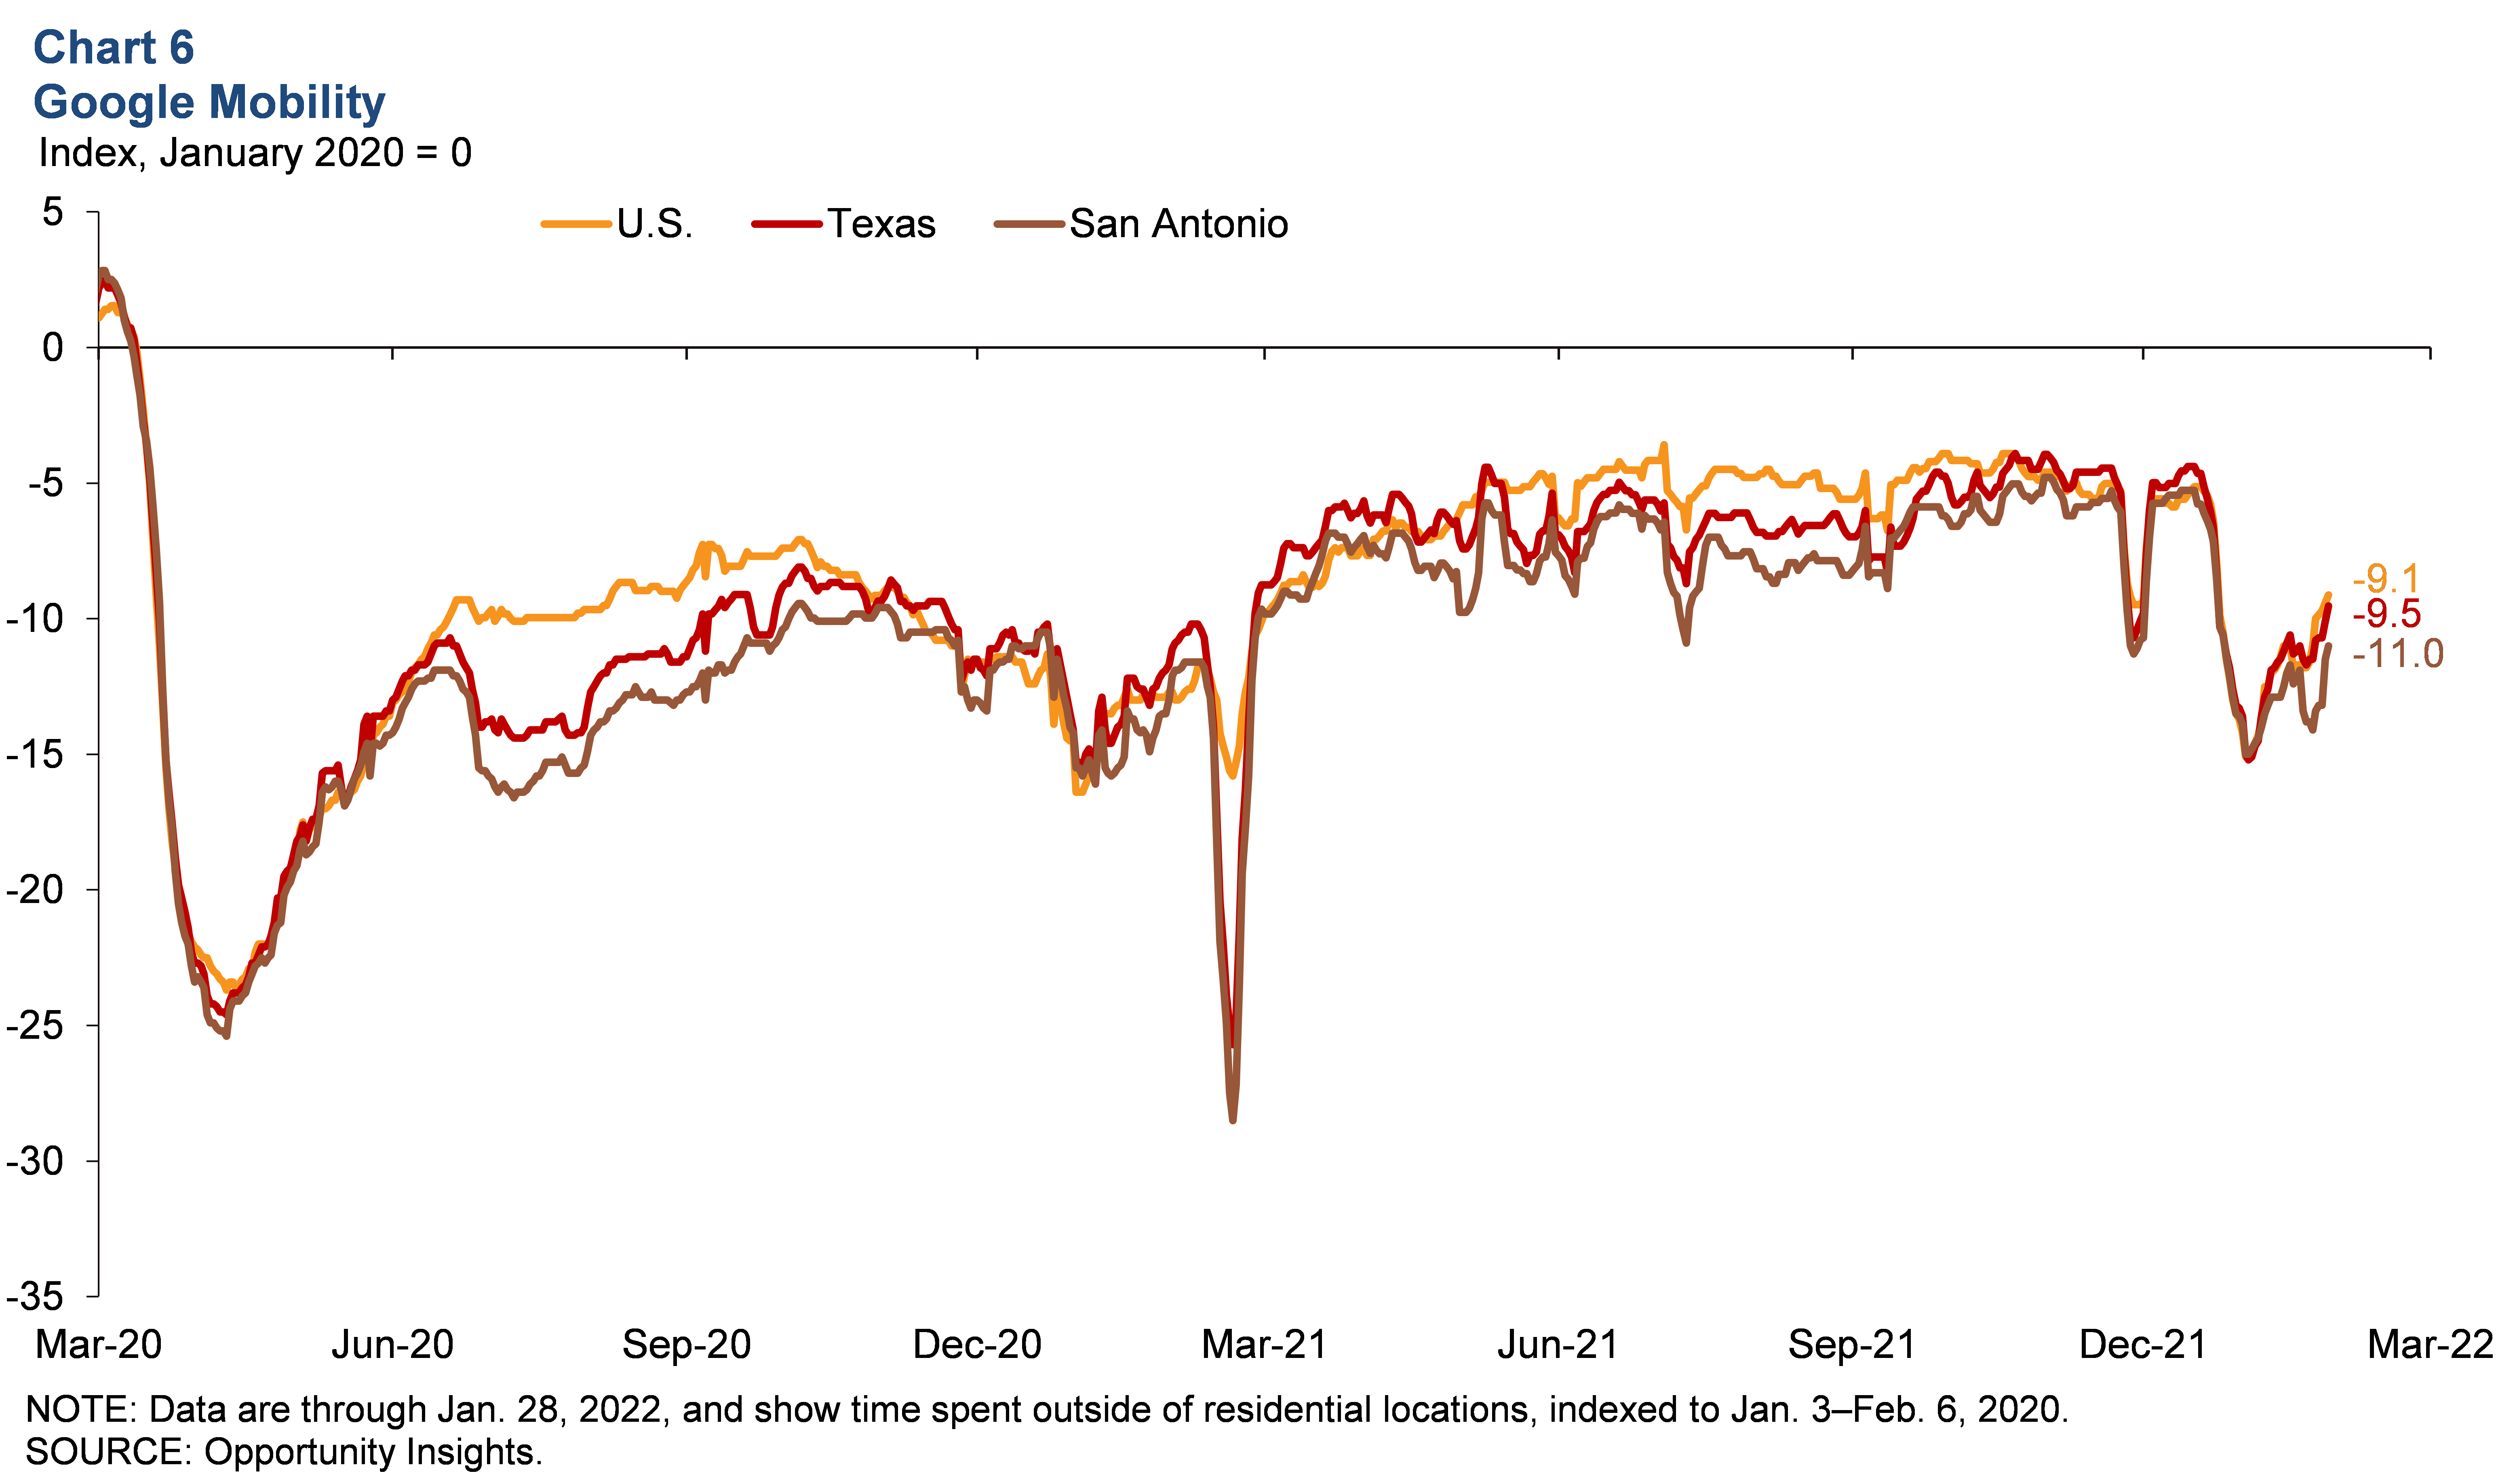
San Antonio mobility fell toward the end of last year but has since shown signs of increasing (Chart 6). After falling as much as 15.0 percent below January 2020 levels in early January 2022, mobility has slightly increased in recent weeks and is now 11.0 percent below January 2020 levels. This is lower than the state’s and nation’s levels of -9.5 and -9.1 percent, respectively.
NOTE: Data may not match previously published numbers due to revisions.
About San Antonio Economic Indicators
Questions can be addressed to James Lee at James.Lee@dal.frb.org. San Antonio Economic Indicators is published every month during the week after state and metro employment data are released.