San Antonio Economic Indicators

March 30, 2023
| San Antonio economy dashboard (February 2023) | |||
| Job growth (annualized) Dec. '22–Feb. '23 |
Unemployment rate |
Avg. hourly earnings |
Avg. hourly earnings growth y/y |
| 3.5% | 3.9% | $27.62 | 1.4% |
In February, San Antonio experienced solid employment growth accompanied by falling wages. The unemployment rate rose as the labor force increased. Apartment rents ticked up in February, and office vacancy rates declined at the end of 2022.
Labor market
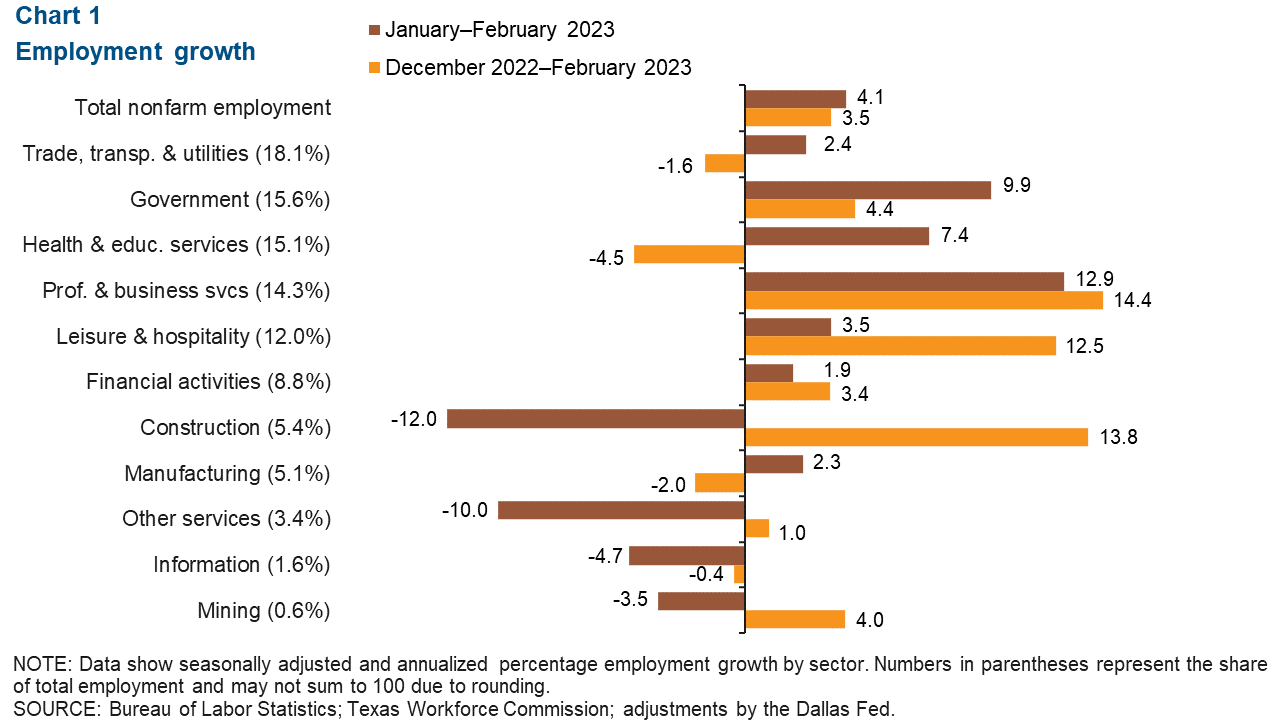
Sector job growth mixed in February
San Antonio payrolls increased an annualized 4.1 percent from January to February 2023 (3,810 jobs) (Chart 1). Professional and business services grew the most (12.9 percent, or 1,638 jobs), followed by government (9.9 percent, or 1,395 jobs). Sectors that experienced the largest declines were construction (12.0 percent, or 670 jobs) and other services (10.0 percent, or 353 jobs).
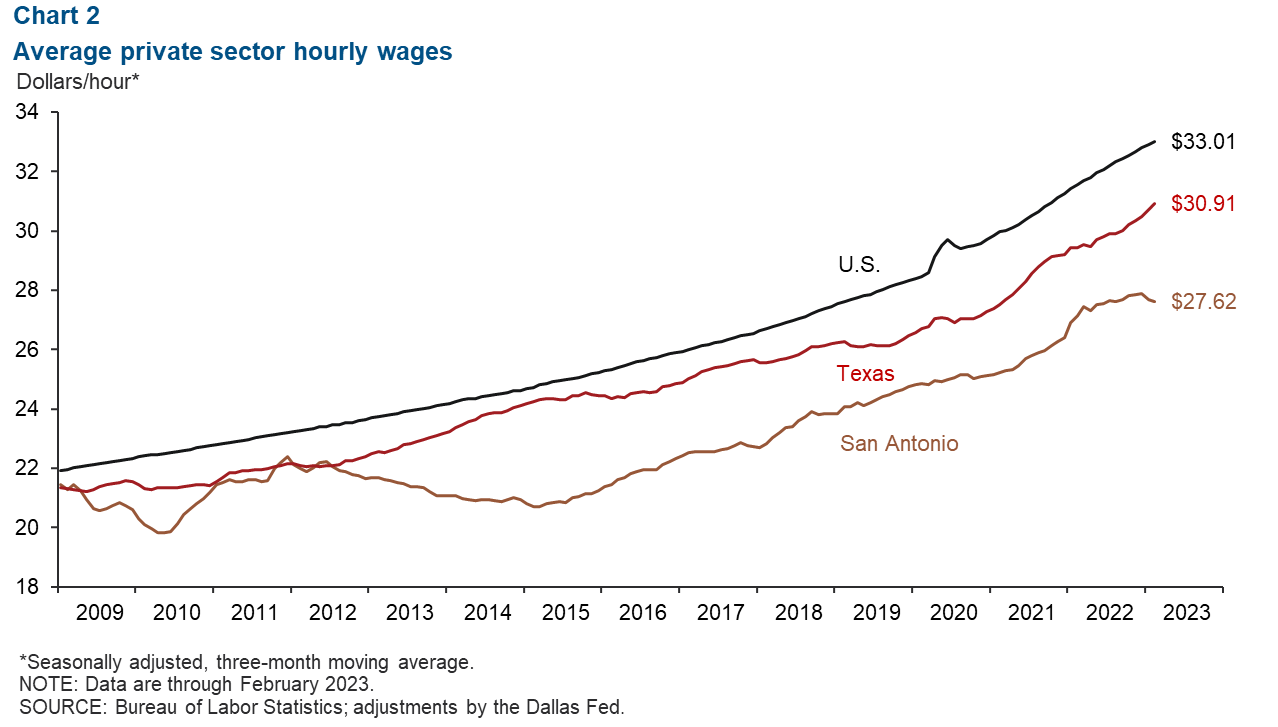
San Antonio wages fall
San Antonio wages decreased an annualized 3.4 percent in February (Chart 2). The three-month moving average of wages was $27.62, below both the state average of $30.91 and the national average of $33.01. In the past year, San Antonio’s wages increased 1.4 percent—lower than gains of 5.0 percent in Texas and 4.6 percent in the U.S.
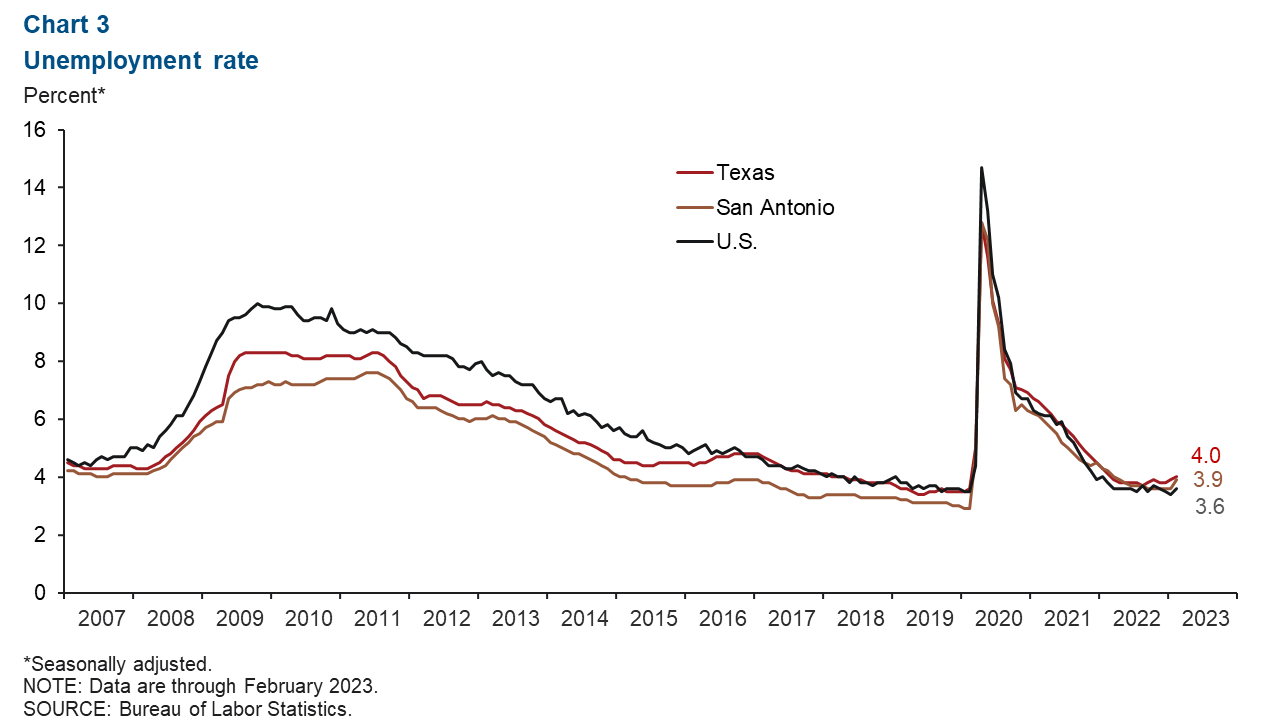
Unemployment rate rises
The San Antonio unemployment rate increased to 3.9 percent in February (Chart 3). The metro’s unemployment rate was higher than the U.S. rate of 3.6 percent but lower than the state’s 4.0 percent reading. This month, San Antonio’s labor force increased an annualized 8.6 percent.
Real estate
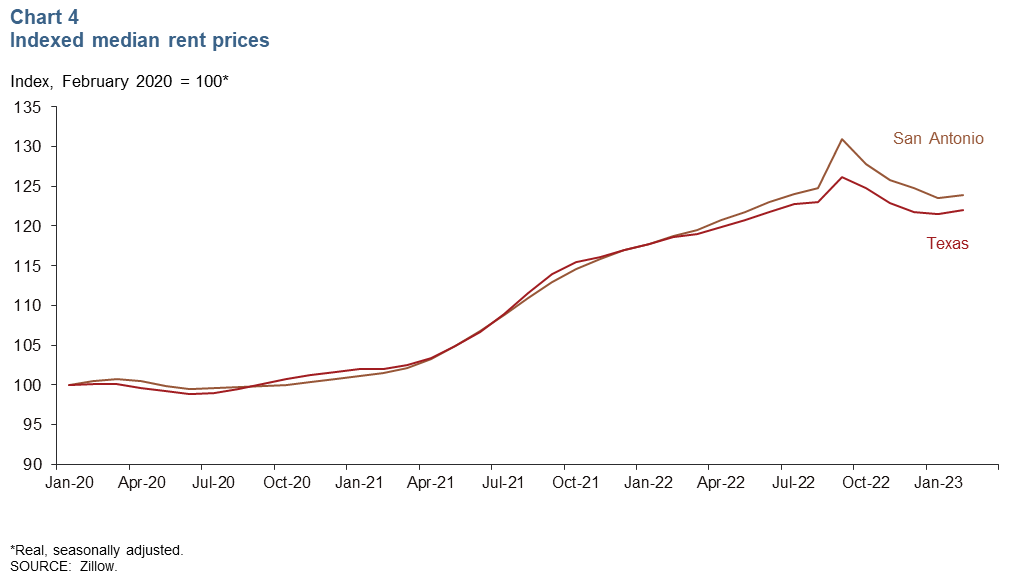
Rents rebound in February
In February, rental prices increased in both San Antonio and Texas after declining in the fourth quarter of last year (Chart 4). Average rents rose an annualized 3.6 percent from the prior month in San Antonio and 4.7 percent in the state. Year-over-year rents in San Antonio increased 4.2 percent, down notably from the double-digit growth in 2022.
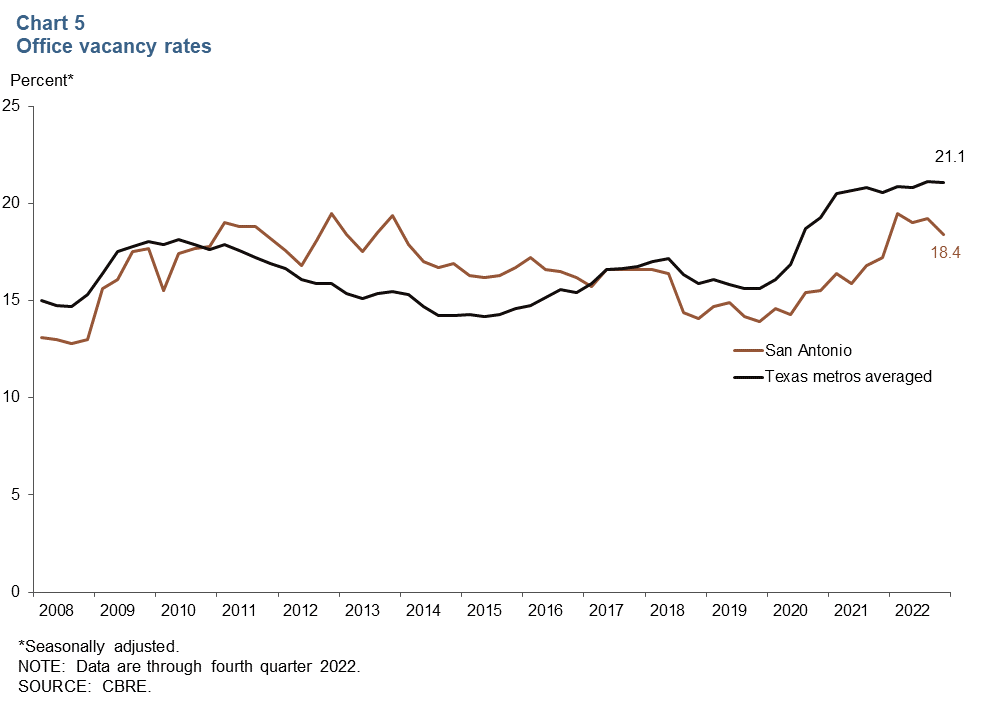
Office vacancies decline at end of 2022
In fourth quarter 2022, San Antonio’s office vacancy rate declined to 18.4 percent, remaining greater than prepandemic levels but lower than highs of 19.2 percent in first quarter 2022 (Chart 5). The fourth-quarter rate was lower than the metro average for Dallas, Fort Worth, Austin, Houston and San Antonio of 21.1 percent.
NOTE: Data may not match previously published numbers due to revisions.
About San Antonio Economic Indicators
Questions or suggestions can be addressed to Vee Kalkunte at Prithvi.Kalkunte@dal.frb.org. San Antonio Economic Indicators is published every month during the week after state and metro employment data are released.