San Antonio Economic Indicators

| San Antonio economy dashboard (April 2026) | |||
| Job growth (annualized) Jan.–Apr. '26 |
Unemployment rate |
Avg. hourly earnings |
Avg. hourly earnings growth y/y |
| 1.1% | 4.3% | $32.12 | 1.6% |
San Antonio payrolls grew while the unemployment rate rose in April. Wage growth slowed. Home inventories and existing-home sales increased while the median sales price declined. Apartment rents continued a multiyear decline.
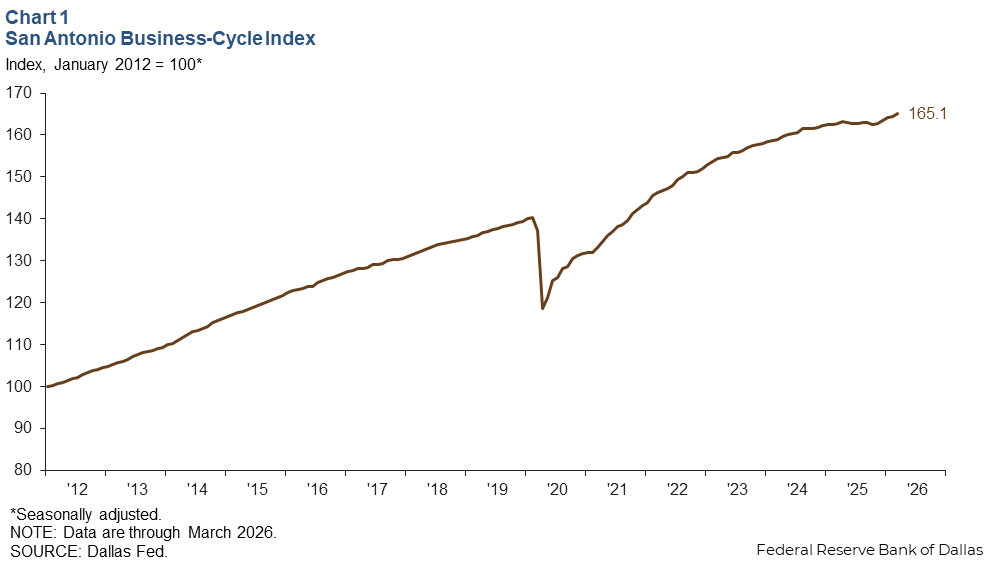
Business-cycle index
The San Antonio Business-Cycle Index, a gauge of economic conditions in the metro area, rose an annualized 4.4 percent in March from February (Chart 1).
Labor market
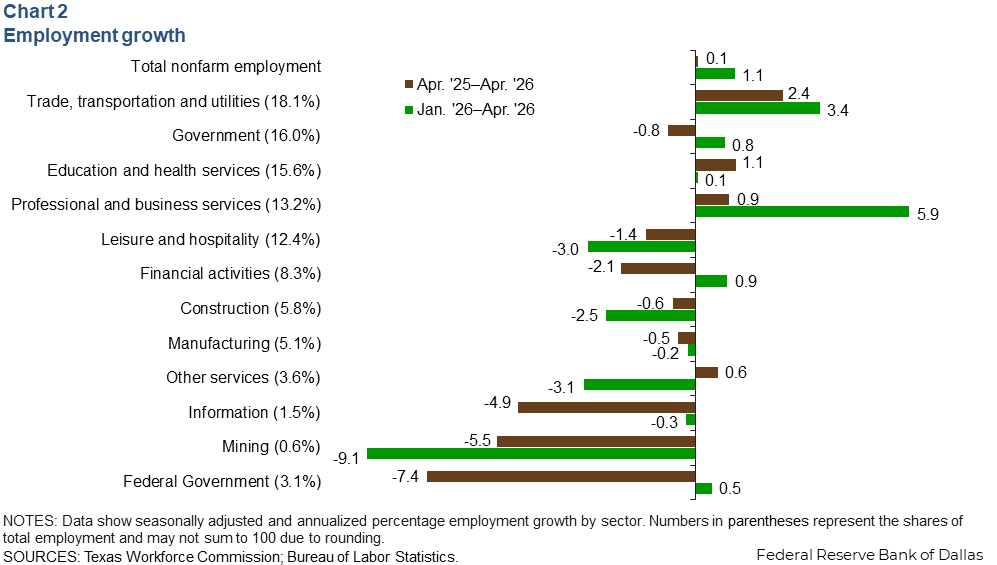
Employment increases
San Antonio payrolls grew an annualized 1.1 percent from March to April and ticked up 0.1 percent compared to April 2025 (Chart 2). Payroll employment rose 1.1 percent (3,220 jobs) from January through April, with the greatest gains in professional and business services (5.9 percent, or 2,250 jobs), trade, transportation, and utilities (3.4 percent, or 1,820 jobs), and financial activities (0.9 percent, or 220 jobs). Over the same period, the largest employment declines were in natural resources and mining (9.1 percent, or 170 jobs), leisure and hospitality (3.0 percent, or 1,130 jobs) and construction (2.5 percent, or 430 jobs).
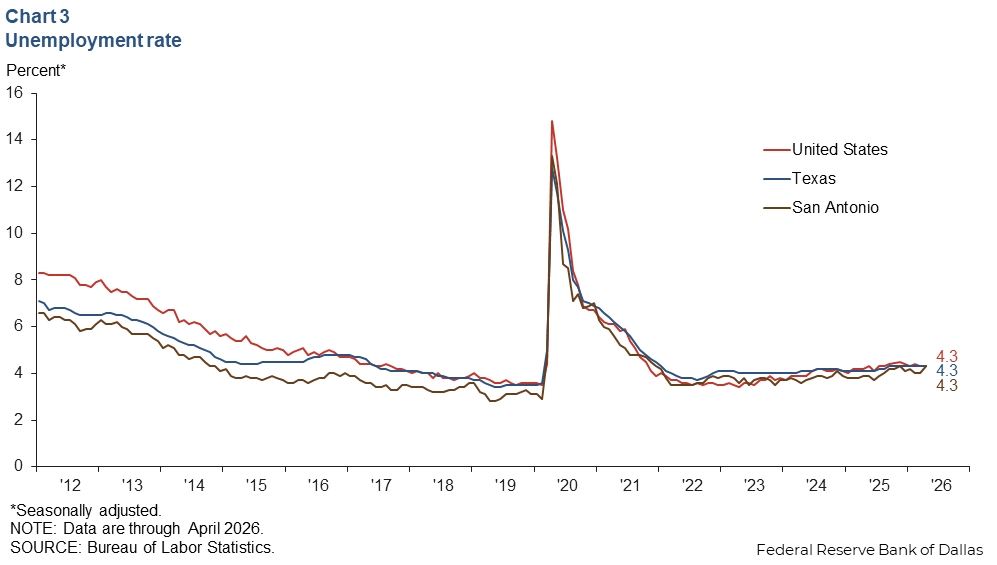
Unemployment rate increases
The San Antonio unemployment rate rose to 4.3 percent in April (Chart 3). The jobless rate was the same as in the U.S. and Texas.
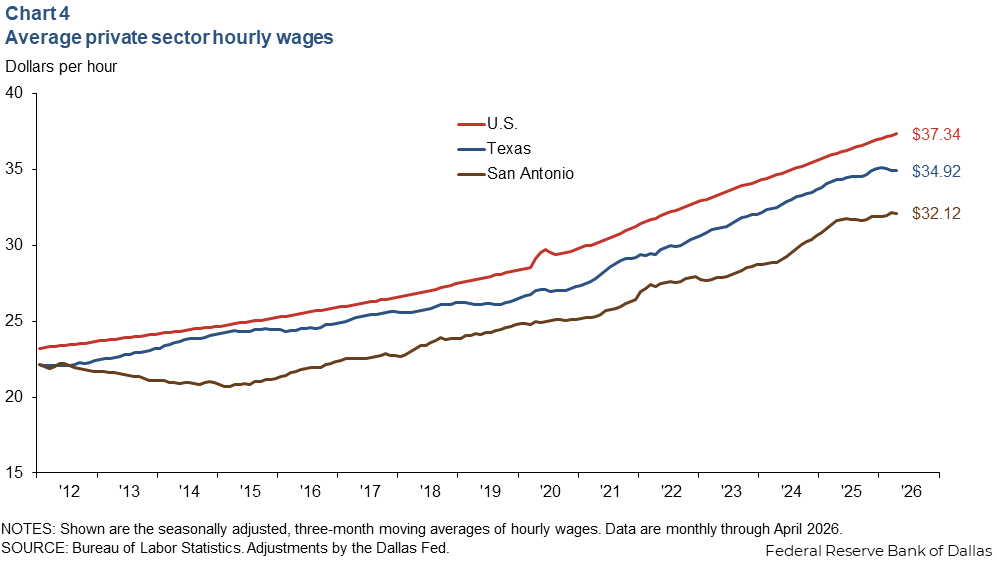
Wage growth slows
The average nominal hourly wage in San Antonio was $32.12 in April (Chart 4). Wages are seasonally adjusted and smoothed with a three-month moving average. Year over year, San Antonio wages grew 1.6 percent in April, while wages in Texas rose 1.8 percent and U.S. wages grew 3.6 percent. Earnings in San Antonio remained lower than the state and nation.
Housing market
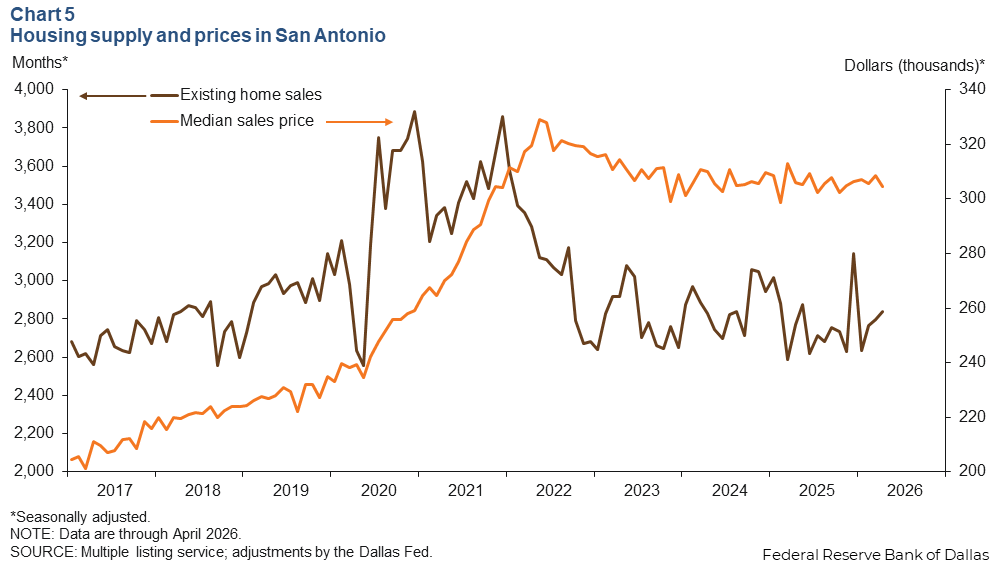
Existing-home sales in San Antonio rose an annualized 1.5 percent compared to March and 2.3 percent compared with last April (Chart 5). The median sales price declined 1.3 percent in April from March and was 0.4 percent lower than a year ago. The supply of existing homes for sale in San Antonio rose to 6.3 months, greater than Texas’s 5.3-month supply.
Apartment market
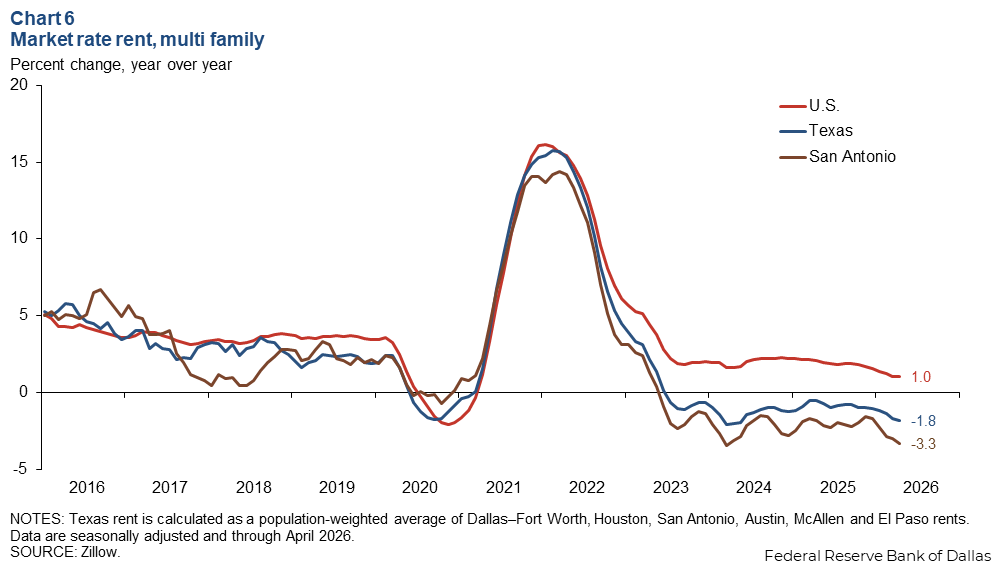
Year over year, apartment rents declined 3.3 percent in April while declining 1.8 percent in Texas and increasing 1.0 percent in the U.S. (Chart 6). San Antonio rents were $1,240 in December, lower than the state ($1,420) and nation ($1,770). From March to April, rents declined an annualized 5.5 percent in San Antonio and 2.6 percent statewide while rising 0.6 percent nationally.
NOTE: Data may not match previously published numbers due to revisions.
About San Antonio Economic Indicators
Questions or suggestions can be addressed to Luis Torres. San Antonio Economic Indicators publishes bimonthly after state and metro employment data are released.