San Antonio Economic Indicators

| San Antonio economy dashboard (June 2026) | |||
| Job growth (annualized) Mar.–Jun. '26 |
Unemployment rate |
Avg. hourly earnings |
Avg. hourly earnings growth y/y |
| 0.1% | 4.4% | $32.18 | 1.3% |
San Antonio payrolls declined, while the unemployment rate rose in June. Wages registered an annual increase. In the housing market, existing home sales and median home prices increased, while the months of home inventory declined. Meanwhile, apartment rents continued their multiyear decline.
Business-cycle index
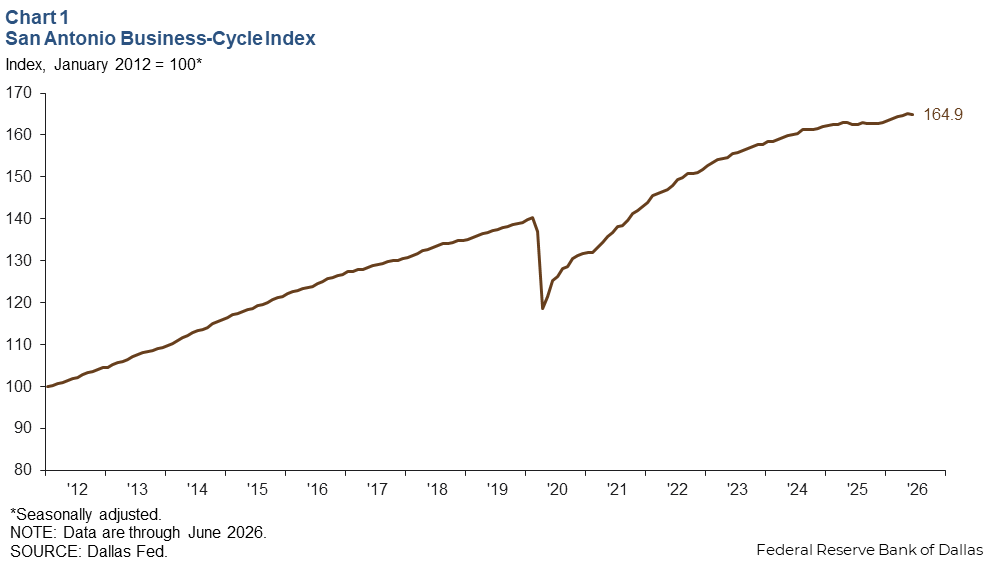
The San Antonio Business-Cycle Index, a gauge of economic conditions in the metro area, dipped an annualized 1.5 percent in June from May (Chart 1).
Labor market
Employment decreased
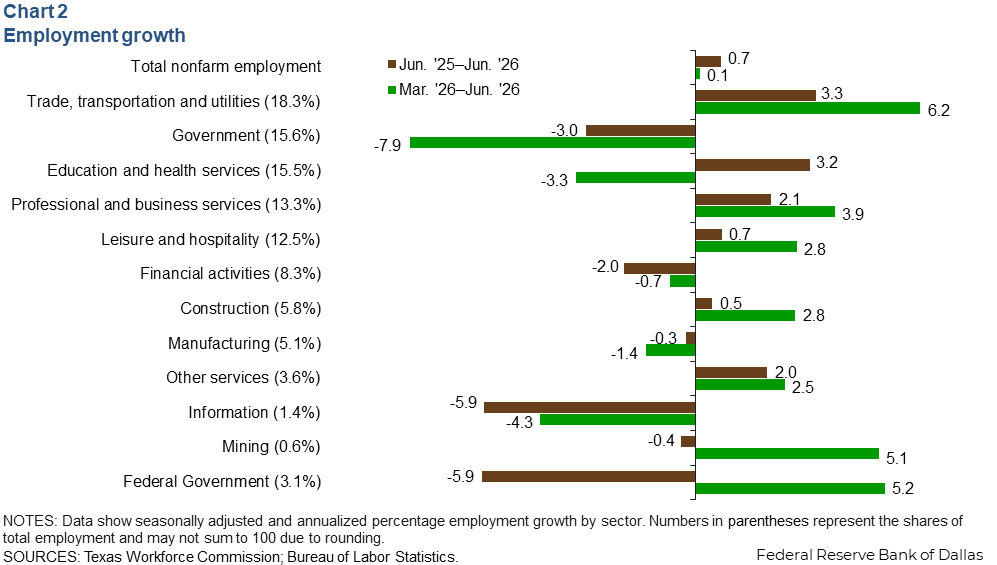
San Antonio payrolls fell an annualized 3.1 percent in June but were up 0.7 percent compared with June 2025 (Chart 2). Payroll employment was little changed at 0.1 percent (330 jobs) from March through June. The greatest gains were seen in trade, transportation, and utilities (6.2 percent, or 3,280 jobs), professional and business services (3.9 percent, or 1,490 jobs), and leisure and hospitality (2.8 percent, or 1,030 jobs). Over the same period, the largest employment declines were in government (7.9 percent, or 3,880 jobs), education and health (3.3 percent, or 1,560 jobs), and manufacturing (1.4 percent, or 210 jobs).
Unemployment rate increases
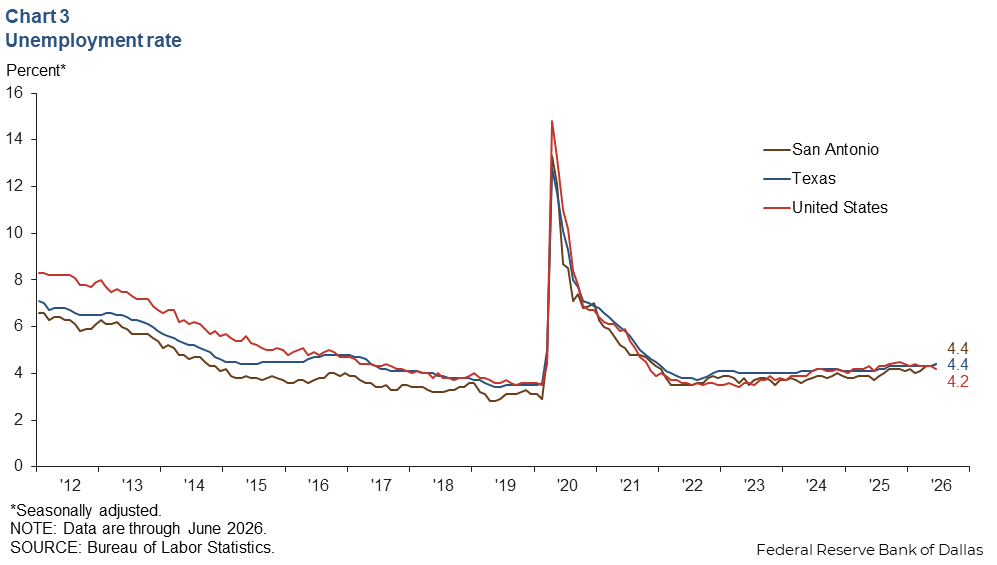
The San Antonio unemployment rate rose to 4.4 percent in June (Chart 3). The jobless rate is 4.4 percent in the state and 4.2 percent in the nation.
Wage growth subdued
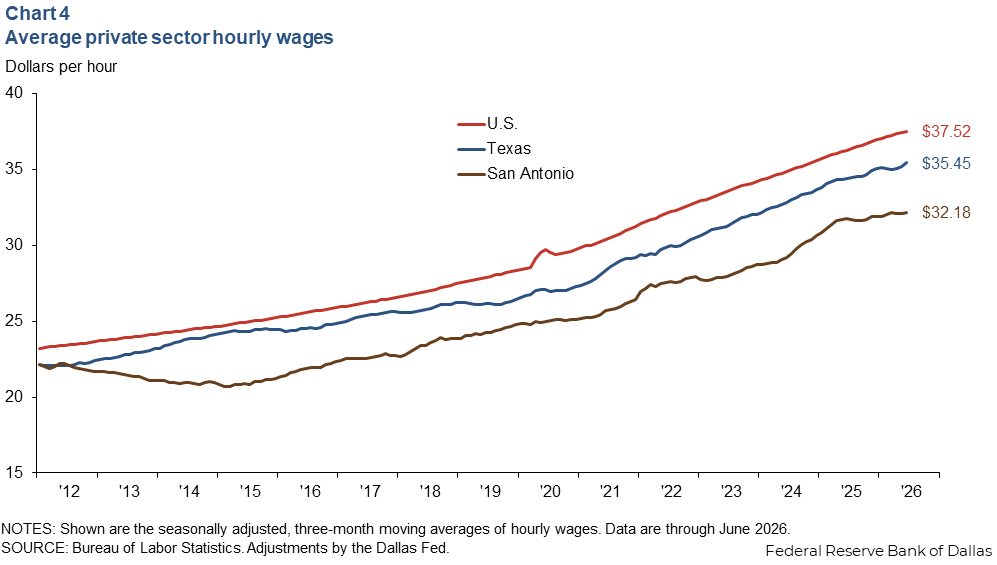
The average nominal hourly wage in San Antonio was $32.18 in June (Chart 4). Wages are seasonally adjusted and smoothed with a three-month moving average. Year over year, San Antonio wages grew 1.3 percent in June, while wages in Texas rose 2.9 percent and U.S. wages grew 3.5 percent. Earnings in San Antonio remain lower than the state and nation.
Housing market
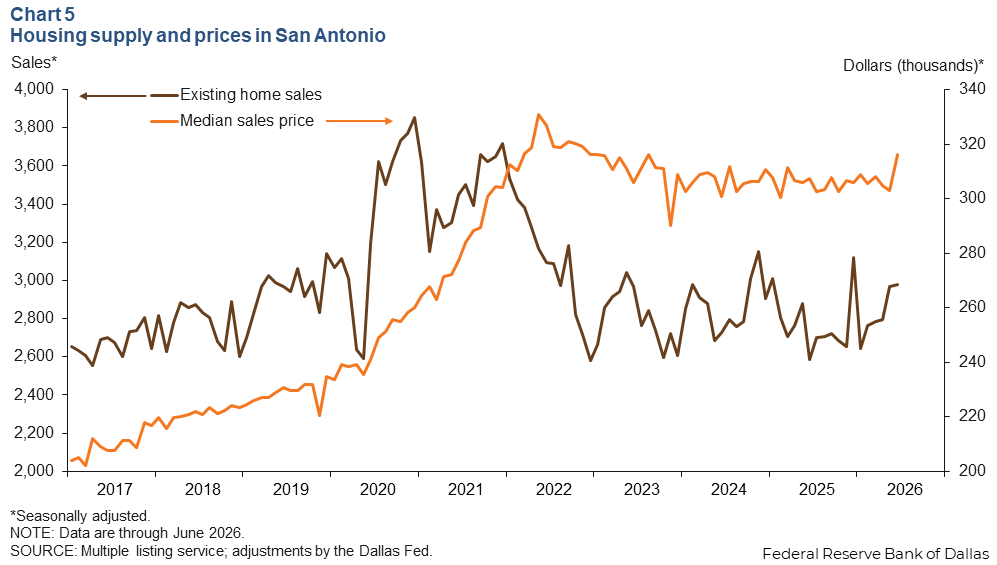
Existing home sales in San Antonio rose 0.4 percent in June and were up 15.3 percent year over year (Chart 5). The median sales price increased 4.3 percent in June from May and was 2.9 percent higher than a year ago. The supply of existing homes for sale in San Antonio declined to 5.9 months but remained greater than Texas’s 5.1-month supply.
Apartment market
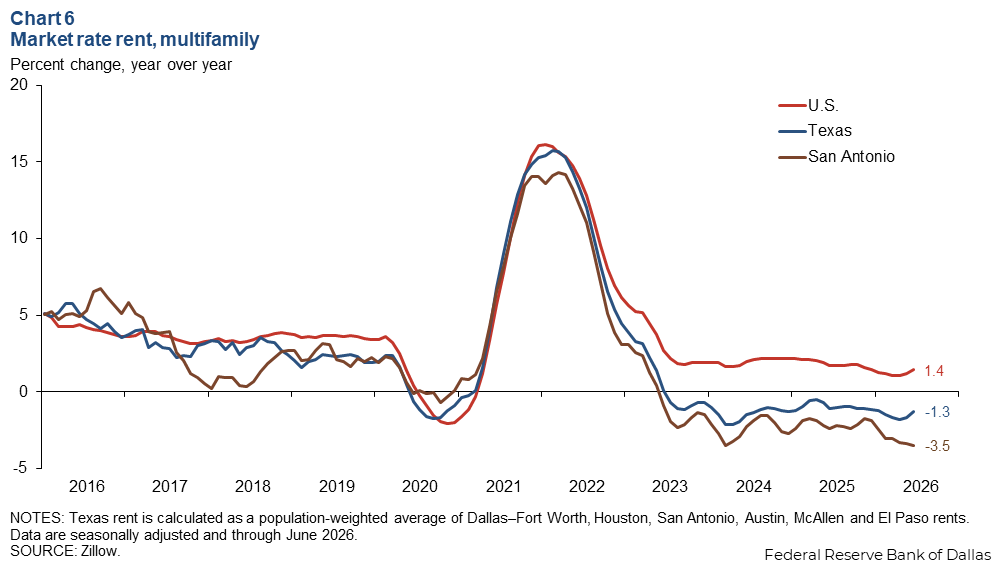
Year-over-year apartment rents were down 3.5 percent in San Antonio in June while declining 1.3 percent in Texas and increasing 1.4 percent in the U.S. (Chart 6). San Antonio rents were $1,248 in June, lower than the state ($1,418) and nation ($1,789). Rents declined an annualized 4.6 percent from May to June in San Antonio but rose 0.8 percent in Texas and 2.8 percent nationally.
NOTE: Data may not match previously published numbers due to revisions.
About San Antonio Economic Indicators
Questions or suggestions can be addressed to Dylan Council at dylan.council@dal.frb.org. San Antonio Economic Indicators is published every month during the week after state and metro employment data are released.