Southern New Mexico Economic Indicators

Third Quarter 2022
| Las Cruces economy dashboard September 2022 | |||
| Job growth (annualized) June–September |
Unemployment rate |
Avg. hourly wages |
Avg. hourly wages y/y |
| 1.5% | 4.7% | $26.69 | 15.89% |
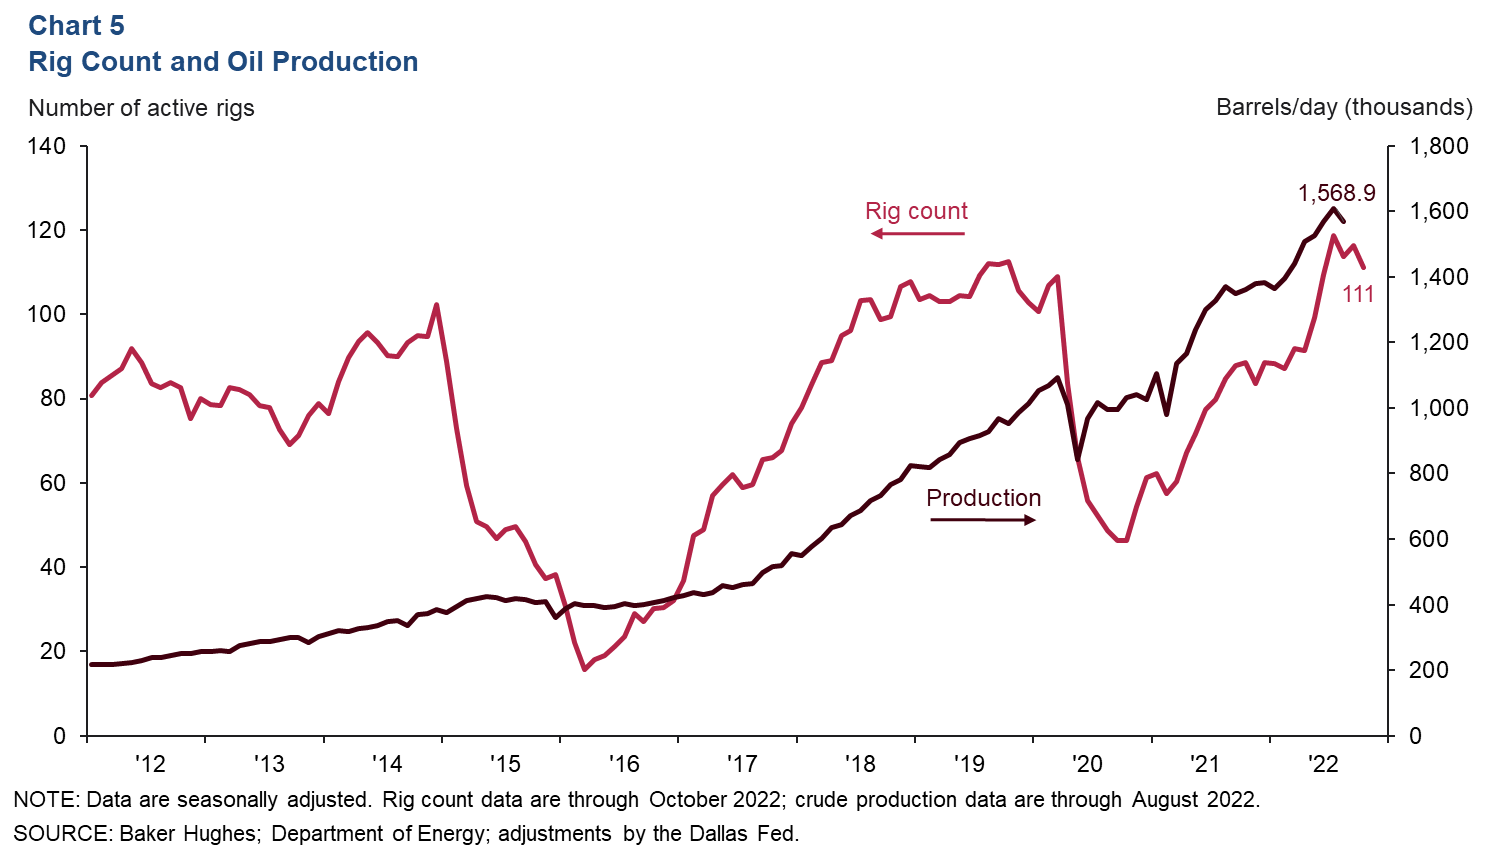
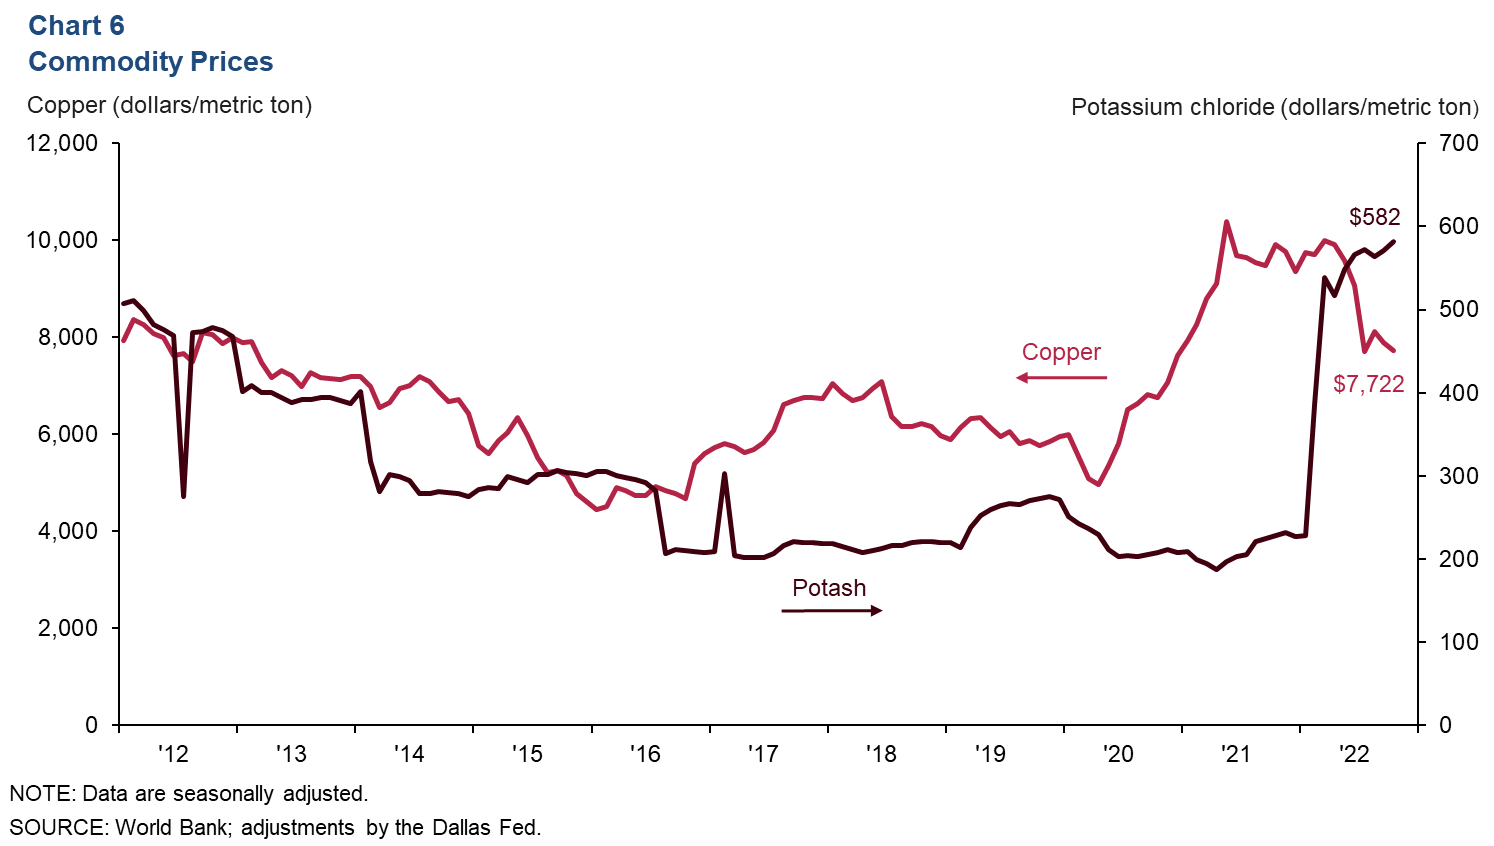
Nonfarm employment payrolls in Las Cruces continued to grow in the third quarter, while unemployment ticked up for the first time in months. Consumer spending remained above prepandemic levels. Cross-border trade continued to climb. The energy sector slowed as both rig count and oil production fell. Potash prices stayed strong, but copper prices softened.
Labor market
Payroll growth strong in 2022
Las Cruces’ nonfarm payroll employment rose 1.5 percent (278 jobs) in the third quarter (Chart 1). Quarterly employment gains primarily came from government (463), and construction and mining (159). Despite overall payroll expansion, most sectors lost jobs. Leisure and hospitality employment fell 8.9 percent (201), while trade, transportation and utilities declined 5.2 percent (151).
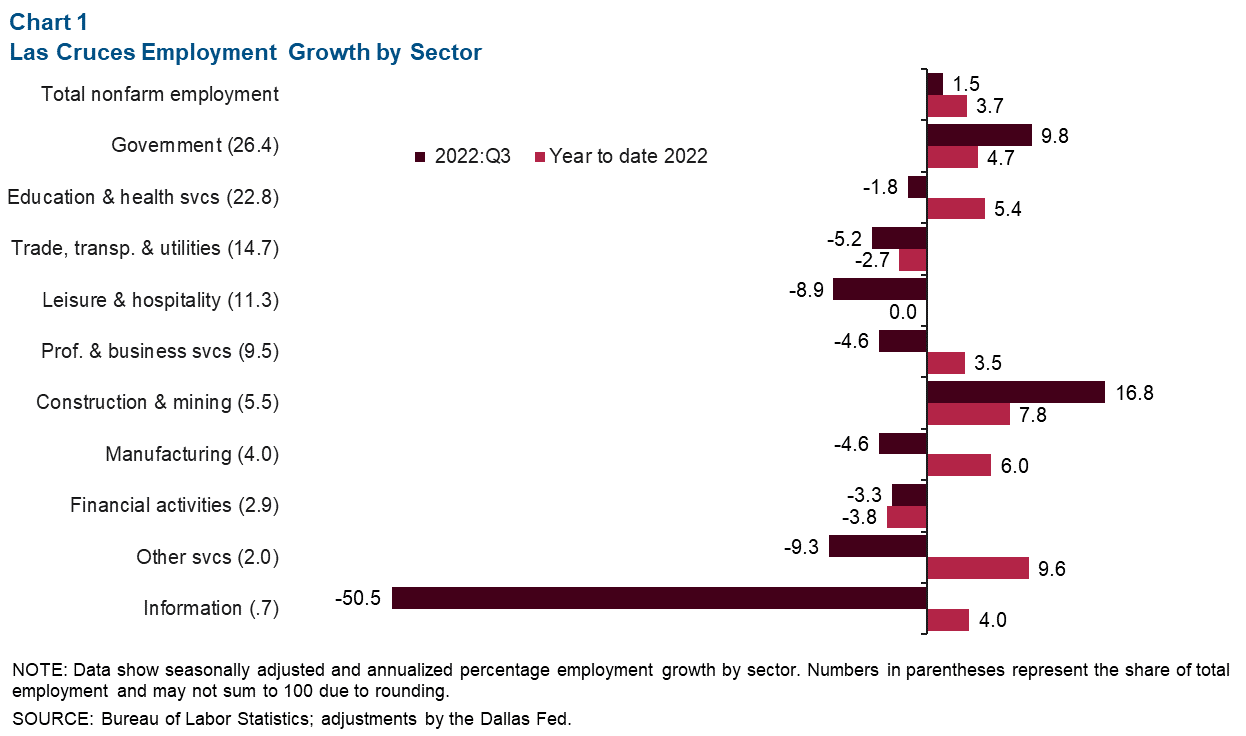
Year-to-date employment growth was strong at 3.7 percent (2,043 jobs). Trade, transportation and utilities and financial activities are the only sectors that have contracted so far in 2022, down 2.7 percent (228) and 3.8 percent (65) respectively.
Unemployment ticks up
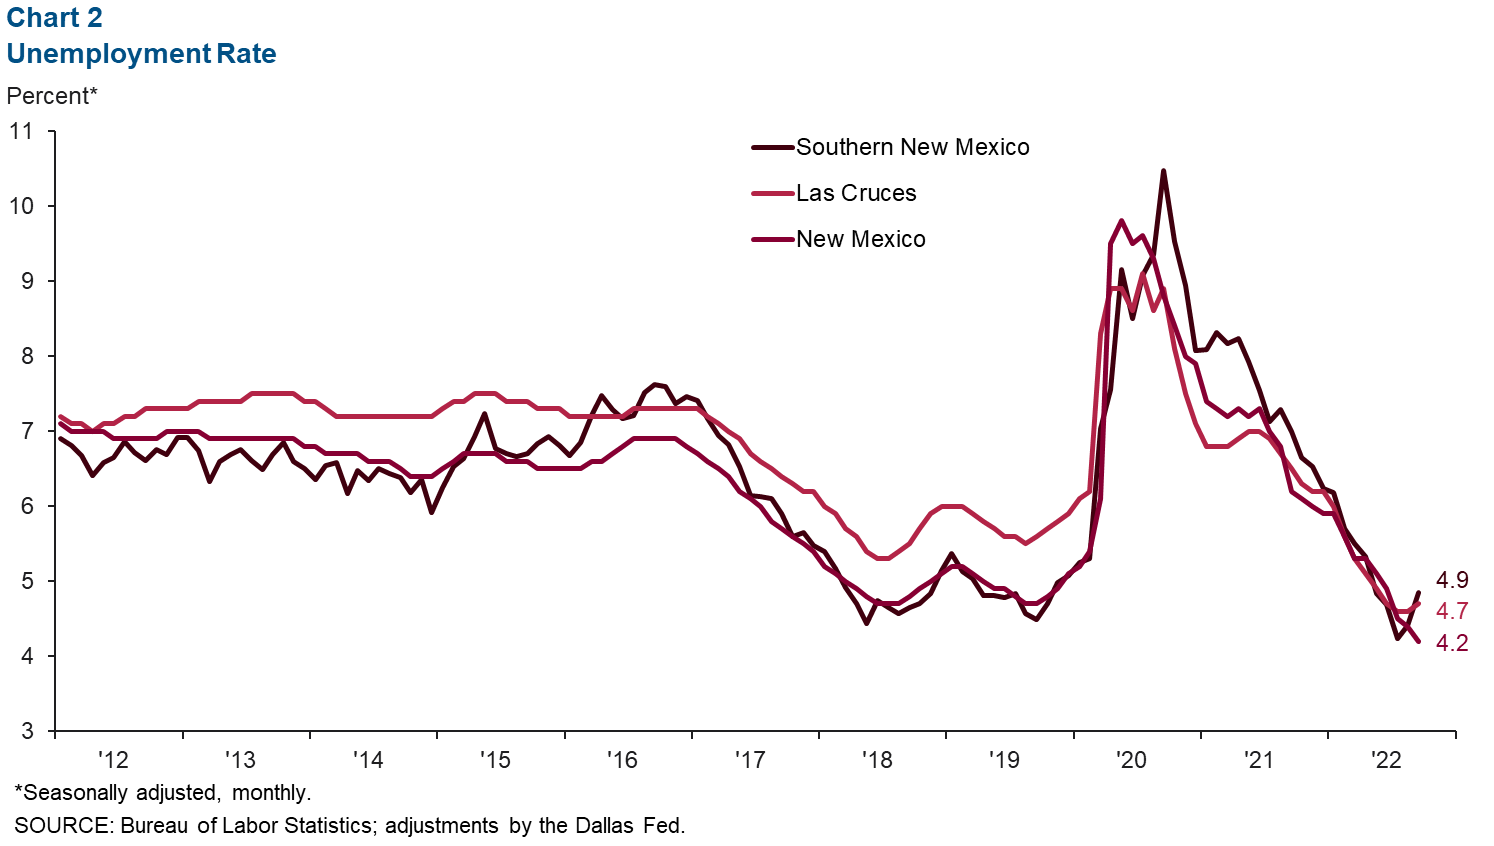
After months of decline, unemployment edged up in September to 4.7 percent in Las Cruces and 4.9 percent in southern New Mexico (Chart 2). Despite the increase, unemployment remains below prepandemic levels. Overall unemployment in New Mexico dipped to 4.2 percent.
Consumer spending
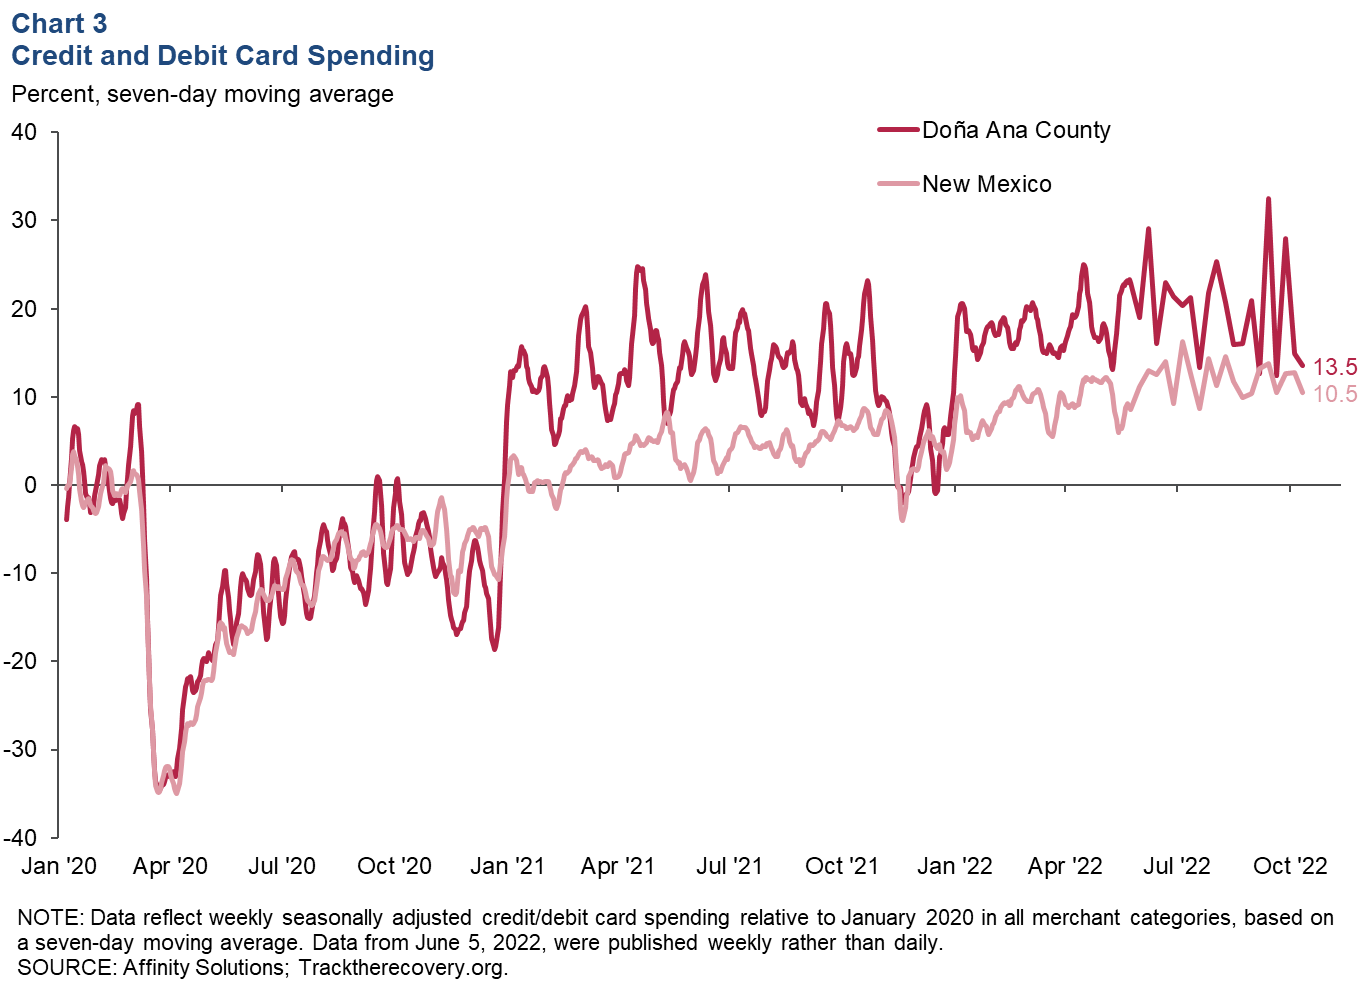
Doña Ana County consumer spending remained above prepandemic levels in October. During the week ending Oct. 23, credit and debit card spending in the county was up 13.5 percent from January 2020, compared with a 10.5 percent increase in New Mexico (Chart 3).
Cross-border trade
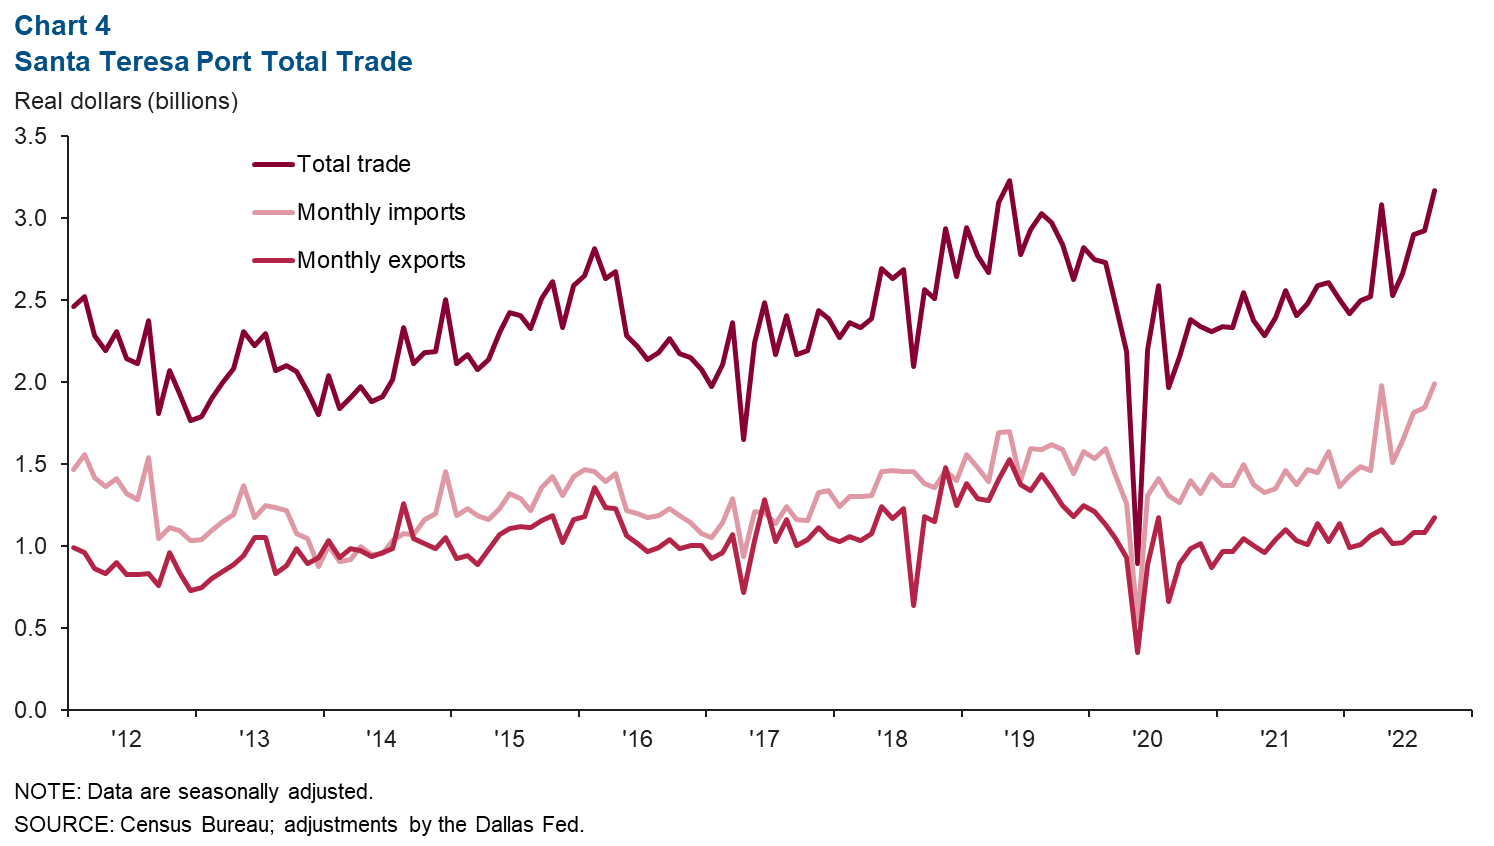
Monthly trade through the Santa Teresa port totaled $3.2 billion in September, reaching the highest levels since May 2019 (Chart 4). Trade grew 8.2 percent in September, driven by a 7.9 percent increase in imports and an 8.6 percent rise in exports. Total trade through Santa Teresa grew $721.4 million from second to third quarter 2022. Imports increased $518.8 million, while exports rose $202.6 million.
Commodity markets
Rig counts and oil production soften
The New Mexico rig count declined in October to 111 from 116 in September (Chart 5). Crude oil production also dropped to 1.57 million barrels a day in August. Still, oil production was up 14.5 percent from August 2021.
Potash prices remain elevated, copper prices decline
In addition to oil and natural gas, southern New Mexico's economy is dependent on other commodities, such as potash, copper and silver. The price of potash, which is used in fertilizer, increased dramatically after producer Russia invaded Ukraine and was hit with sanctions. The tighter supplies have contributed to the rise in food prices. Potash price growth slowed in the third quarter, but prices still increased by 0.9 percent from the second quarter (Chart 6). Potash prices have more than doubled since December 2021. Copper prices fell 13.1 percent from the second to third quarter and were down 17.5 percent year to date in October.
NOTES: Data may not match previously published numbers due to revisions. All New Mexico counties within the Federal Reserve’s Eleventh District are counted as part of southern New Mexico. Las Cruces is excluded from southern New Mexico to better gauge unemployment levels outside the region’s largest population center.
About Southern New Mexico Economic Indicators
Questions or suggestions can be addressed to Keighton Hines at Keighton.Hines@dal.frb.org. Southern New Mexico Economic Indicators is released quarterly.