Southern New Mexico Economic Indicators

| Las Cruces economy dashboard, June 2026 | |||
| Job growth (annualized) March–June '26 |
Unemployment rate |
Avg. hourly earnings |
Avg. hourly earnings y/y |
| 2.9% | 5.4% | $26.10 | 5.2% |
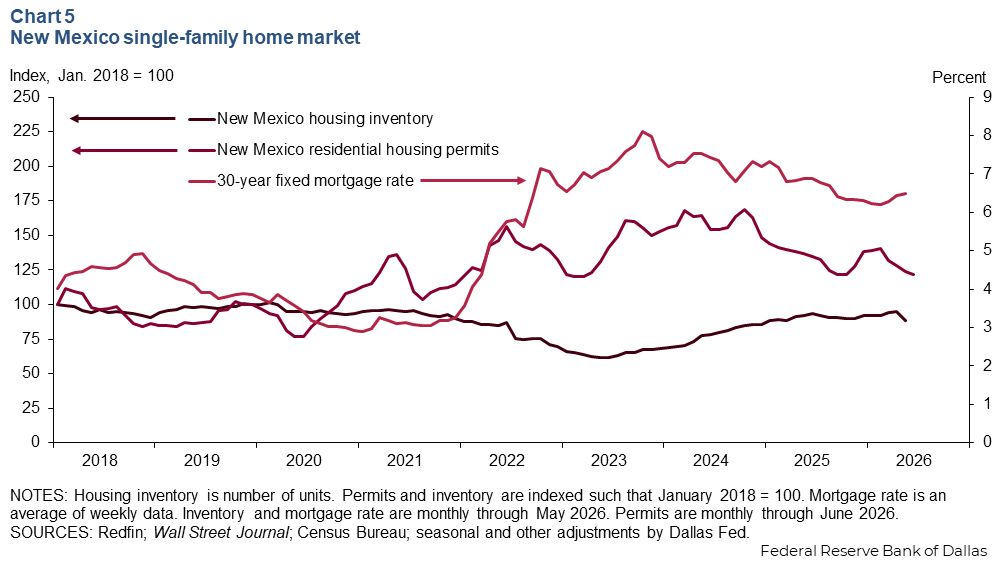
Employment in Las Cruces grew robustly from June 2025 to June 2026. Employment growth was also strong from March through June, and the unemployment rate was unchanged. Over the same period, nominal wage growth in the metro accelerated to the highest rate of growth since 2023. Oil production increased but the rig count fell. The statewide inventory of single-family homes declined, as did permits for new units.
Labor market
Employment growth strong
Employment in Las Cruces grew 2.2 percent (1,800 jobs) from June 2025 to June 2026 (Chart 1).
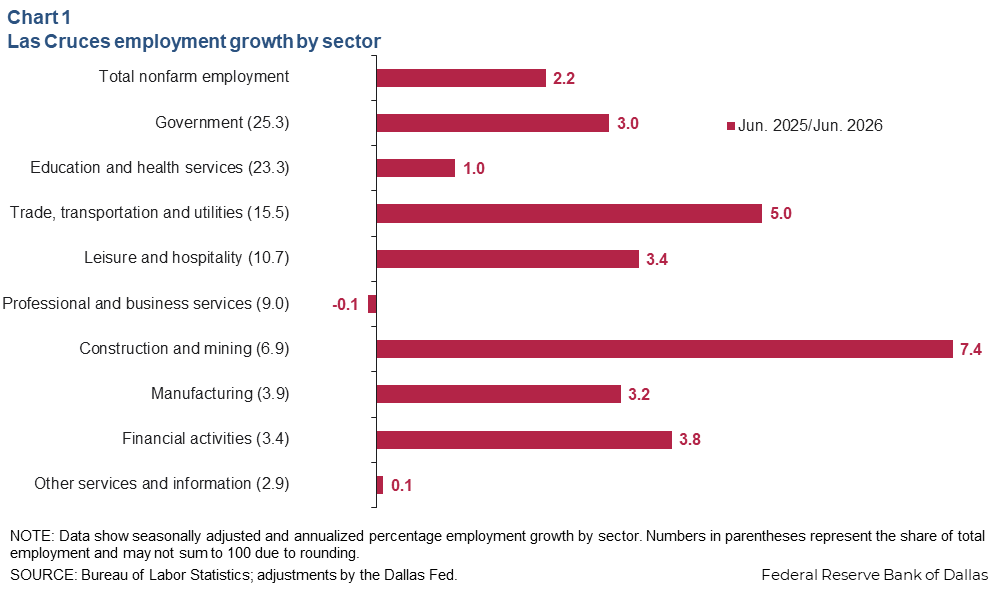
Employment growth was driven by gains in government (620 jobs), trade, transportation and utilities (620 jobs) and construction and mining (400 jobs). The professional and business services and other services and information sectors experienced no growth over the past year.
Unemployment stable
The unemployment rate in Las Cruces was unchanged at 5.4 percent in June compared to March (Chart 2). New Mexico’s unemployment rate was also unchanged at 4.8 percent in June compared to March. U.S. unemployment decreased to 4.2 percent in June from 4.3 percent in March.
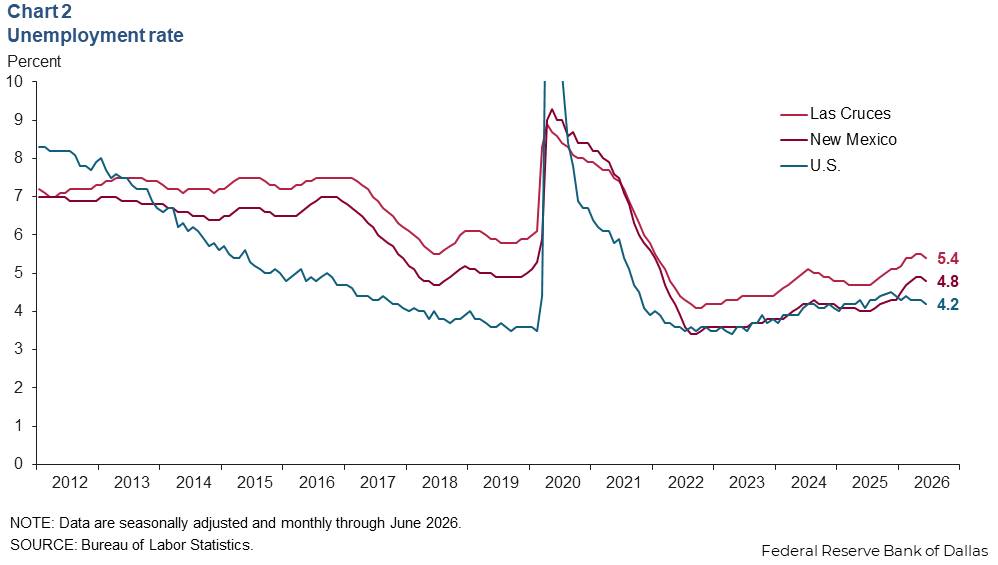
Year over year, unemployment in Las Cruces has increased from 4.7 percent in June 2025.
Wages grow moderately
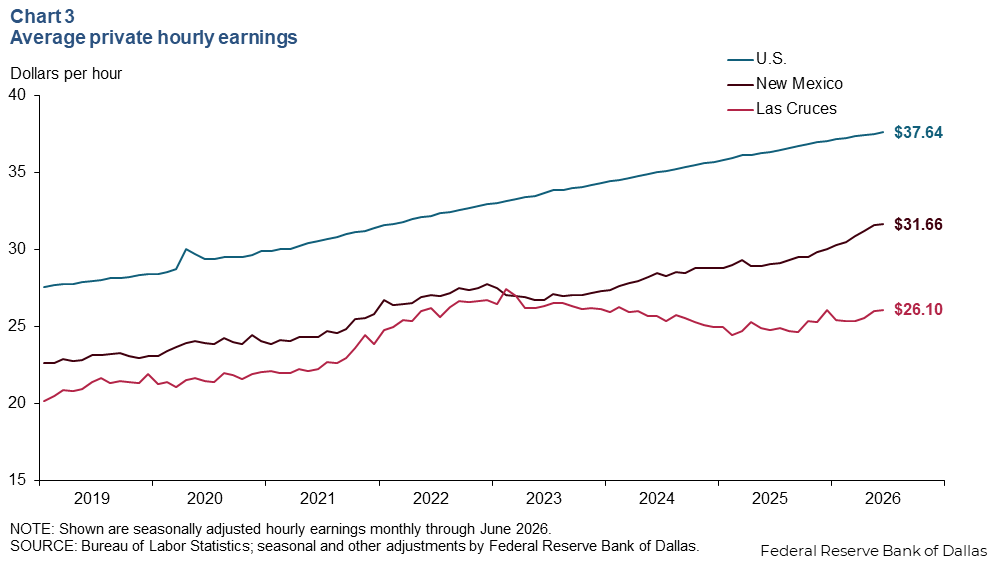
Average nominal hourly wages increased to $26.10 in June from $25.38 in March, a 2.8 percent increase (Chart 3). Year over year, wages in Las Cruces increased 5.2 percent. Average hourly wages in New Mexico were $31.66 per hour in June. The national average hourly wage was $37.64 per hour in June.
Energy
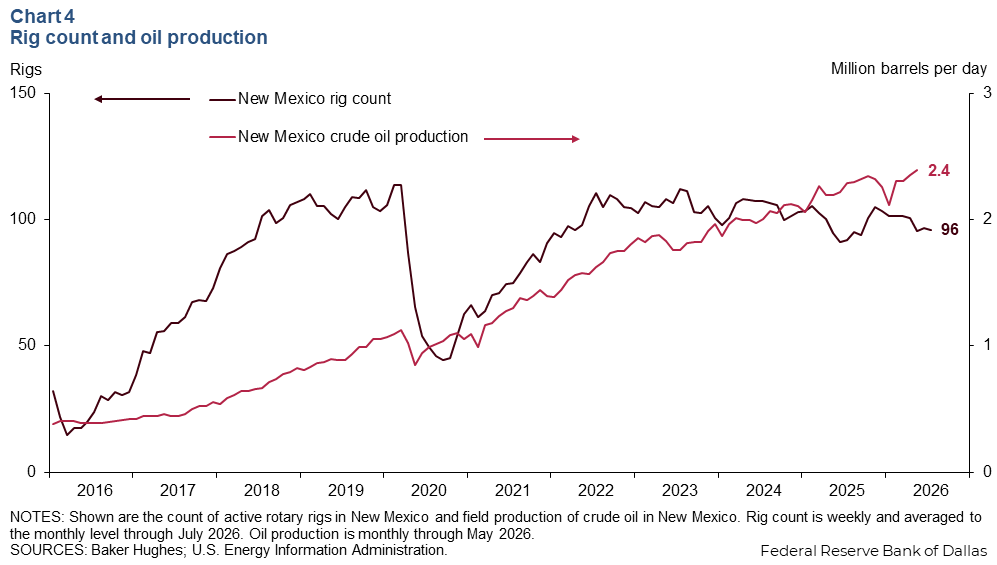
New Mexico’s production of crude oil increased to 2.4 million barrels per day (mb/d) in May 2026 (Chart 4). The rig count in New Mexico was 96 in July, lower than three months prior.
Real estate
Building permits for new single-family units declined 7.2 percent in New Mexico over the three months ending in June (Chart 5). The inventory of single-family homes in New Mexico declined to 3,600 in May 2026 from 3,800 in February.
NOTE: Data may not match previously published numbers due to revisions.
About Southern New Mexico Economic Indicators
Questions or suggestions can be addressed to Robert Leigh. Southern New Mexico Economic Indicators is released quarterly.