Southern New Mexico Economic Indicators

| Las Cruces economy dashboard, September 2026 | |||
| Job growth (annualized) June–Sept. '26 |
Unemployment rate |
Avg. hourly earnings |
Avg. hourly earnings y/y |
| 7.8% | 5.4% | $25.67 | 4.0% |
Total job growth was strong in Las Cruces from June through September 2026, but growth was mixed across sectors. The unemployment rate was unchanged over the third quarter. Wages fell slightly over the same time but have increased notably compared to last year. Oil production in New Mexico rose year over year in August, and the rig count ticked up over the three months ending in October. Copper prices remained high in October and have edged up slightly since July.
Labor market
Employment grows in the third quarter
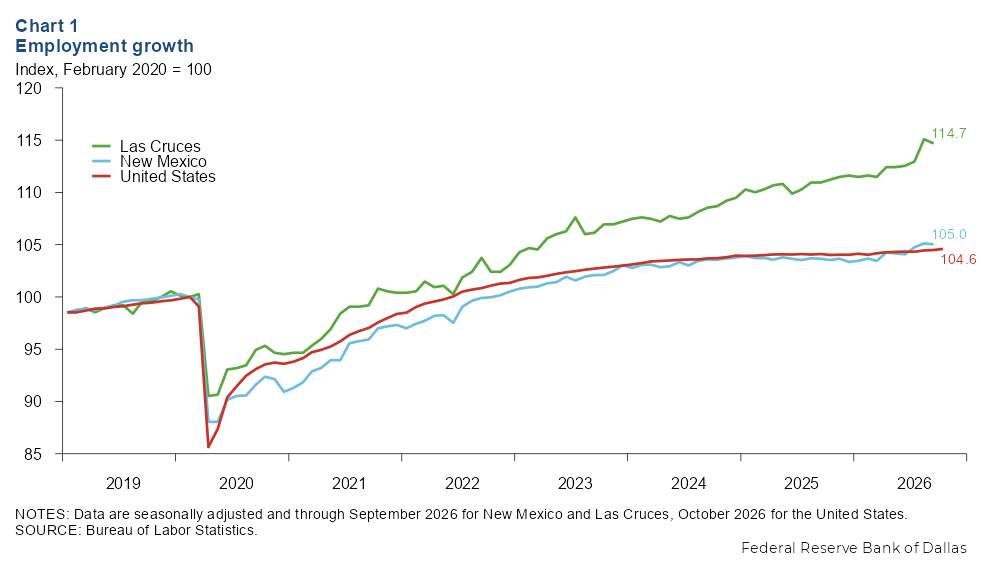
Las Cruces employment increased an annualized 7.8 percent over the three months ending in September. Over the same period, New Mexico employment advanced an annualized 3.7 percent while employment nationally expanded 1.0 percent annualized for the three months ending in October (Chart 1).
Job growth mixed across sectors
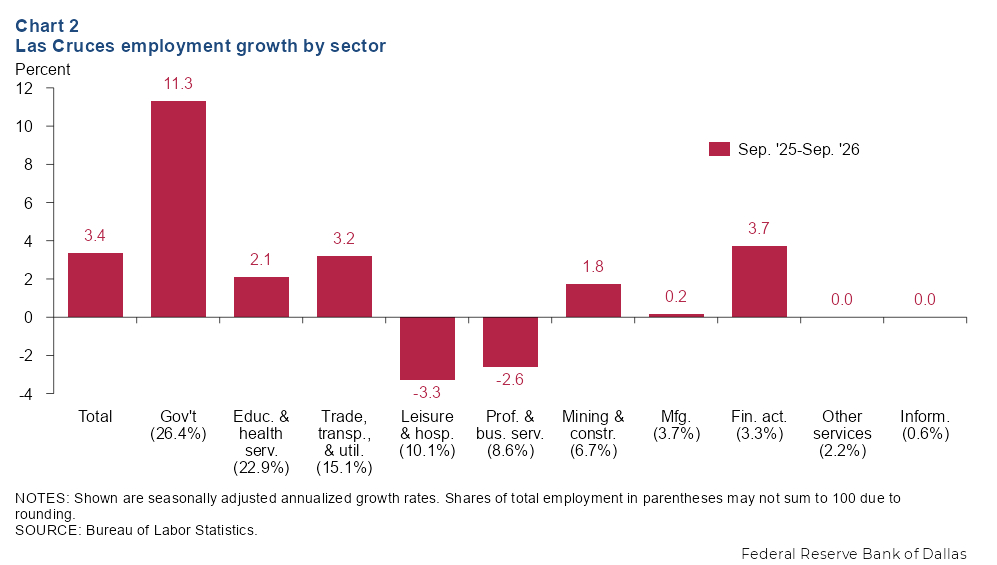
Payroll employment in Las Cruces grew 3.4 percent year over year in September (Chart 2). The sectors with the fastest payroll growth from September 2025 to September 2026 were government (11.3 percent), financial activities (3.7 percent), and trade, transportation and utilities (3.2 percent). Two sectors experienced contraction in payrolls, leisure and hospitality (-3.3 percent), and professional and business services (-2.6 percent).
Unemployment rate little changed
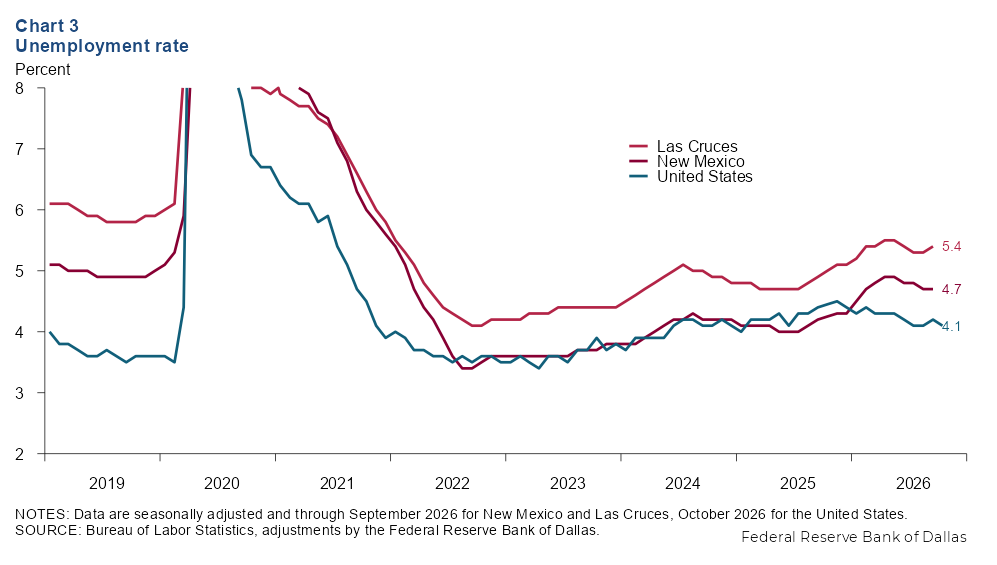
The unemployment rate in Las Cruces was 5.4 percent in September (Chart 3), the same as in June. The jobless rate was lower in New Mexico in September (4.7 percent) and the United States in October (4.1 percent). The labor force in Las Cruces grew an annualized 0.8 percent over the three months ending in September.
Wages tick down
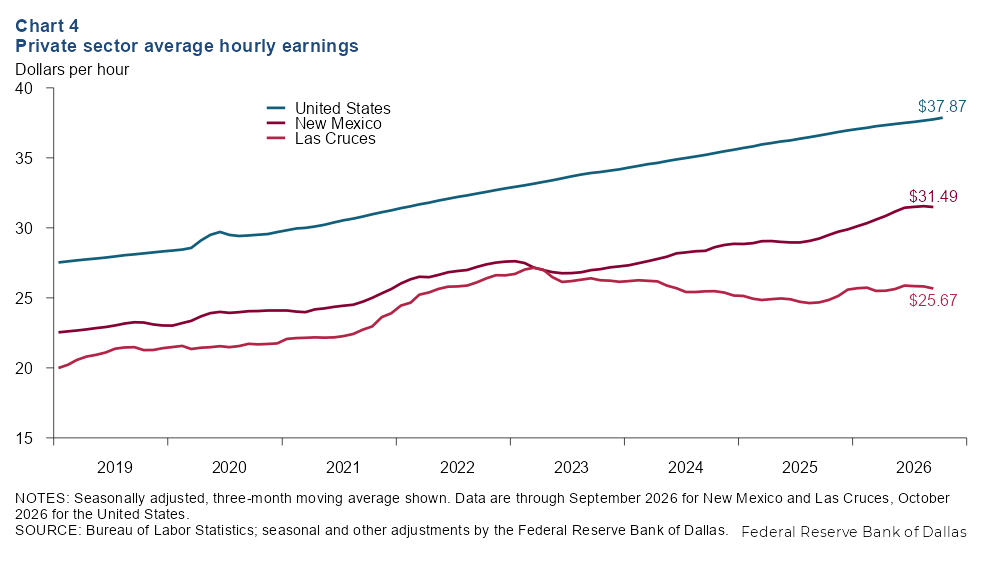
The smoothed average nominal hourly wage in Las Cruces declined slightly to $25.67 in September from $25.88 in June (Chart 4). Year over year, wages in Las Cruces grew 4.0 percent in September, while wages in New Mexico rose 7.7 percent. U.S. wages grew 3.1 percent in October. Earnings in Las Cruces remain lower than both the state and nation.
Commodity markets
Crude oil production increases
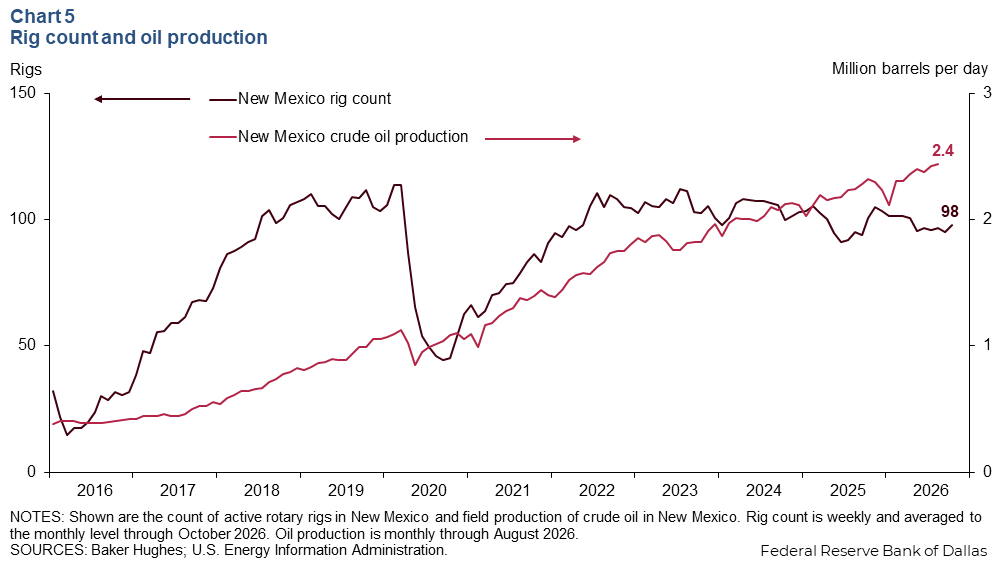
New Mexico’s production of crude oil rose to 2.4 million barrels per day (mb/d) in August 2026 (Chart 5). Year over year, crude production expanded 8.9 percent in August. The rig count in New Mexico was 98 in October, a gain from 96 in July.
Copper prices remain high
In addition to oil and natural gas, southern New Mexico also produces commodities such as potassium chloride and copper. The three-week moving average of copper spot prices was $6.56 per pound the week of October 30 from $6.33 the week of July 31 (Chart 6). Year over year, copper prices have climbed 30.0 percent.
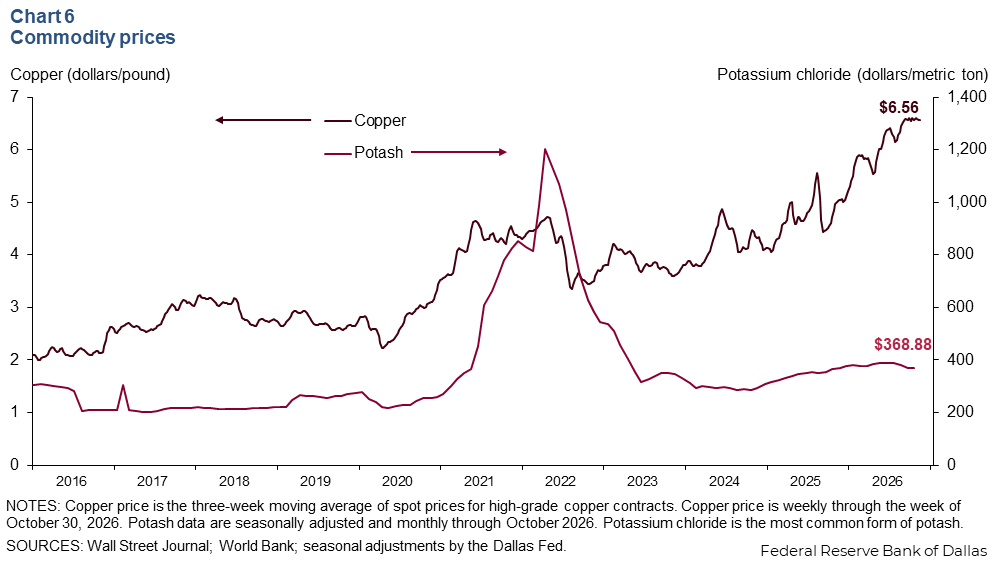
Potassium chloride is a form of potash and is commonly used in fertilizer. Potassium chloride prices declined to $368.88 per metric ton in October from $386.67 in July. Year over year, potash prices have increased 1.5 percent.
NOTE: Data may not match previously published numbers due to revisions.
About Southern New Mexico Economic Indicators
Questions or suggestions can be addressed to Robert Leigh. Southern New Mexico Economic Indicators is released quarterly.