Texas Economic Indicators

The Texas economy continued to post strong growth in April, with total nonfarm employment increasing from the previous month. Activity in the energy sector expanded further, with both the rig count and oil prices increasing. Texas exports grew in March, reaching their highest point in the history of the series. The Texas Leading Index and Texas Business Outlook Surveys both suggest the economy will continue to expand in 2018.
Labor Market
Solid Employment Growth Continues
Texas employment expanded an annualized 4.2 percent in April, or by 42,482 jobs, and March growth was revised up slightly to 2.6 percent (Chart 1). In contrast, U.S. jobs grew 1.3 percent in April and 1.1 percent in March. Year-over-year employment growth in Texas was 2.7 percent in April, an increase of 330,053 jobs.
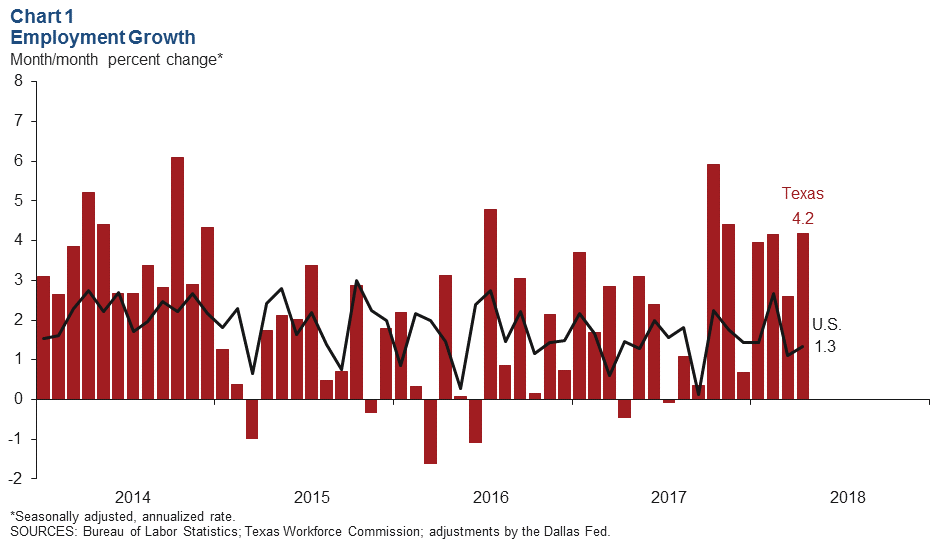
The Texas unemployment rate rose in April to 4.1 percent—slightly higher than the U.S. rate of 3.9 percent. The unemployment rate was unchanged from March for most major metros except Houston and San Antonio, which each inched down 0.1 percentage points to 4.6 and 3.4 percent, respectively.
Job Growth Widespread Across Sectors
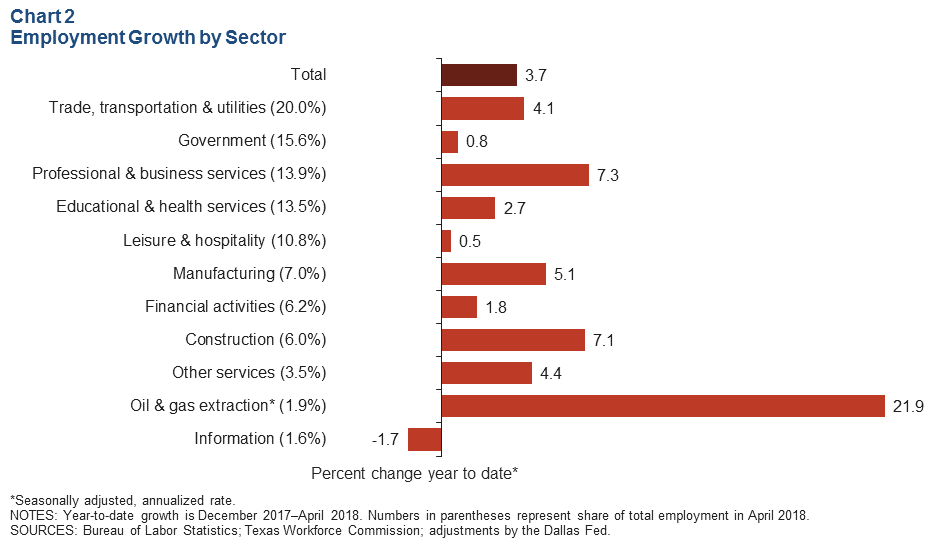
Employment growth has been broad based, with nearly every sector posting increases so far in 2018. The only exception has been information services (representing 1.6 percent of jobs in Texas), which fell an annualized 1.7 percent (Chart 2). Oil and gas extraction continued to have the highest growth rate this year, with professional and business services and construction also seeing strong growth. Sectors with the most jobs added this year are professional and business services (39,967), trade, transportation and utilities (33,163) and construction (16,740).
Texas Business Outlook Surveys
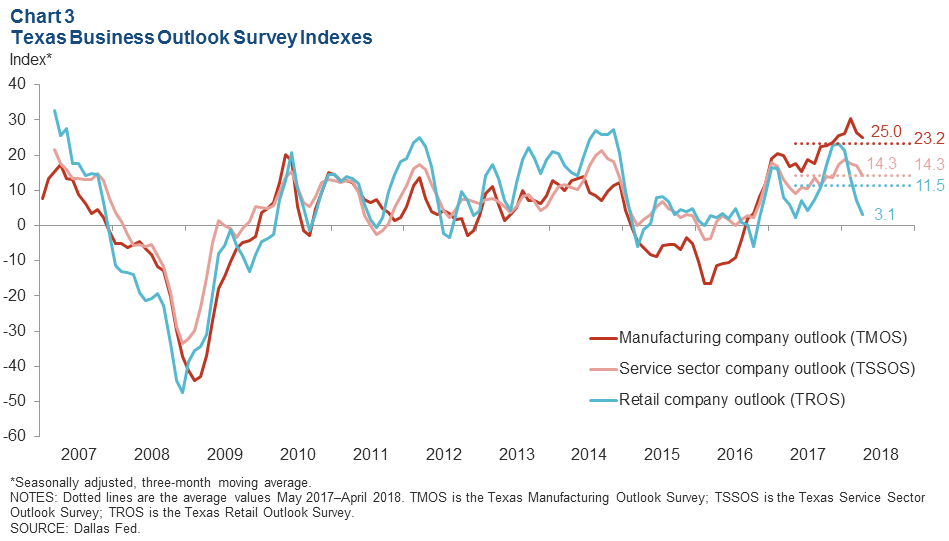
The Dallas Fed’s Texas Business Outlook Surveys for April indicate that the outlook across retail, manufacturing and service sectors remains optimistic. The three-month moving averages of the company outlook indexes for both the Texas Manufacturing Outlook Survey and Texas Service Sector Outlook Survey dipped in April but remain elevated at or above their 12-month averages (Chart 3). The three-month moving average of the Texas Retail Outlook Survey company outlook index fell to its lowest level since May 2017 but remains above zero—indicating continued optimism among survey respondents on net.
Energy Markets
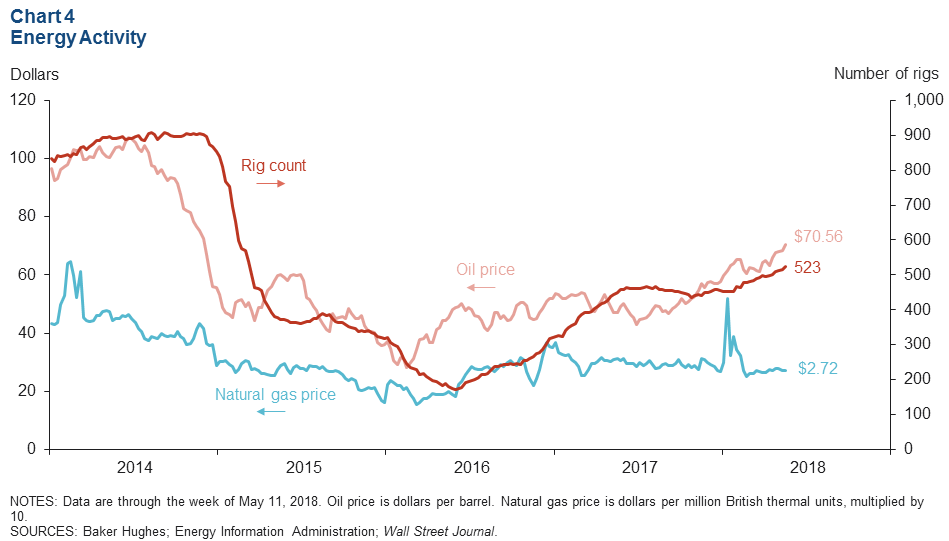
Energy indicators continued to improve in May, with both oil prices and the rig count reaching a three-year high (Chart 4). Natural gas prices were flat through April and early May, ending at $2.72 per million British thermal units (MMBtu), which was slightly below the 12-month average price of $2.95 per MMBtu.
Exports
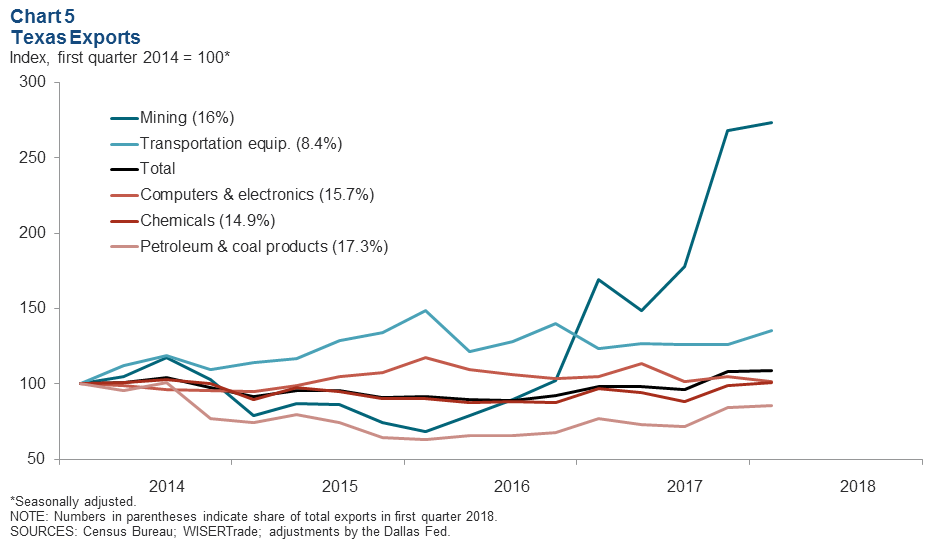
U.S. and Texas exports rose in February and March following a decrease in January. In March, Texas exports hit $23.8 billion, their highest point in the history of the series, which began in January 1994.
In the first quarter, Texas exports grew 0.6 percent. Petroleum and coal products and mining exports—which accounted for the largest and second-largest share of total exports in the first quarter—rose 1.7 and 1.9 percent, respectively (Chart 5). Exports of transportation equipment climbed 7.4 percent. Texas exports to Mexico, the state’s largest trading partner, rose 4 percent.
Texas Leading Index
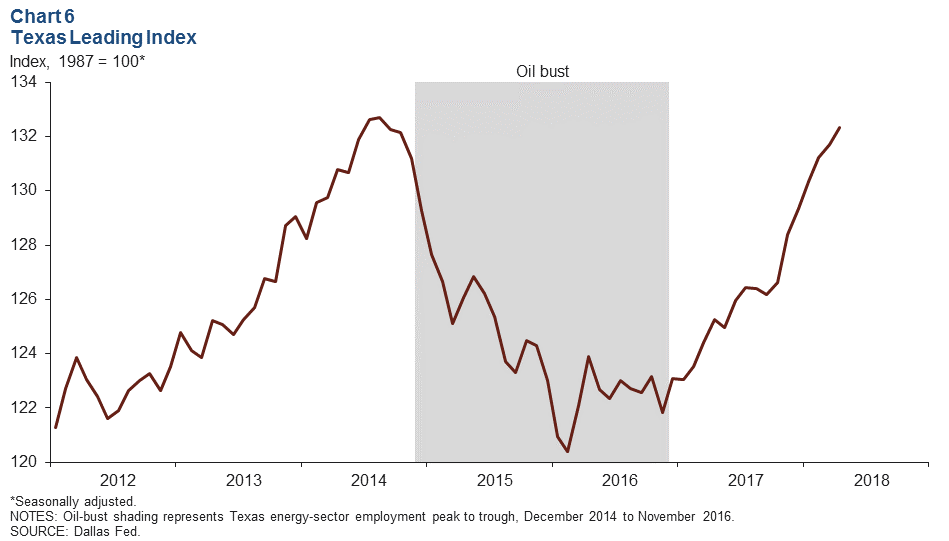
The Texas Leading Index, a composite of eight indicators that tend to change direction before the overall economy does, sheds light on the future of the state’s economy. In April, the estimated value of the index continued its rise, hitting a 44-month high that was just short (0.3 percent) of its previous peak in September 2014 (Chart 6). All components contributed positively to the index from February through April, with the exception of the help-wanted component, which held steady, and the Texas Stock index, which declined. Combined with the strong employment growth so far this year, leading index gains have contributed to an upward revision in the Dallas Fed’s Texas Employment Forecast to 3.6 percent for 2018 (December/December).
NOTE: Data may not match previously published numbers due to revisions.
About Texas Economic Indicators
Questions can be addressed to Benjamin Meier at Benjamin.Meier@dal.frb.org. Texas Economic Indicators is published every month on the Monday after Texas employment data are released.