Texas Economic Indicators

March 30, 2021
The Texas economic recovery showed signs of slowing in February as payrolls contracted and the unemployment rate rose. Even so, the Texas Leading Index continued to grow. Texas exports increased in January to most major regions, and home prices saw record-high growth at year-end. Dining out in Texas recently surpassed prepandemic levels, though the major metros lag behind the statewide measure.
Labor market
Employment growth stalls
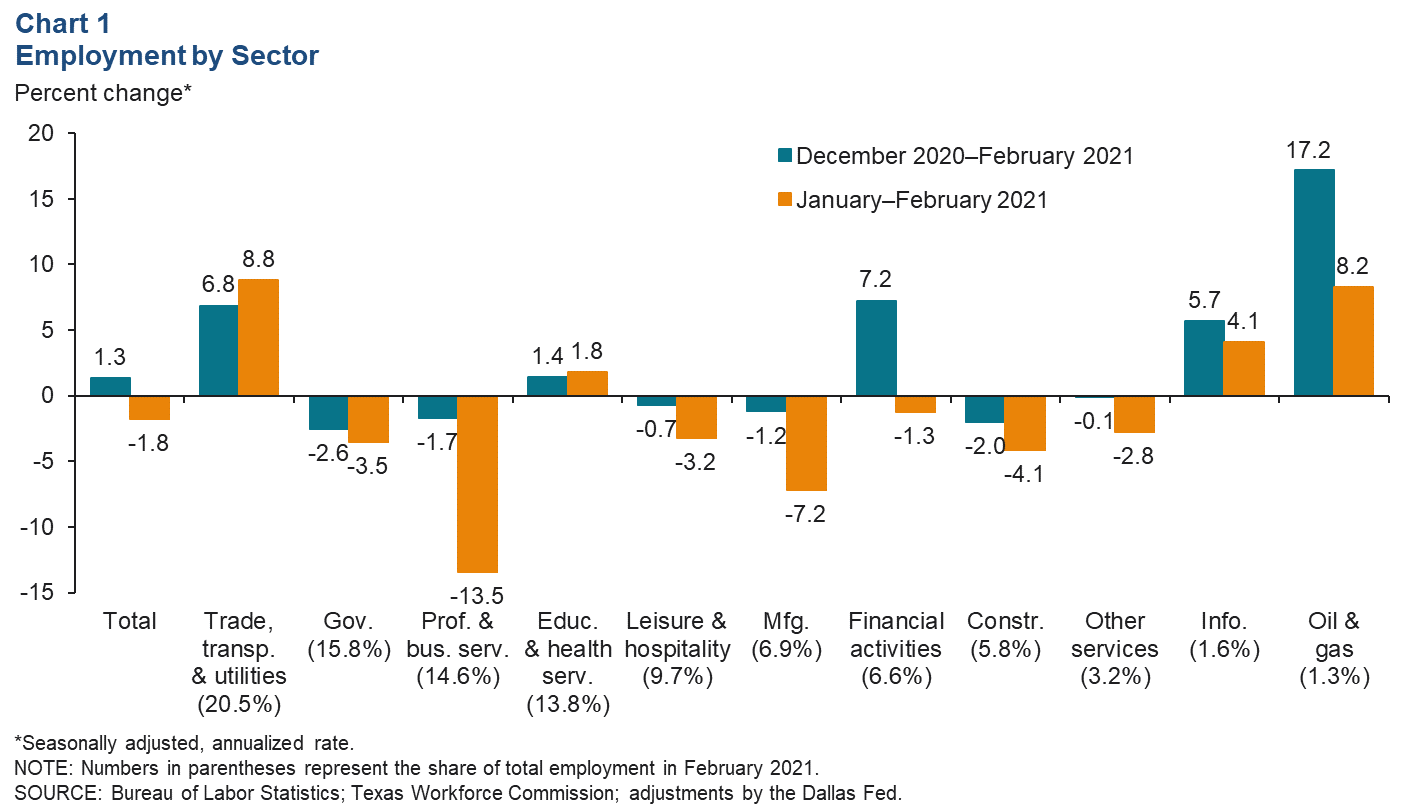
Texas employment fell an annualized 1.8 percent in February after climbing an upwardly revised 4.5 percent in January (Chart 1). The February decline occurred due to Winter Storm Uri, which nearly shut down activity in the state for about a week. February marks the first month of employment declines since the onset of the pandemic in March and April last year. Despite the contraction, February employment remains above year-end 2020 levels. While payrolls dipped in many sectors, oil and gas and trade, transportation and utilities both added jobs at a rate of over 8 percent. Information and education and health services jobs climbed 4.1 and 1.8 percent, respectively. Since December, growth has been strongest in the oil and gas sector, which has expanded 17.2 percent.
Texas unemployment ticks up
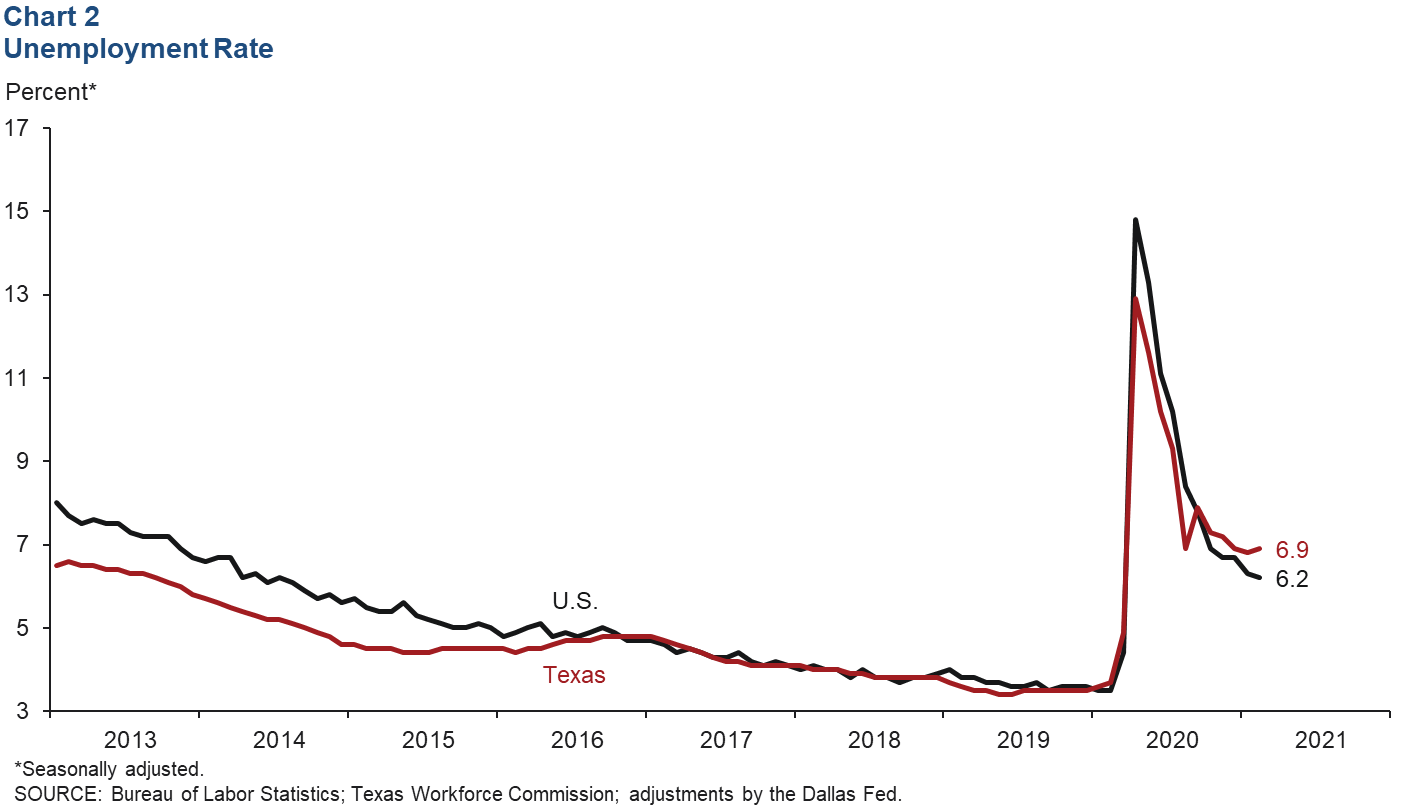
After declining for four months, the Texas unemployment rate ticked up in February (Chart 2). The national rate has trended downward for 10 months. Unemployment rose in all major Texas metros, especially in McAllen (up 0.9 percentage points) and Houston (up 0.4). Unemployment claims rose in the most recent week (March 21), suggesting that the state unemployment rate will remain elevated in March.
Texas leading index
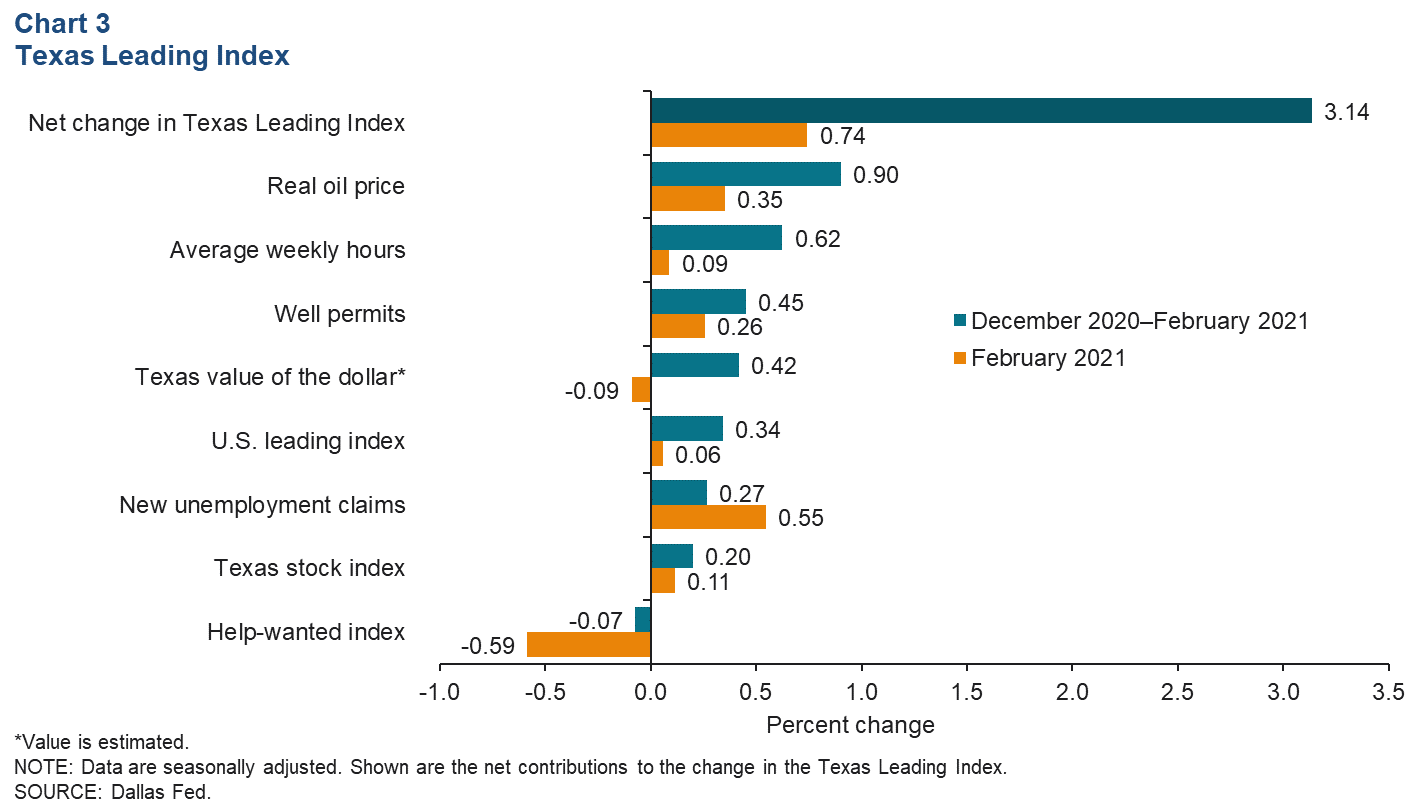
The Texas Leading Index sheds light on the future of the state's economy. February marks the 10th month in a row in which the index has grown, though it remains below the February 2020 prepandemic level. This February, growth in the index was driven by a decline in new unemployment claims, an increase in real oil prices and an increase in well permits (Chart 3). Monthly growth in the leading index was hampered by the change in the Texas value of the dollar, as well as the help-wanted index, which was also a net drag on the three-month change in the leading index. All other components have boosted the index over the three-month period. Growth in the index was robust over the three months ending in February, largely due to rapid expansion in December. Growth slowed in January and February, though it remained positive.
Exports
The three-month moving average of Texas exports climbed for the seventh month in a row in January 2021 (Chart 4). The three-month average of Texas exports to China climbed 4.2 percent in January, while exports to the rest of Asia jumped 9.4 percent. Relative to December, Texas export growth strengthened in January in all major regions except Mexico, led by exports to Asia. Outside of Mexico, Texas exports to the rest of Latin America rose 3.9 percent in January. Texas exports outside the major regions dipped in January.
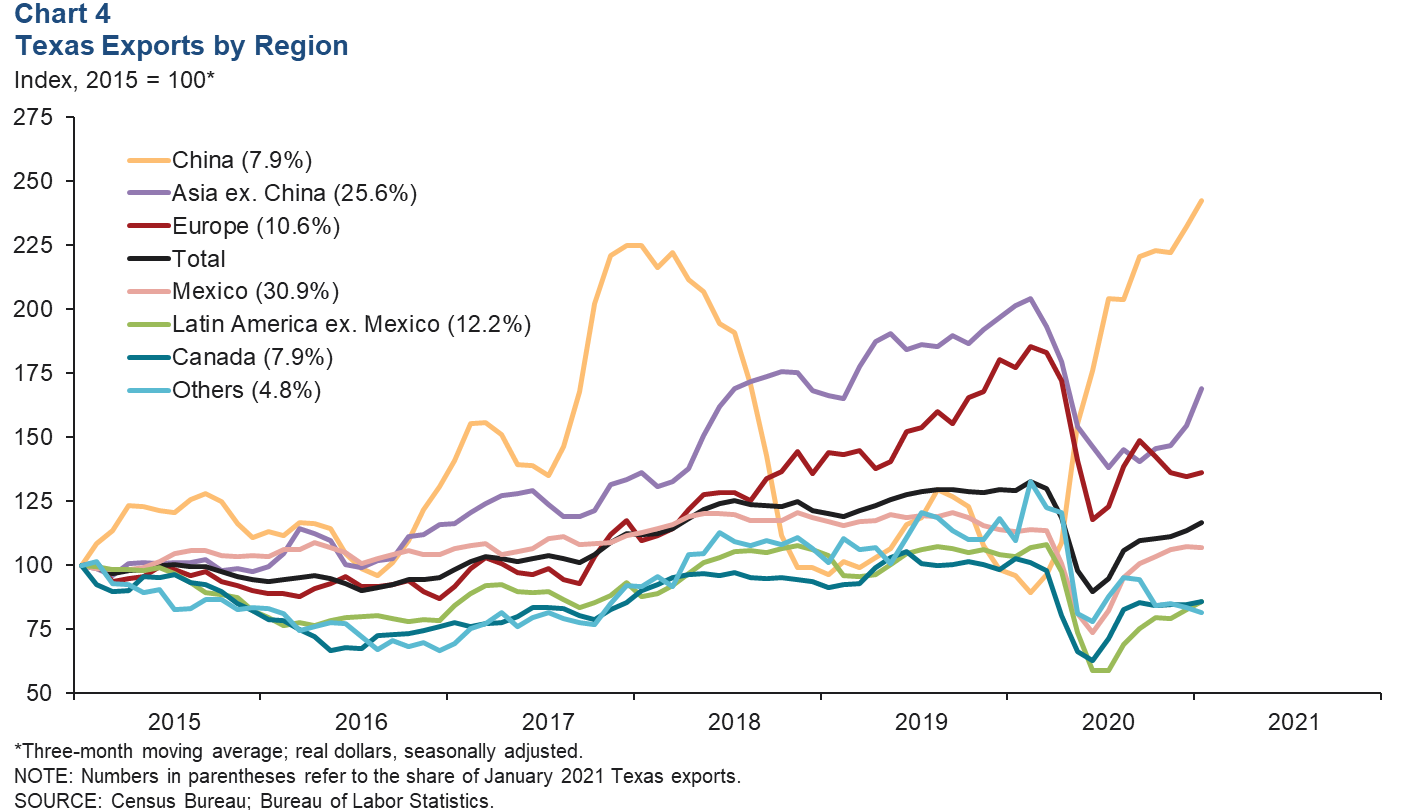
The three-month moving average of U.S. exports also grew in January, most notably exports to Asia excluding China. U.S. exports to several major regions declined in January, including Europe, Canada and Mexico.
Home prices
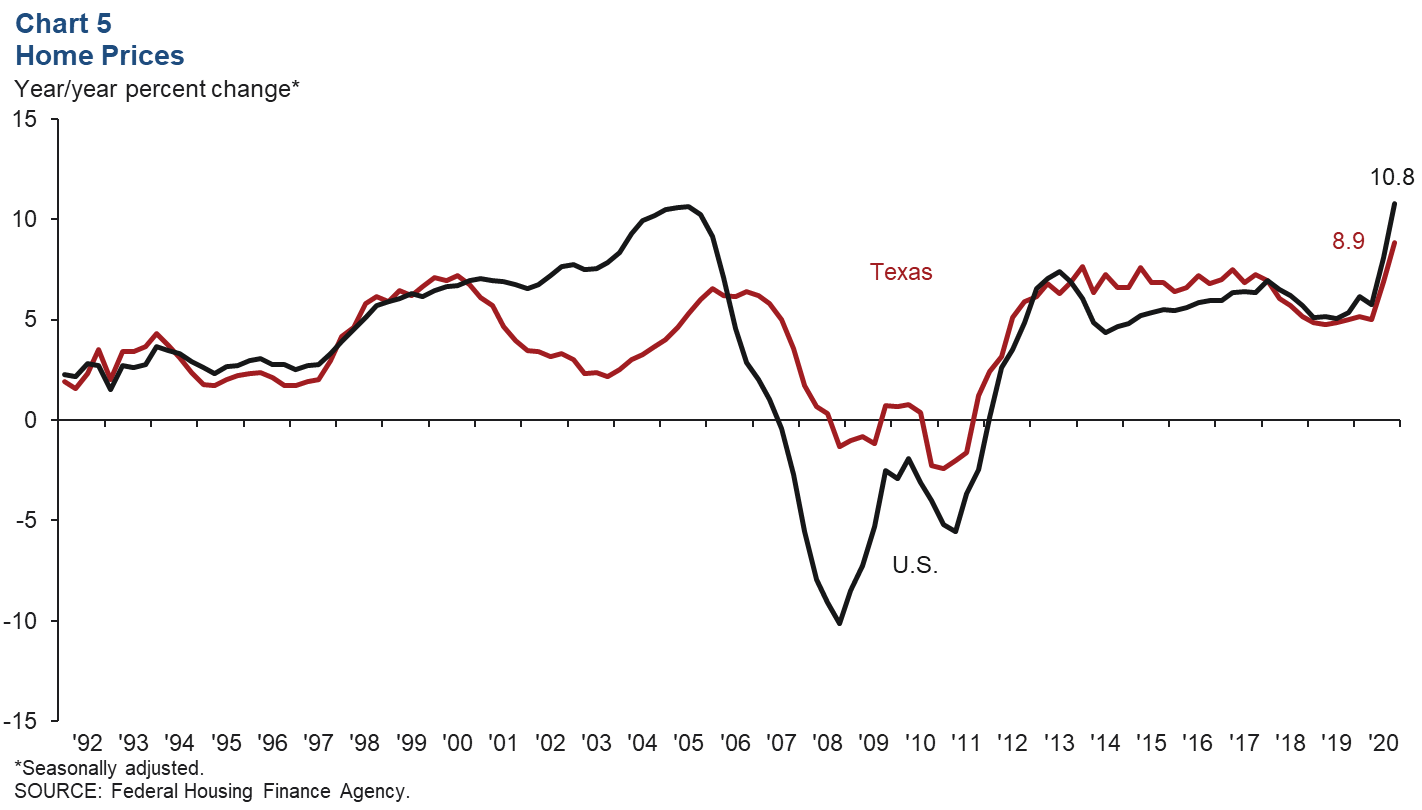
With the onset of the COVID-19 pandemic, the demand for housing soared as inventories remained tight. As a result, home prices saw robust growth last year (Chart 5). Year over year in the fourth quarter, U.S. and Texas home prices grew at record-high rates, surpassing the annual rates seen during the housing boom. Near-term demand is expected to remain solid, which, along with tight inventories and rising material costs, suggests that state and U.S. home prices will likely continue to see rapid increases.
Dining out
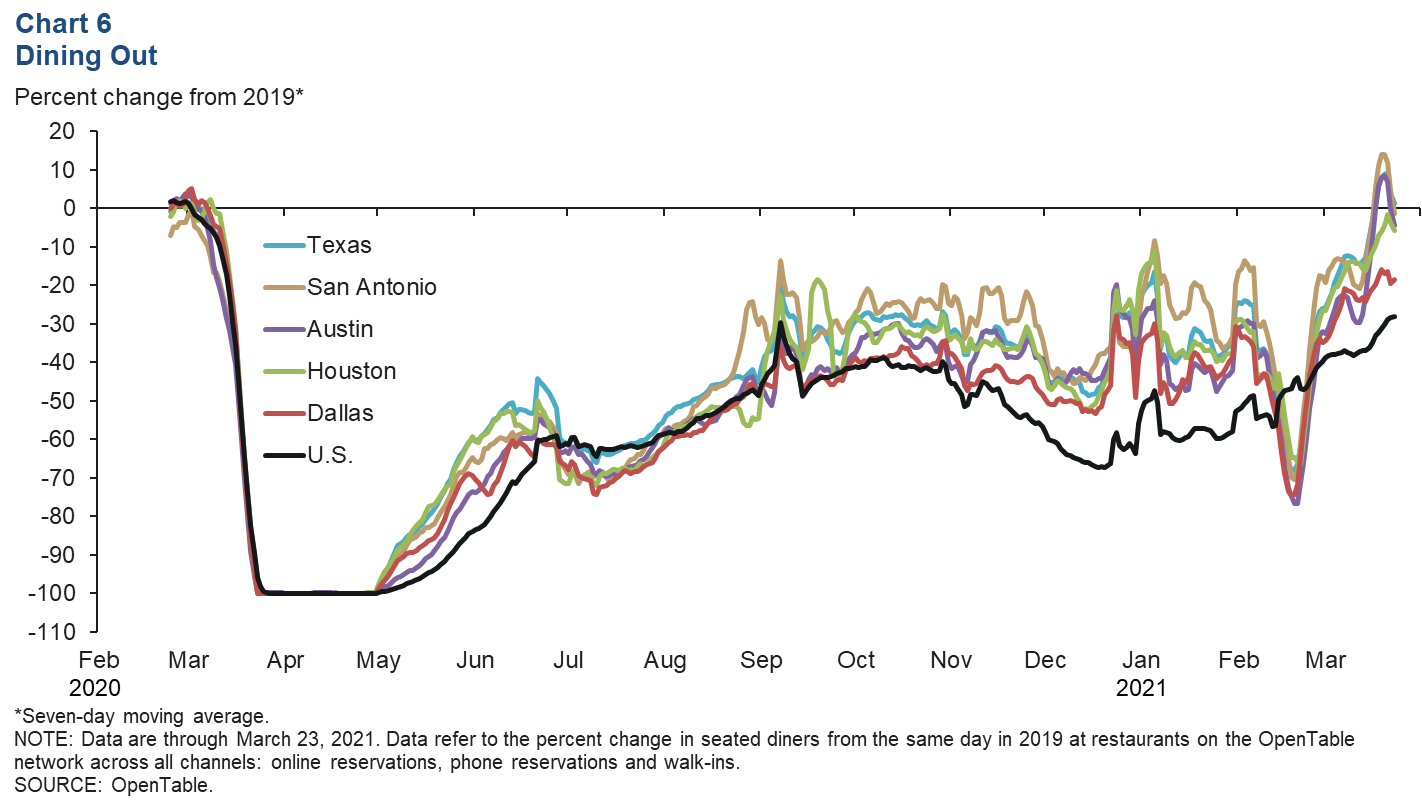
In mid-February, Winter Storm Uri hit Texas, causing residents across the state to stay home and businesses to temporarily close. As a result, the number of Texans dining at restaurants statewide dropped to its lowest level since late May 2020 (Chart 6). Less than a week after the cold snap, restaurant dining recovered to its pre-winter-storm level. On March 10, Texas lifted its mask mandate and restaurant capacity restrictions, and the state surpassed its prepandemic level for seated restaurant dining a week later. While the major metros lag behind Texas in the most recent data, San Antonio and Austin jumped in mid-March, possibly because of increased tourism with schools on spring break.
NOTE: Data may not match previously published numbers due to revisions.
About Texas Economic Indicators
Questions can be addressed to Carlee Crocker at carlee.crocker@dal.frb.org. Texas Economic Indicators is published every month on the Monday after Texas employment data are released.