Texas Economic Indicators

June 23, 2021
The Texas economic recovery continued in May as payroll growth ticked up and the unemployment rate continued to decline. The Texas Business-Cycle Index grew for the 12th month in a row, and Texas Business Outlook Surveys respondents reported solid increases in wages and benefits. Oil prices and the rig count both grew in the week ending June 18. Home prices across the state saw record year-over-year growth in the first quarter.
Labor market
Texas employment growth edges up
Texas employment grew an annualized 2.5 percent in May after upwardly revised growth of 2.2 percent in April (Chart 1). In the first five months of 2021, employment rose 4.0 percent. May job growth in Texas was strongest in leisure and hospitality, which grew 15.1 percent. Growth was also robust for professional and business services, other services and the oil and gas sector. The construction sector shed jobs, though the net change so far this year remains positive. Government payrolls also contracted in May.
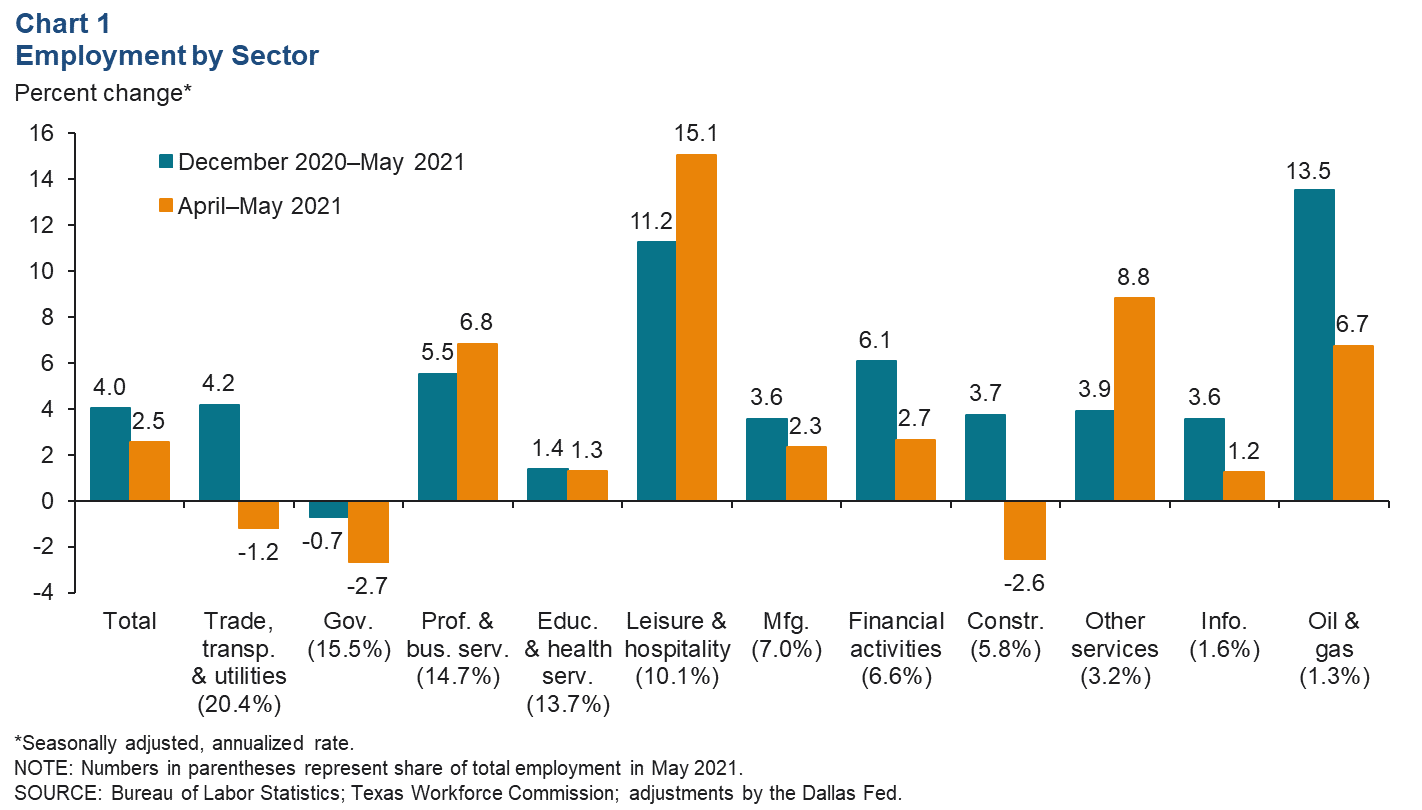
U.S. employment growth more than doubled from April to May, and national payrolls also expanded 4.7 percent in that period.
Texas jobless rate falls further
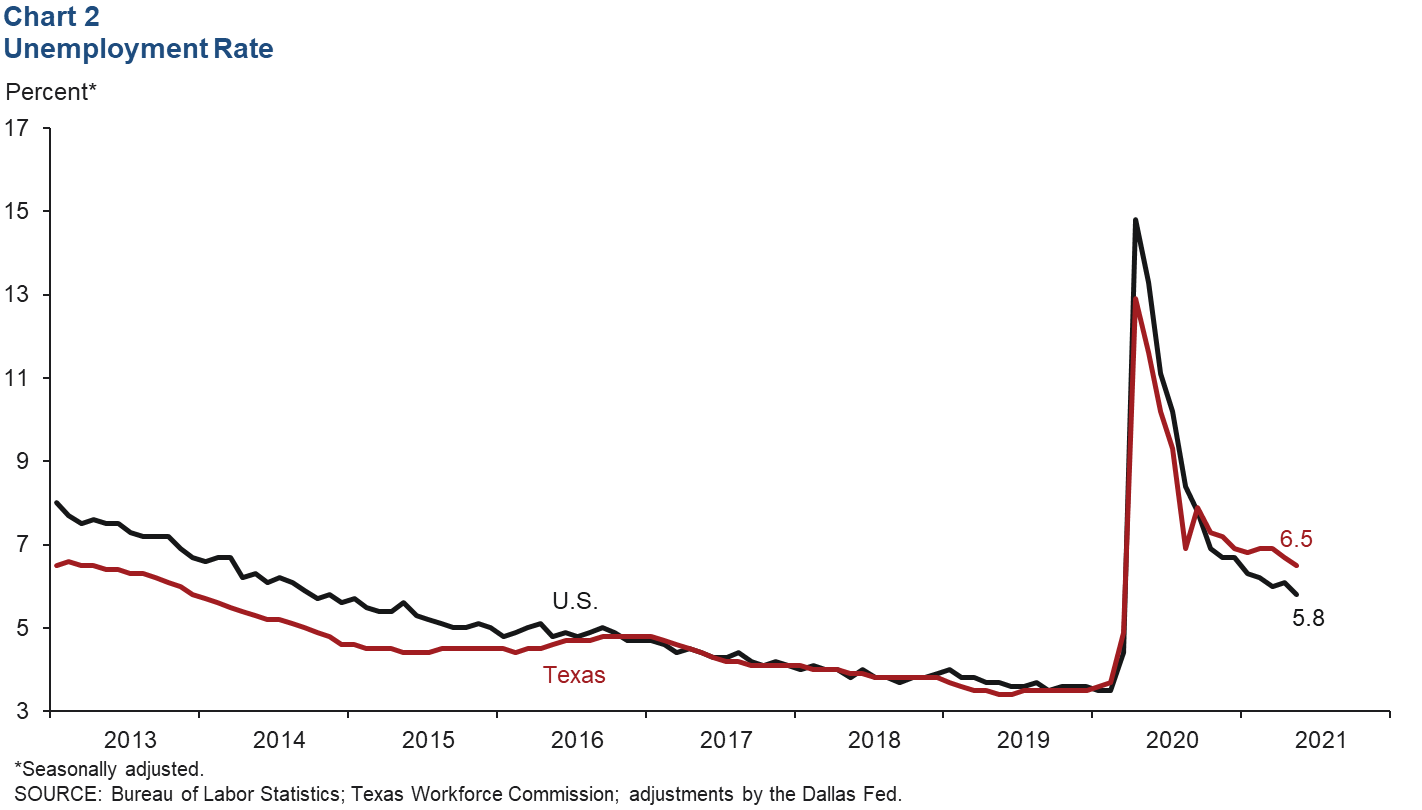
The Texas unemployment rate fell in May to 6.5 percent, its lowest level since the start of the COVID-19 pandemic in March 2020 (Chart 2). The national unemployment rate also declined in May, falling to 5.8 percent. Since September 2020, the national unemployment rate has remained below the state’s rate. Despite high demand for jobs, as evidenced in the May Texas Business Outlook Surveys Special Questions, the unemployment recovery across the state has been sluggish so far this year. Texas initial unemployment claims ticked up in the week ending June 11, suggesting the state’s unemployment rate will remain elevated this month.
Business-cycle index
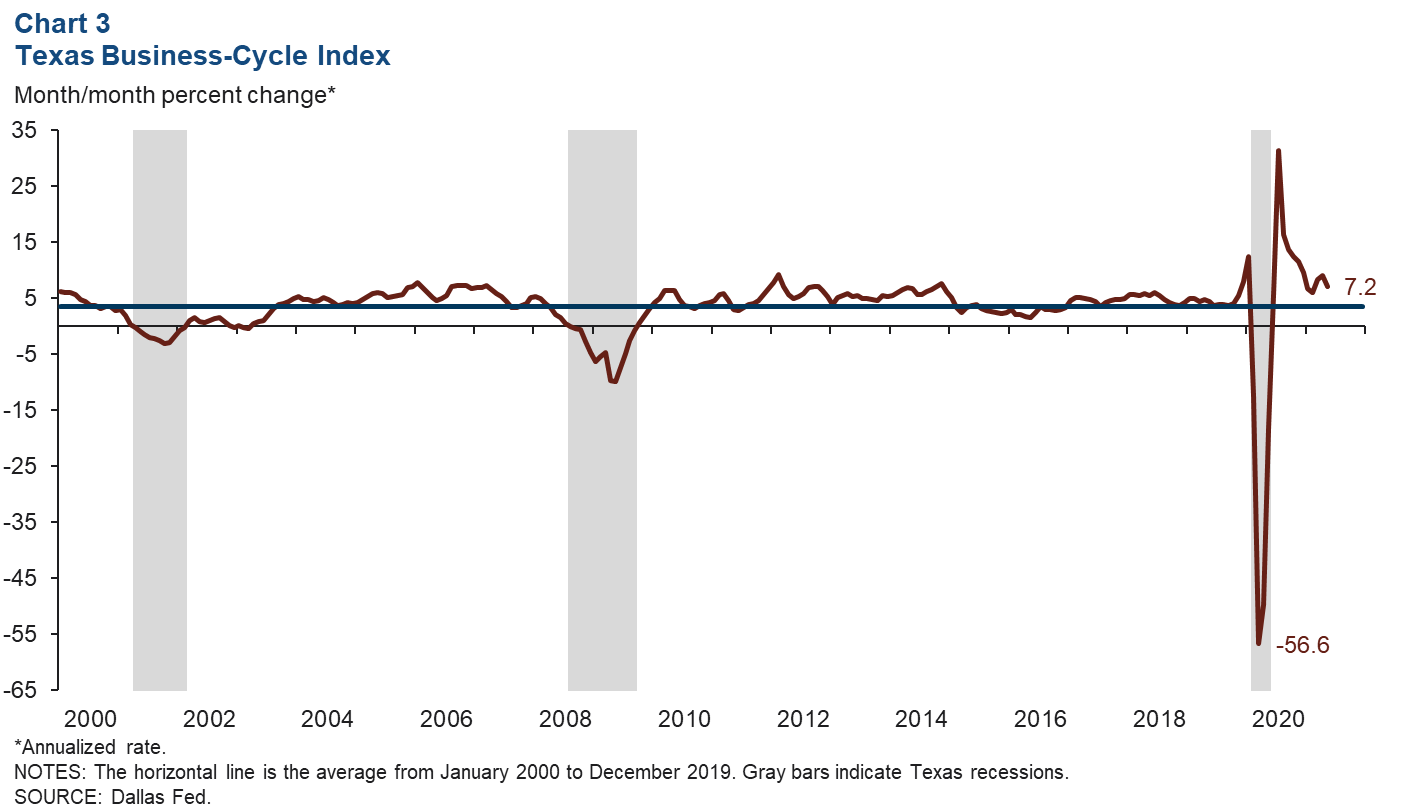
The Texas Business-Cycle Index, a composite of the unemployment rate, state payroll employment and gross state product, measures underlying economic activity in the state. In May, the index climbed an annualized 7.2 percent from April (Chart 3). This is the 12th month the statewide index has shown growth. So far in 2021, the business-cycle index has climbed an annualized 7.5 percent, boosted by strong growth in the last three months. Despite the continued recovery, the May 2021 index reading remains 3.6 percent below prepandemic levels in February 2020.
Texas Business Outlook Surveys
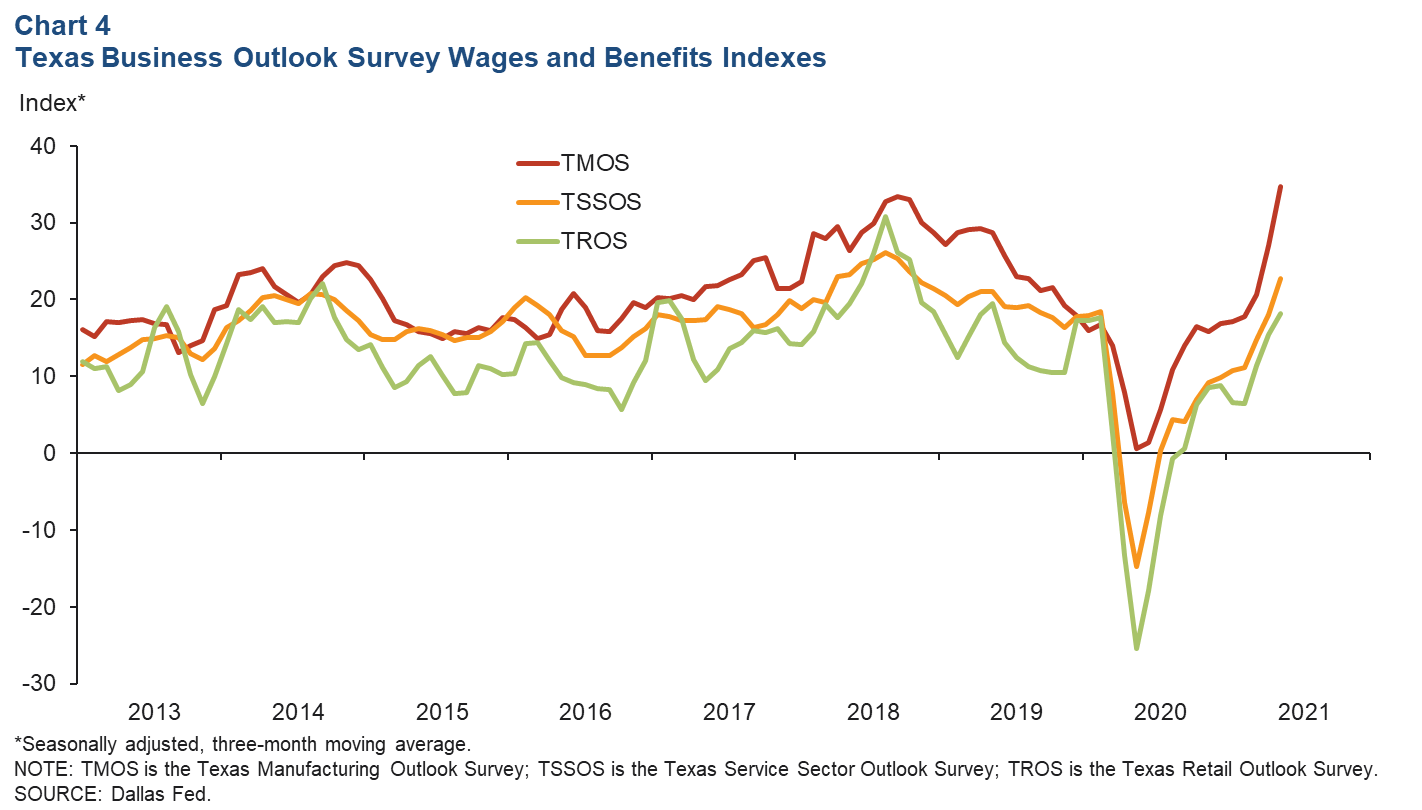
In May, an elevated number of respondents to the Texas Business Outlook Surveys reported increasing wages (Chart 4). Service sector and retail businesses reported healthy growth for the eighth month in a row. The manufacturing index hit its highest reading since the series began in late 2004, signaling record growth in wages across manufacturing firms. The strong growth in wages holds true for other Federal Reserve districts that conduct similar surveys, indicating that the current wage expansion is not unique to Texas.
Energy
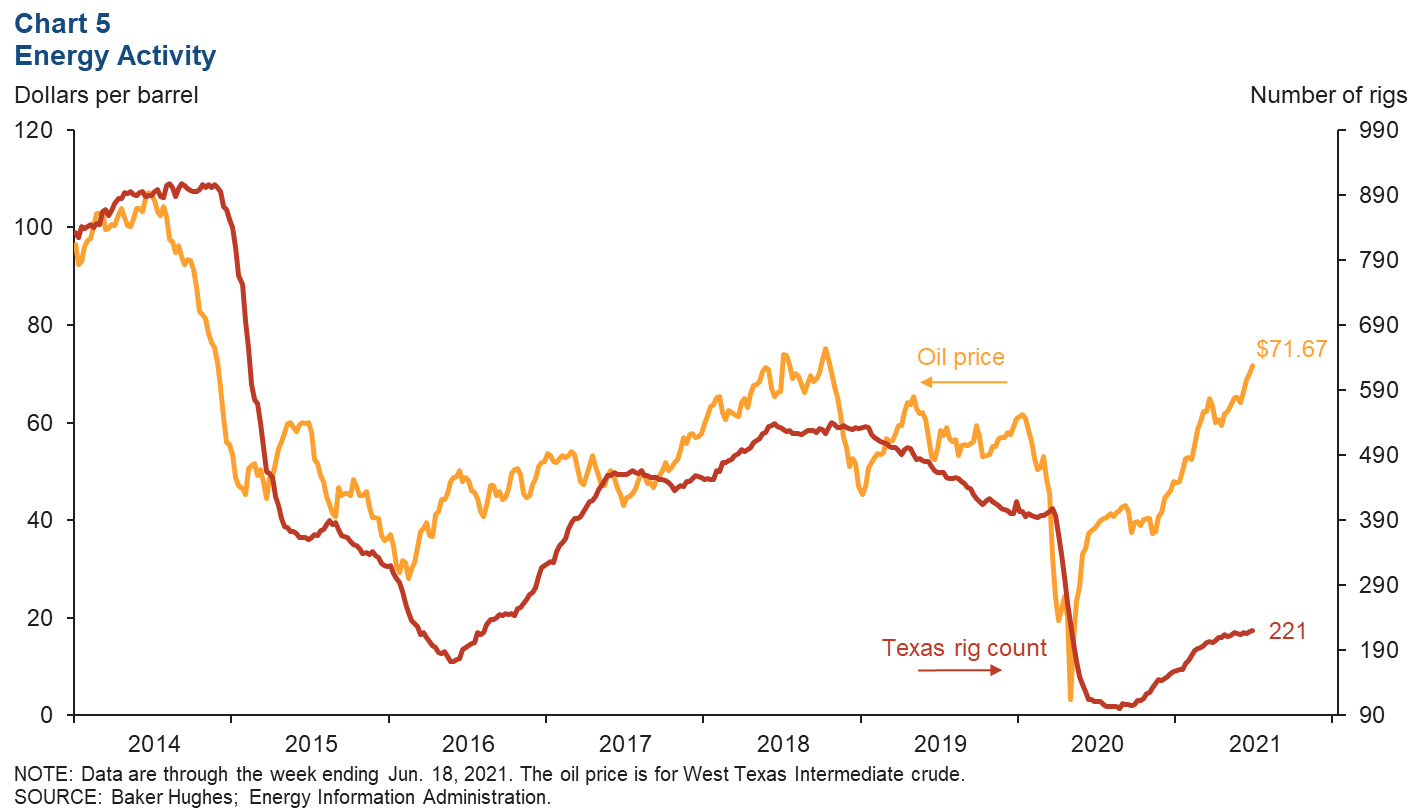
The price of oil has climbed steadily in recent months, as the rig count has continued to creep up (Chart 5). Oil prices dipped in March and April but have since more than recovered that loss. As of the week ending June 18, oil prices were over $70 per barrel, their highest price since October 2018. According to results from the Dallas Fed Energy Survey, the breakeven price needed to profitably drill new wells is $52. Oil prices have been above $52 since mid-January 2021, so it is not surprising to see increases in the rig count. While the number of active rigs in Texas remains 45.8 percent below prepandemic levels, it has more than doubled from its trough last August. Additionally, as rigs become more efficient, fewer are needed to drill wells, so a long-term decline in active rigs is expected.
Home prices
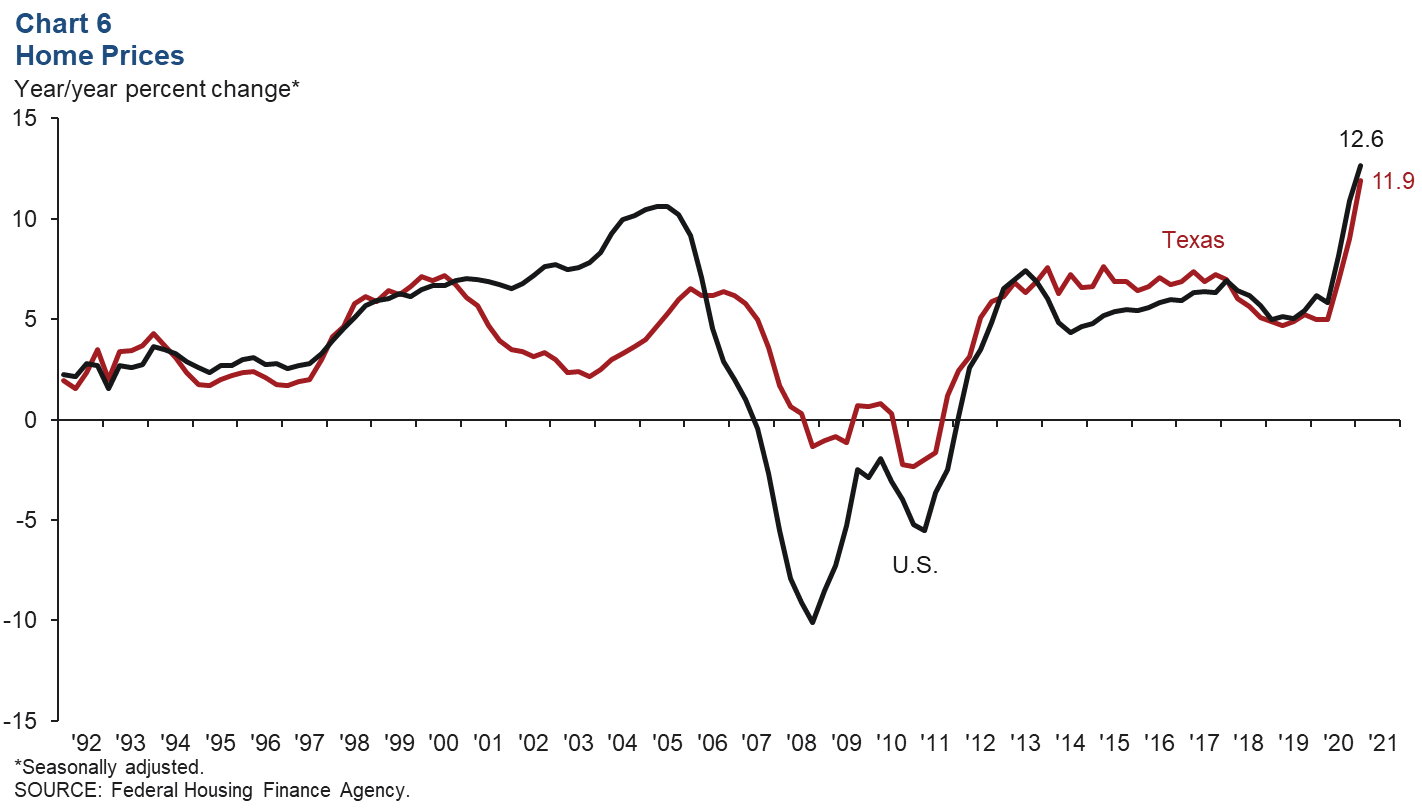
In first quarter 2021, annual home price growth in Texas picked up even further from 2020’s year-end highs (Chart 6). According to the Federal Housing Finance Agency, which produces a repeat sales index that takes into account the size and location of the homes, Texas home prices are growing at a faster rate than they were in the midst of the 2006 housing bubble. This holds true for the nation as well. In fact, annual growth in the state and the nation is at its highest level since both series began in 1991. This rapid rise in prices is due to robust demand and tight inventories, which may continue to drive prices higher through year-end.
NOTE: Data may not match previously published numbers due to revisions.
About Texas Economic Indicators
Questions can be addressed to Carlee Crocker at carlee.crocker@dal.frb.org. Texas Economic Indicators is published every month during the week after state and metro employment data are released.