Texas Economic Indicators

| Texas economy dashboard (April 2026) | |||
| Job growth (annualized) Jan. '26–Apr. '26 |
Unemployment rate |
Avg. hourly earnings |
Avg. hourly earnings growth y/y |
| 1.7% | 4.3% | $34.88 | 1.9% |
The Texas economy expanded in April. Overall, employment grew and the unemployment rate held steady. The May Texas Business Outlook Surveys showed continued expansion in manufacturing and service sector activity. April wages leveled off, while consumer price index (CPI) increased in March.
Labor market
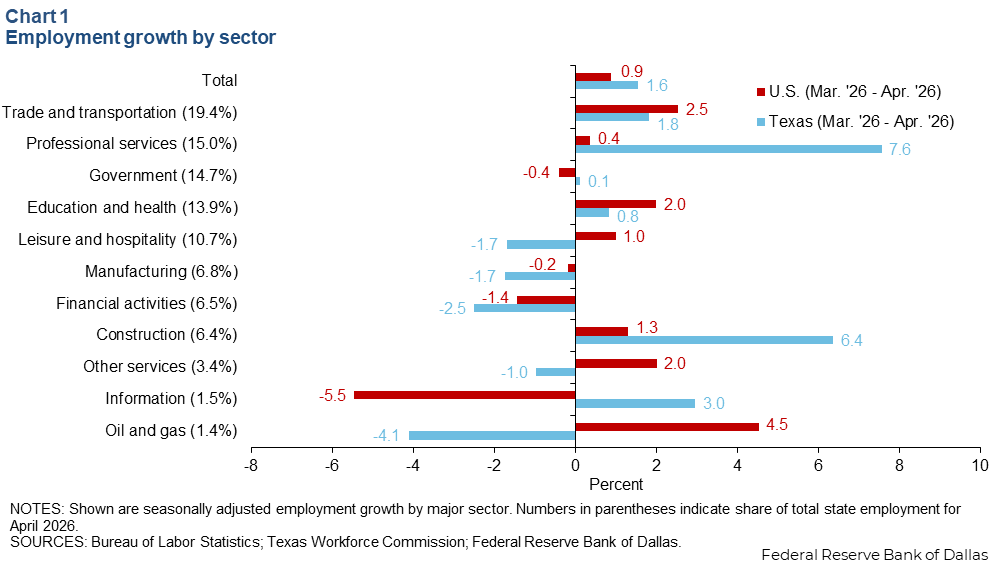
Texas employment growth mixed
Texas employment grew an annualized 1.6 percent in April, exceeding the nation’s 0.9 percent rise (Chart 1). Headcounts increased mainly in the professional and business services, construction, and information sectors, which all expanded faster than the state’s 2 percent historical average pace. Education and health and trade and transportation payrolls grew modestly, while employment in most other major sectors declined. The Dallas Fed’s Texas Employment Forecast is for 1.8 percent job growth in 2026 (December/December), though slowing labor force growth, higher productivity and heightened geopolitical uncertainty may constrain job growth to the lower end of the forecast’s confidence band, around 1.2 percent.
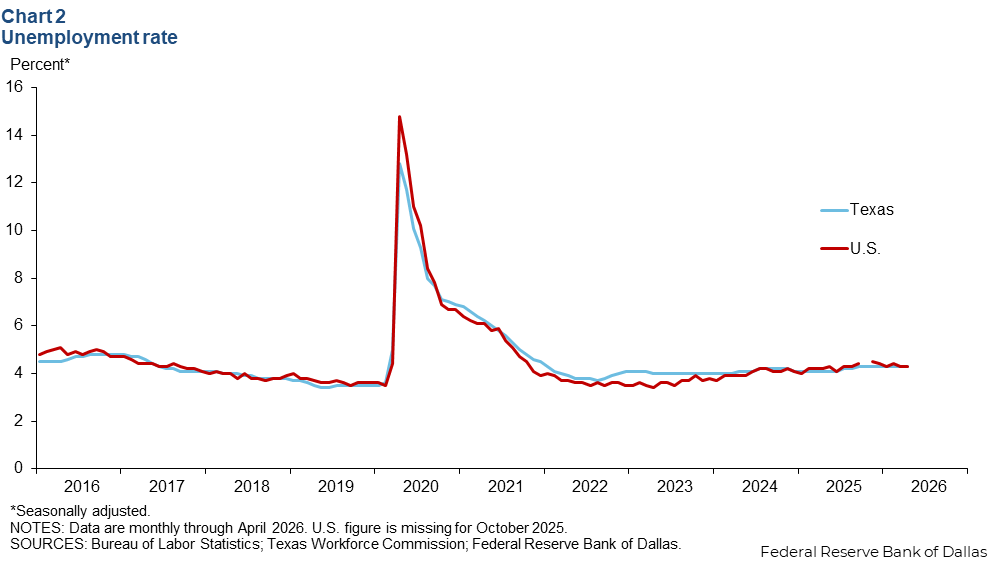
Unemployment flat
In April, the Texas unemployment rate remained at 4.3 percent for the eighth straight month (Chart 2). The nation’s jobless rate was also 4.3 percent in April. Moreover, the U6 unemployment rate, the broadest measure of unemployment that includes those who are underemployed, marginally attached to the labor force and discouraged workers, rose in Texas from 7.7 percent in March to 8.0 percent in April and the national rate edged up from 8.0 percent to 8.2 percent over the same period.
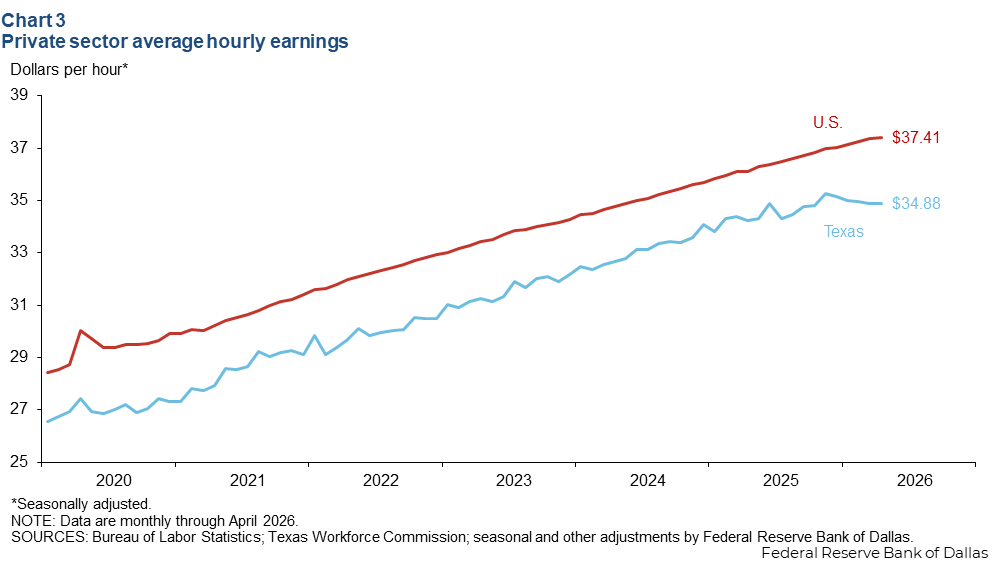
Wages flat in April, but up from last year
In April, Texas private hourly earnings grew 1.9 percent over the last 12 months to $34.88 per hour, while the nation’s hourly earnings rose 3.6 percent to $37.41 per hour over the same period (Chart 3). Since November, however, Texas’ hourly earnings have been flat to down.
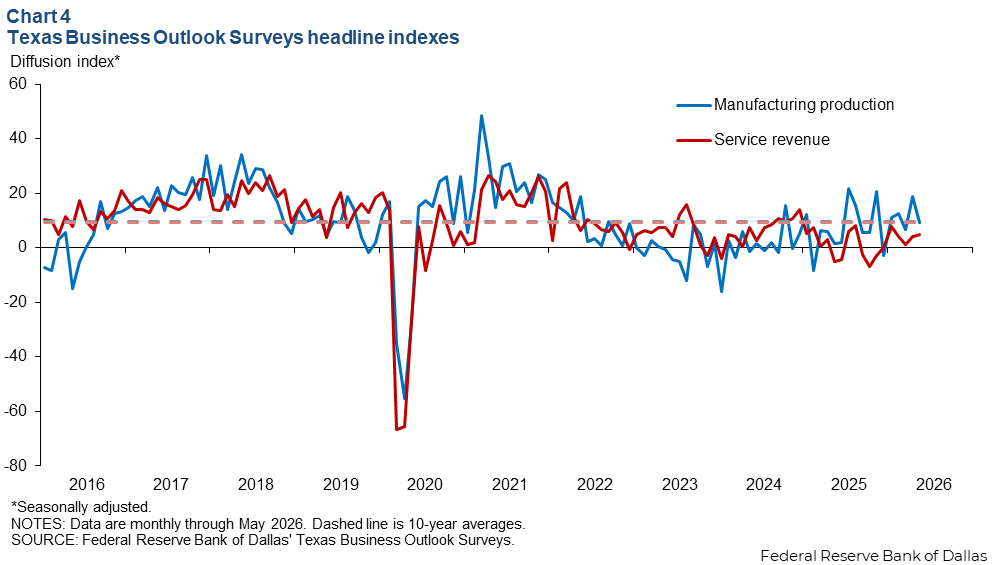
Texas Business Outlook Surveys
The May Texas Business Outlook Surveys indicated a slowing pace of expansion in manufacturing output and continued modest growth in the service sector (Chart 4). The Texas Manufacturing Outlook Survey headline index fell 10 points to 9.4, coming in line with its long-term average and suggesting a slower but still average pace of growth. Meanwhile, the Texas Service Sector Outlook Survey headline index ticked up to 5.0, a reading indicative of a below average pace of growth.
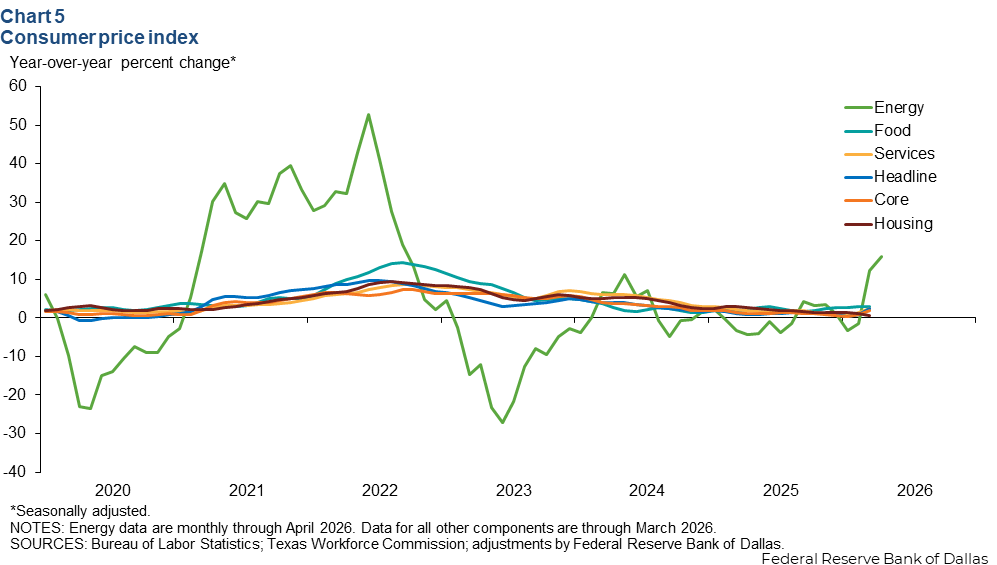
Consumer price index
The 12-month change in Texas’ headline CPI and its components accelerated in March, driven primarily by rising energy prices due to the conflict in the Middle East (Chart 5). March headline CPI and core CPI grew 2.4 percent and 1.9 percent, respectively, while energy CPI climbed 16 percent year over year in April. The 12-month change in services ticked up to 2.4 percent in March, while the increase in food held steady at 2.9 percent and growth in the housing component ticked down to 0.6 percent.
NOTE: Data may not match previously published numbers due to revisions.
About Texas Economic Indicators
Questions or suggestions can be addressed to Diego Morales-Burnett. Texas Economic Indicators is published every month the week after Texas employment data are released.