Texas Economic Indicators

| Texas economy dashboard (May 2026) | |||
| Job growth (annualized) Feb. '26–May '26 |
Unemployment rate |
Avg. hourly earnings |
Avg. hourly earnings growth y/y |
| 2.3% | 4.3% | $35.32 | 3.0% |
The Texas economy expanded in May. Overall, employment grew and the labor force expanded modestly. The June Texas Business Outlook Surveys showed continued expansion in wages and benefits. Exports rose in April, while the Texas Leading Index ticked down in May.
Labor market
Texas employment growth mixed
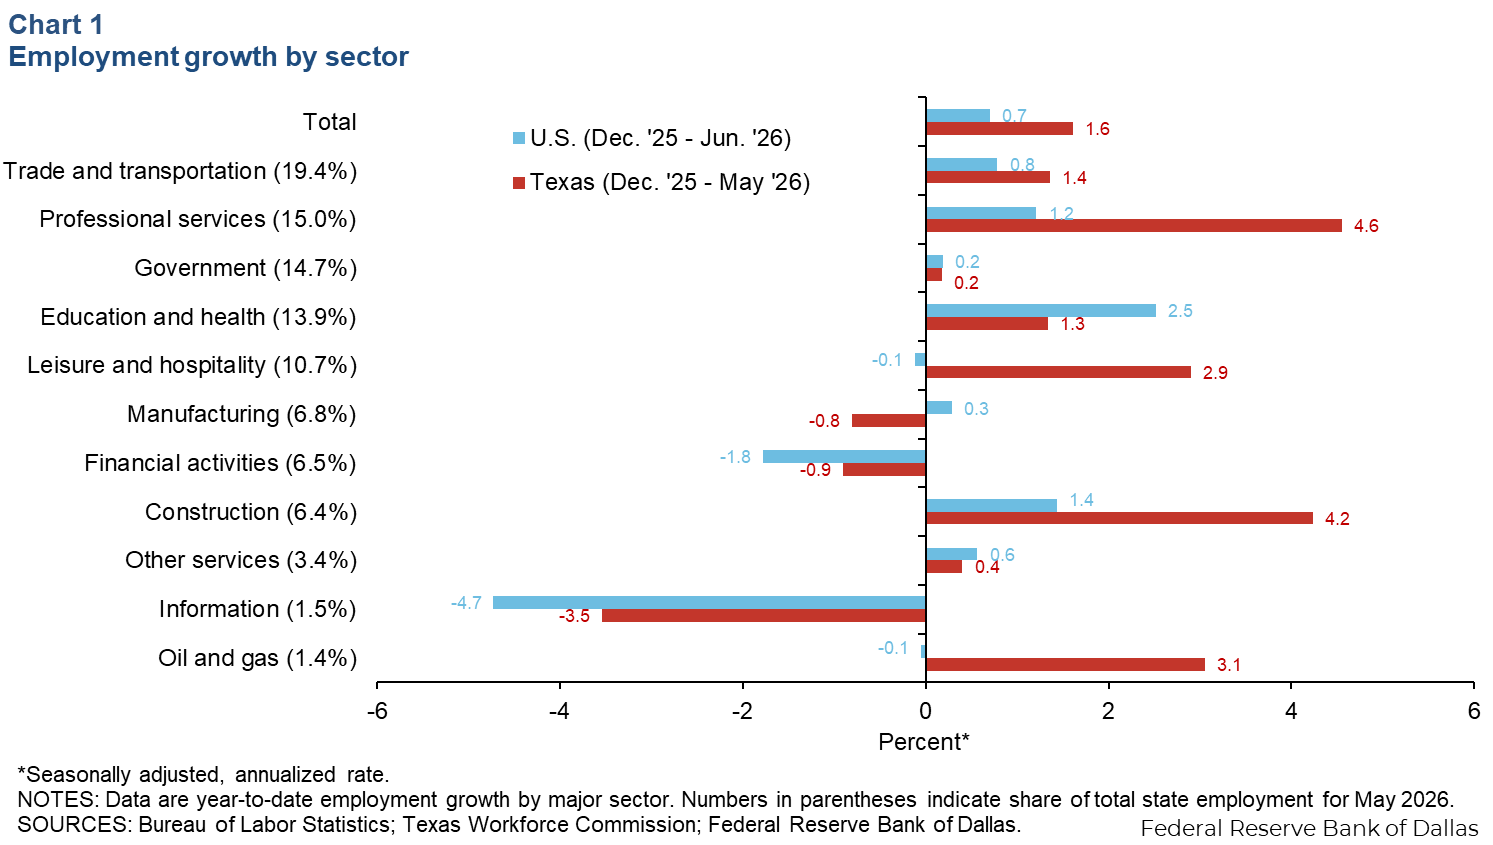
Texas employment grew an annualized 1.2 percent (14,400 jobs) in May. On a year-to-date basis, Texas headcounts were up 1.6 percent, exceeding the nation’s 0.7 percent growth (Chart 1). Headcounts increased in professional and business services, leisure and hospitality, construction, trade and transportation, and oil and gas. Employment in information, financial activities and manufacturing declined. The Dallas Fed’s Texas Employment Forecast indicates 1.8 percent job growth in 2026 (December/December).
Labor force growth sluggish
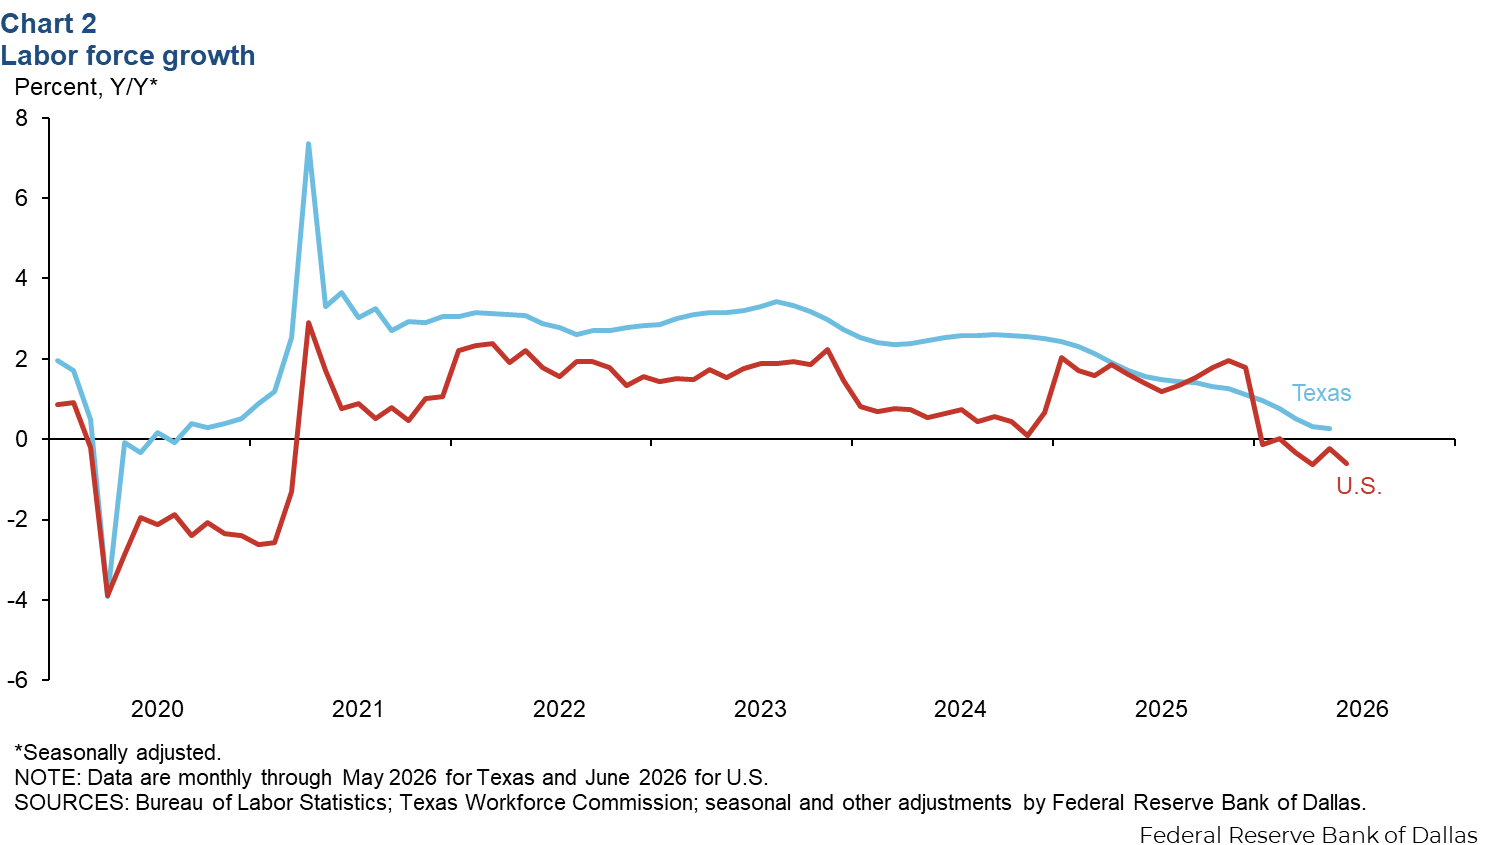
The Texas labor force ticked up 0.5 percent in May. The 12-month growth rate has been slowing in Texas since August 2023, but remained slightly positive at 0.3 percent in May, exceeding the nation’s 0.6 percent year-over-year decline in June (Chart 2). A growing labor force is critical for a healthy economy, because more workers support greater production of goods and services, while higher tax revenue helps sustain government programs and offset costs.
Texas Business Outlook Surveys
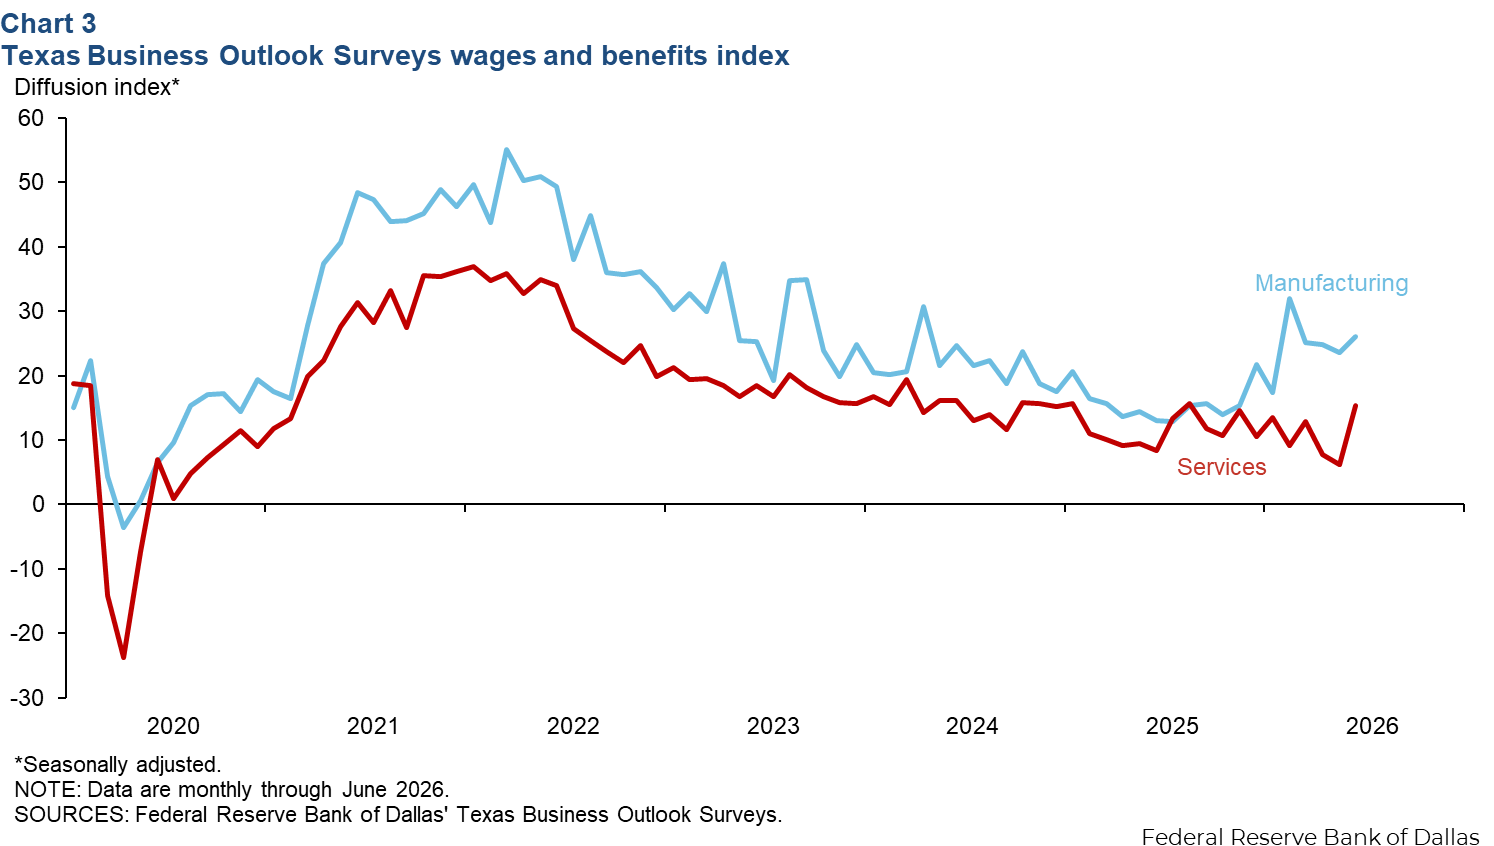
The Texas Business Outlook Surveys indicated solid growth in wages and benefits in June (Chart 3). The manufacturing survey’s wages and benefits index edged up to 26.0 in June, remaining above its series average. The service sector’s wages and benefits index climbed nine points to 15.3 and is now in line with its series average.
Exports
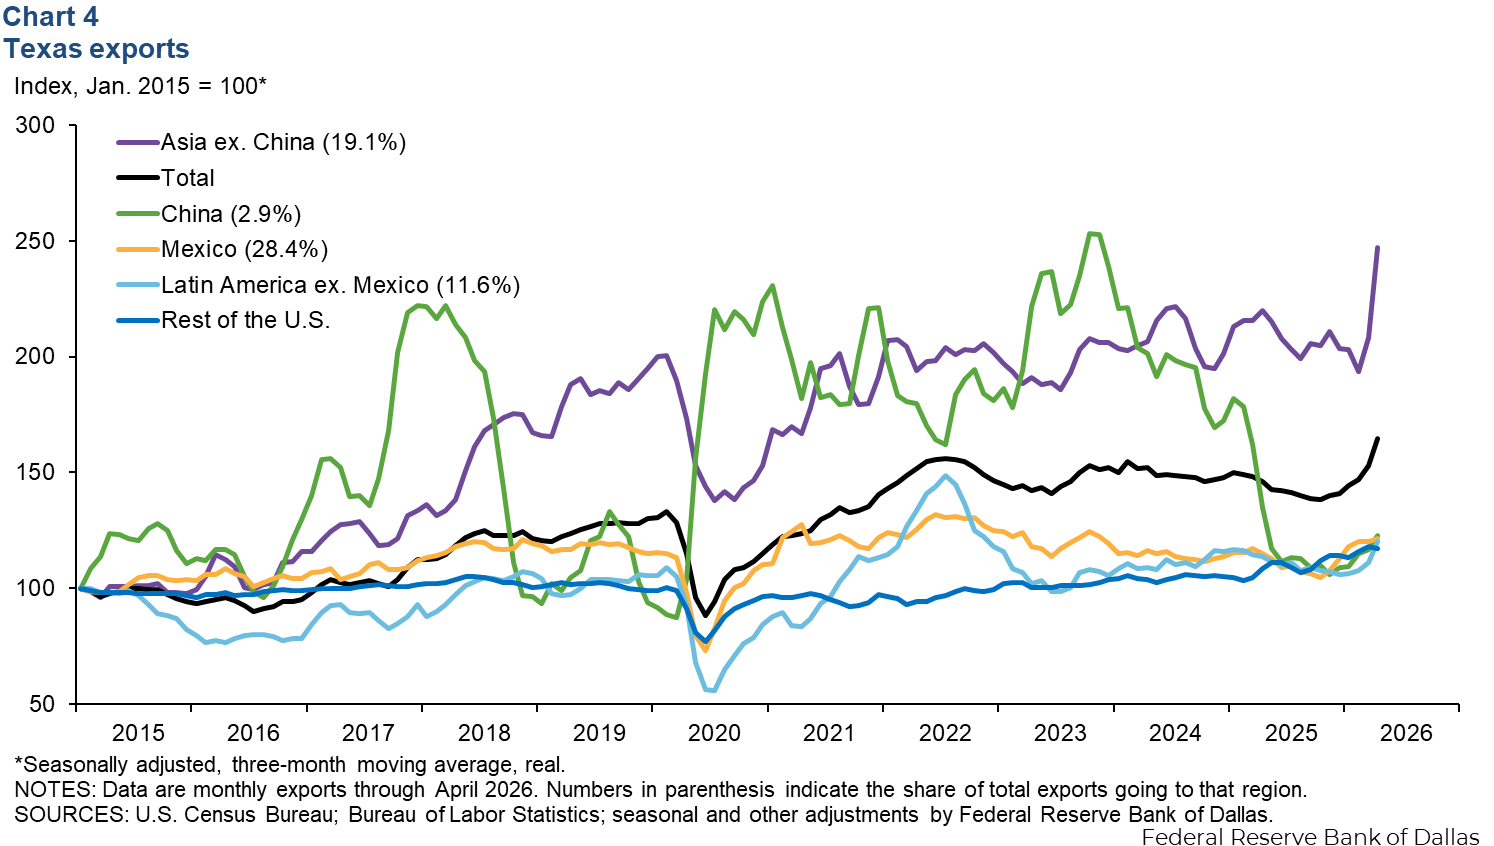
In April, the three-month moving average of Texas exports rose 7.7 percent, whereas exports from the rest of the U.S. ticked down 0.8 percent (Chart 4). The three-month moving average of Texas exports to China rose 5.2 percent, while exports to Asia (excluding China) increased 18.5 percent. Exports to Mexico, the state’s largest trading partner, edged up 1.2 percent, and exports to Latin America (excluding Mexico) grew 7.9 percent. Higher energy prices are mainly driving the recent increases in Texas exports.
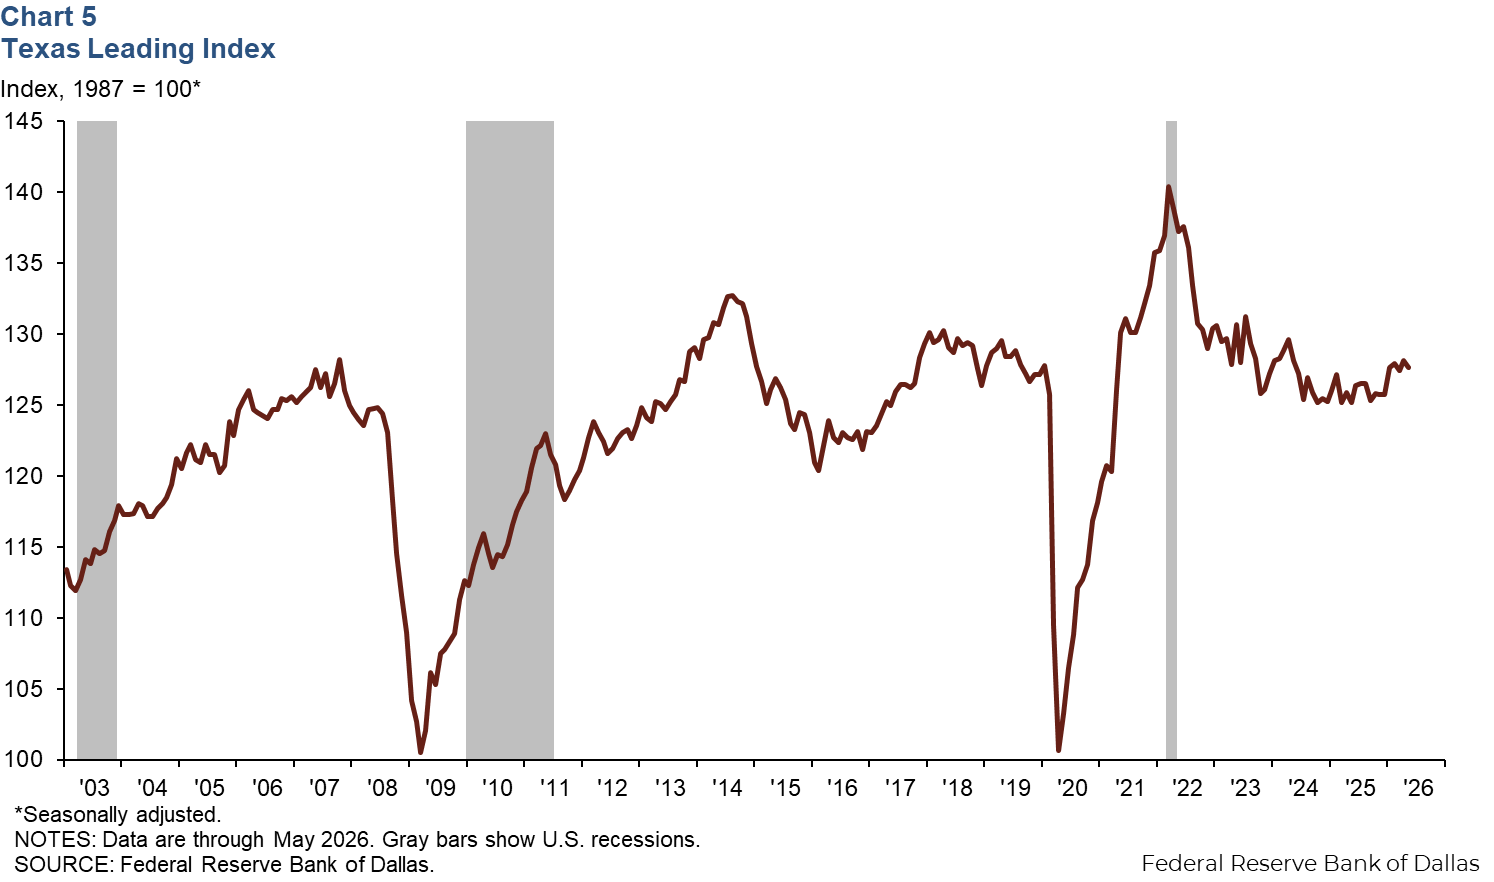
Texas Leading Index
The Texas Leading Index, a composite of eight leading indicators that sheds light on the future of the state’s economy, ticked down in May (Chart 5). The three-month change was negative as well, with several components dragging on the index, particularly a strong decline in average weekly hours worked.
NOTE: Data may not match previously published numbers due to revisions.
About Texas Economic Indicators
Questions or suggestions can be addressed to Diego Morales-Burnett. Texas Economic Indicators is published every month the week after Texas employment data are released.