Texas Economic Indicators

| Texas economy dashboard (June 2026) | |||
| Job growth (annualized) Mar. '26–Jun. '26 |
Unemployment rate |
Avg. hourly earnings |
Avg. hourly earnings growth y/y |
| 2.4% | 4.4% | $35.63 | 2.7% |
The Texas economy expanded in June. Overall, employment grew in the state and across metros, yet unemployment ticked up. The July Texas Business Outlook Surveys showed continued rising input prices. Housing activity ticked up in June.
Labor market
Texas employment growth mixed
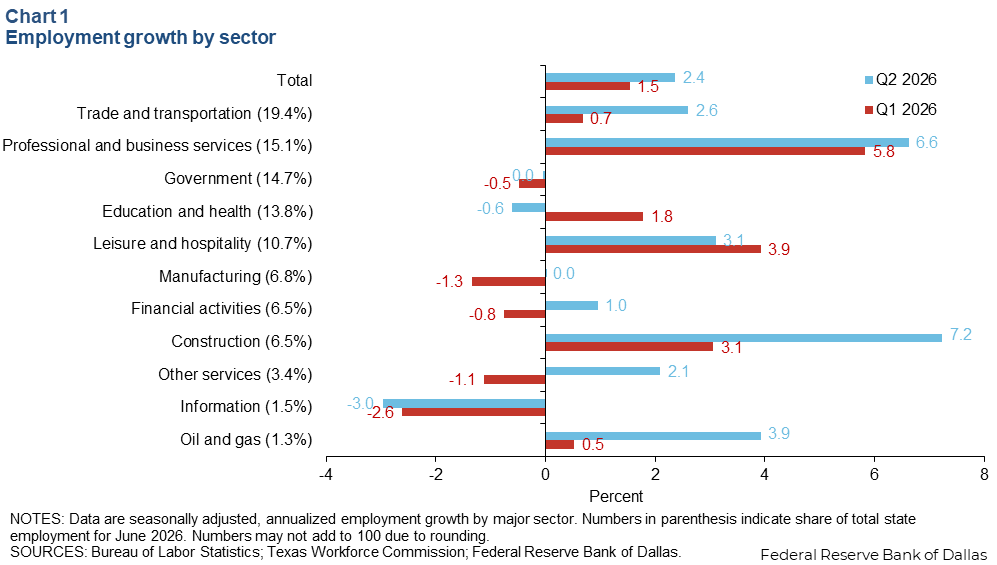
Texas employment grew an annualized 3.5 percent in June (42,000 jobs) after expanding 1.3 percent in May. Payrolls expanded an annualized 2.4 percent in the second quarter, ahead of first-quarter growth of 1.5 percent (Chart 1). Employment in construction, professional and business services, leisure and hospitality, and oil and gas grew more than 3 percent in the second quarter, while employment declined in education and health and information. Employment in remaining sectors grew moderately or was flat. The Dallas Fed’s Texas Employment Forecast was revised up to 2.0 percent in 2026 (December/December).
Texas unemployment ticks up
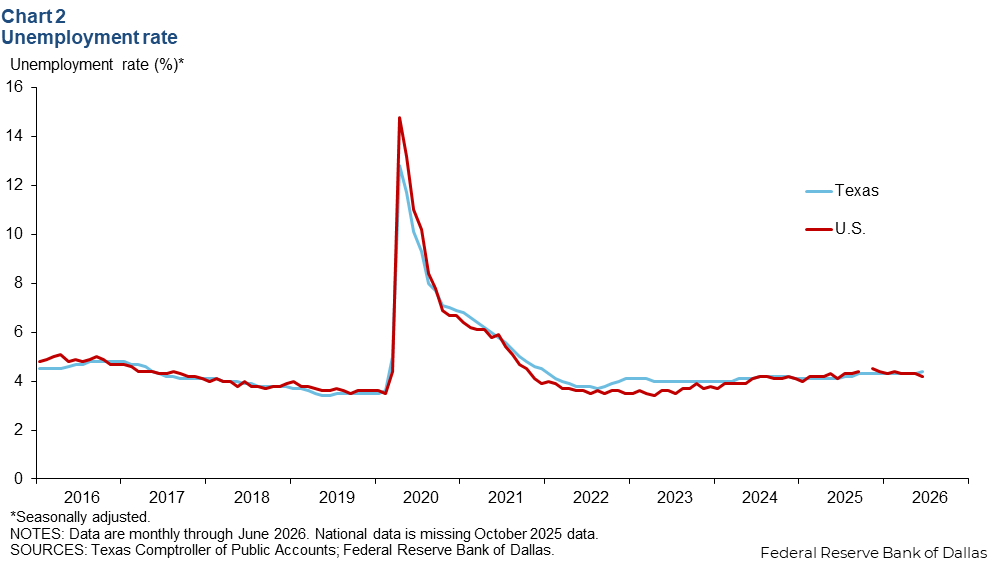
In June, the Texas unemployment rate ticked up to 4.4 percent, after holding steady for nine straight months (Chart 2). The nation’s jobless rate ticked down to 4.2 percent in June. Though employment grew, the unemployment rate can increase due to changes in the labor force. The Texas labor force increased slightly in May and June, after declining for five consecutive months.
Fort Worth leads major metros in year-to-date job growth
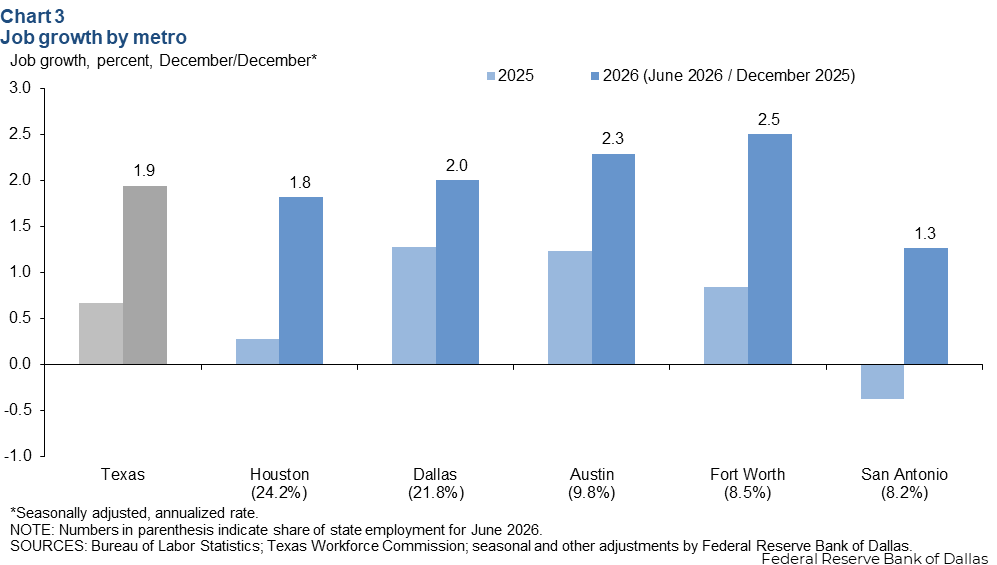
Job gains in June were solid across Texas major metros. Employment in Austin, Dallas and Fort Worth grew strongly. Job growth in Houston was slower than the state average, while employment in San Antonio declined. Year to date, Fort Worth leads with annualized job growth of 2.5 percent, followed by Austin at 2.3 percent and Dallas at 2.0 percent. Employment grew 1.8 percent in Houston and 1.3 percent in San Antonio, slower than the state’s 1.9 percent increase (Chart 3).
Texas Business Outlook Surveys
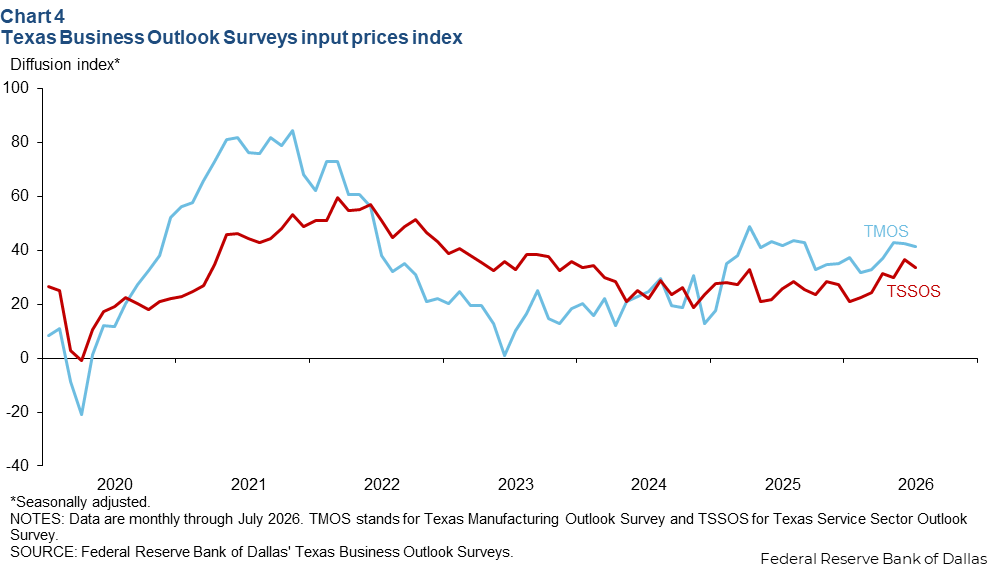
The Texas Business Outlook Surveys indicated continued elevated input price pressures in July (Chart 4). The manufacturing sector’s input prices index was little changed at 41.3. The service sector’s input prices index dipped to 33.5, but remained in solidly positive territory. Both indexes are above their series average, indicating elevated input price pressures.
Housing
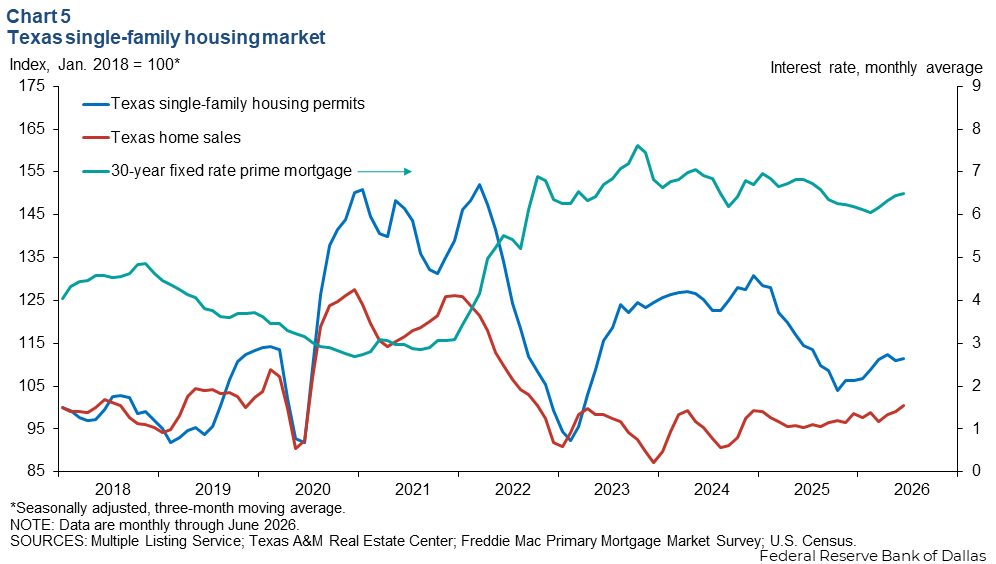
Texas existing-home sales grew in June. The three-month moving average of existing-home sales rose 1.2 percent, and the three-month moving average of single-family housing construction permits ticked up 0.4 percent (Chart 5). In June, mortgage rates remained elevated at 6.5 percent, continuing to impact housing affordability. Although the spring and summer seasons tend to be the busiest time for the housing market, falling consumer confidence along with elevated home prices and mortgage rates likely held back potential buyers from making large purchases.
NOTE: Data may not match previously published numbers due to revisions.
About Texas Economic Indicators
Questions or suggestions can be addressed to Dylan Council. Texas Economic Indicators publishes monthly after Texas employment data are released.