Texas Economic Indicators

| Texas economy dashboard (August 2026) | |||
| Job growth (annualized) May '26–August '26 |
Unemployment rate |
Avg. hourly earnings (smoothed)* |
Avg. hourly earnings growth y/y (smoothed)* |
| 1.6% | 4.4% | $36.01 | 4.5% |
The Texas economy continued to expand in August. Employment rose, the unemployment rate ticked down and wages increased. The September Texas Business Outlook Surveys indicated growth in manufacturing production but flat service sector activity. Total loan volumes expanded in September, but growth across loan categories was mixed. Housing market activity remained weak, with sales and permits falling in August.
Labor market
Employment expansion broad-based
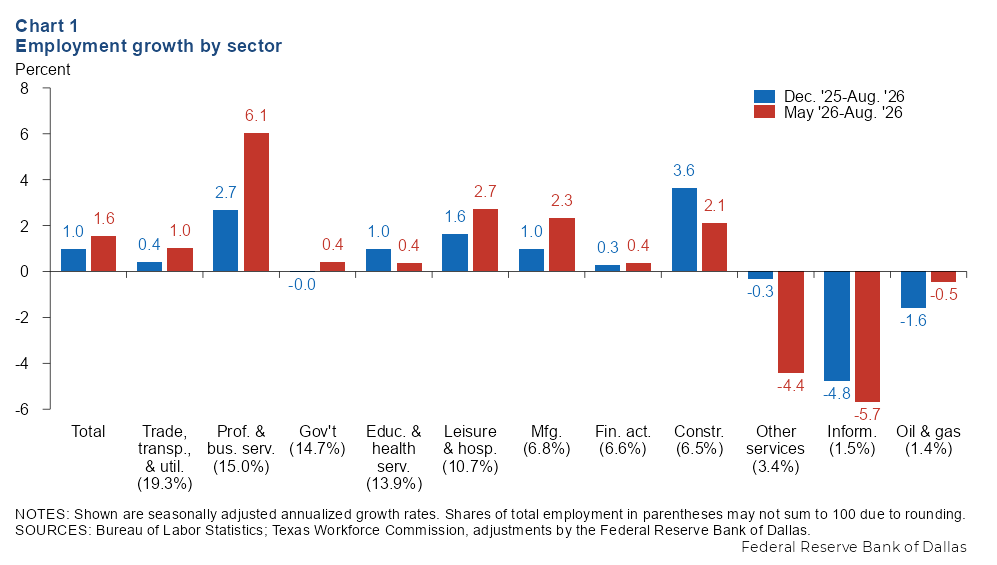
Texas employment grew an annualized 1.6 percent (18,500 jobs) in August. Payrolls rose an annualized 1.6 percent from May to August, with the three-month job growth led by professional and business services, leisure and hospitality, and manufacturing (Chart 1). Employment declined in information, other services, and oil and gas. Year-to-date employment in Texas is up an annualized 1.0 percent. The Federal Reserve Bank of Dallas Texas Employment Forecast for 2026 was revised down to 1.2 percent.
Texas unemployment rate declines
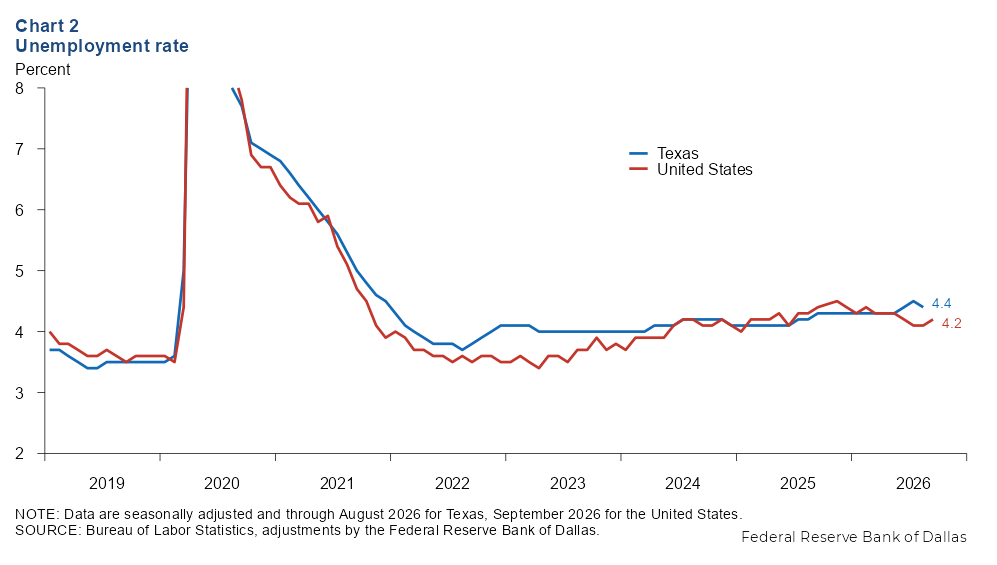
The Texas unemployment rate ticked down to 4.4 percent in August (Chart 2). The nation's jobless rate was lower at 4.2 percent in September. Texas' labor force grew an annualized 1.3 percent in August but was nearly unchanged from August 2025.
Wages increase
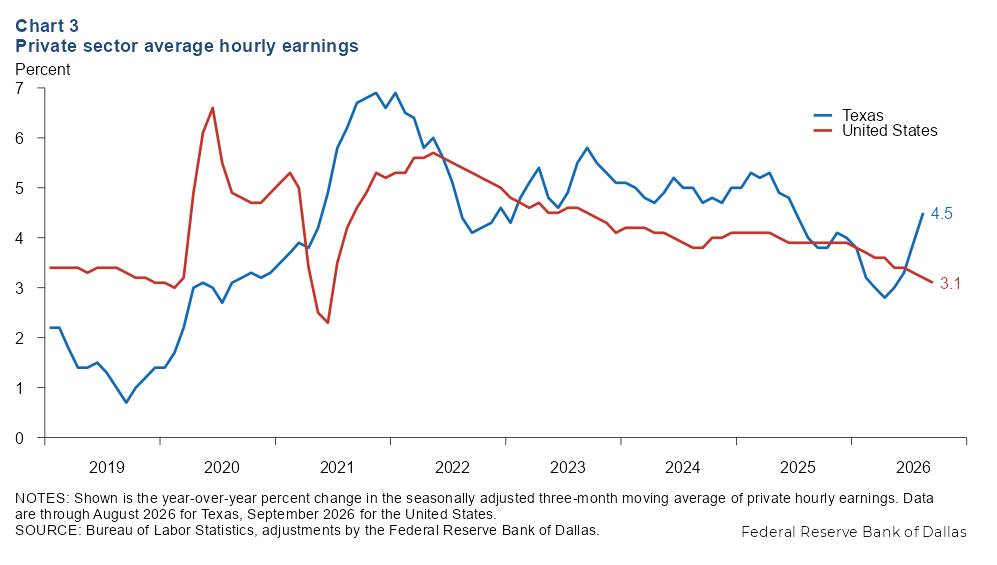
The three-month moving average of nominal hourly wages in Texas increased to $36.01 in August. Year over year, Texas wages grew 4.5 percent in August, faster than the 3.1 percent rise nationally in September (Chart 3). Wages in Texas are lower than the national average ($37.73).
Texas Business Outlook Surveys
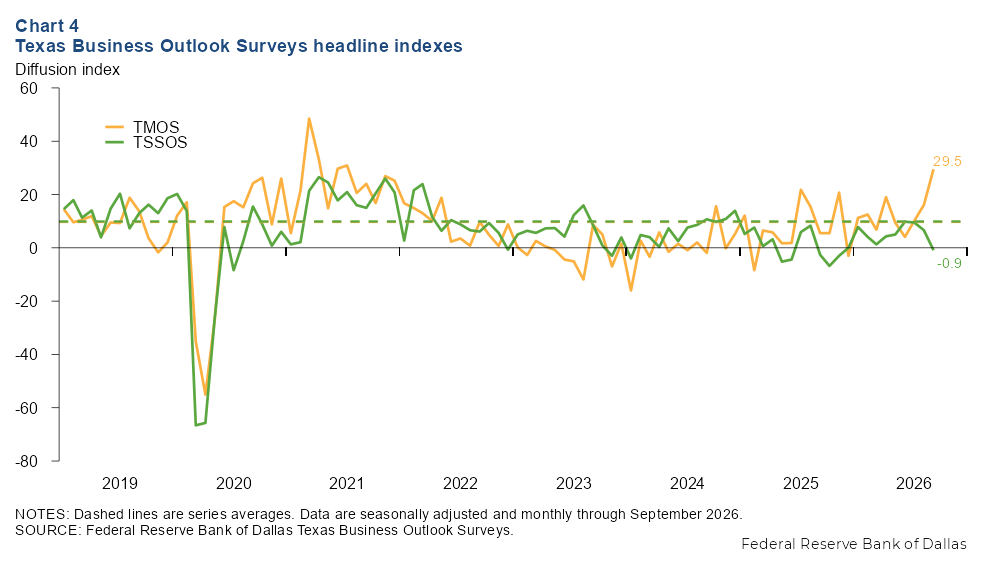
The September Texas Business Outlook Surveys indicated continued strong expansion in manufacturing output but flat service sector activity. The Texas Manufacturing Outlook Survey headline index rose to 29.5—well above the series average of 9.7—indicating robust growth (Chart 4). The Texas Service Sector Outlook Survey headline index declined to -0.9, with the near-zero reading suggesting no change in activity in September.
Banking Conditions Survey
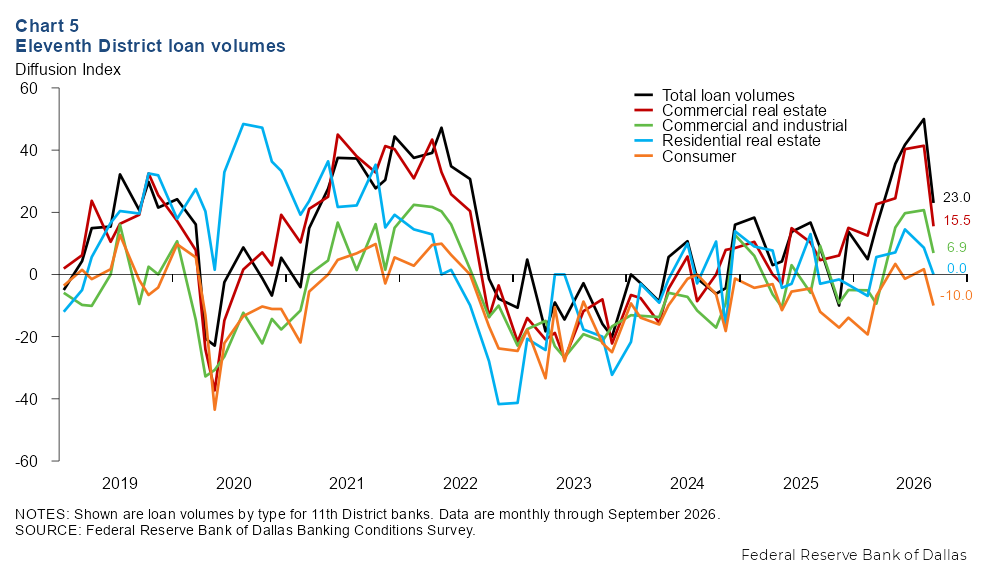
The Federal Reserve Bank of Dallas Banking Conditions Survey suggested a slower pace of expansion in loan volumes in September. The total loan volume index fell from a series high of 50 to 23, remaining in positive territory and indicative of growth (Chart 5). The commercial and industrial and commercial real estate loan indexes remained positive, while the residential real estate index was neutral and the consumer loan index turned negative. Survey respondents expect declines in loan demand and business activity and further deterioration in loan performance over the next six months.
Housing market
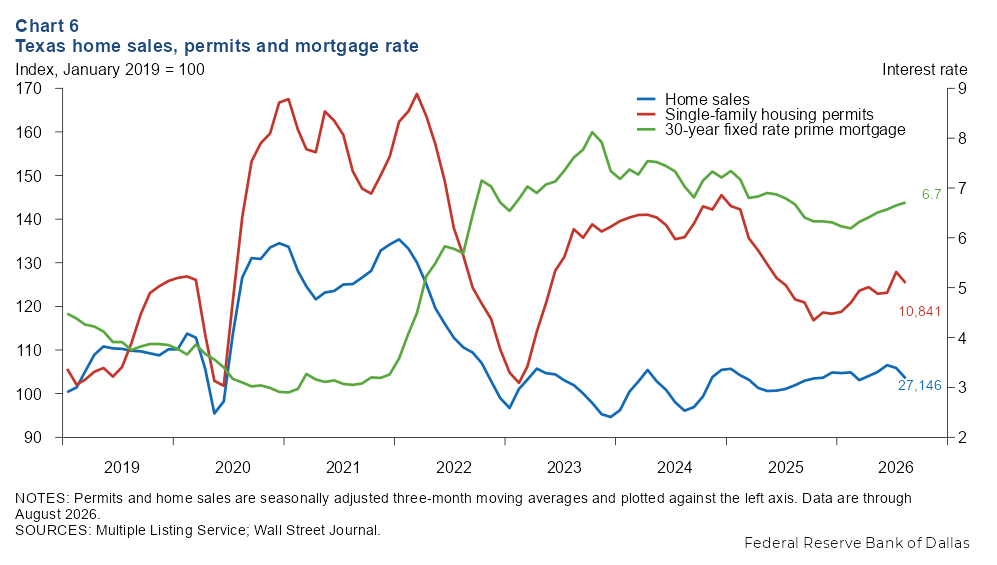
Activity in the housing market remained weak. The three-month moving average of existing-home sales declined 2.2 percent in August partly due to high mortgage rates, which ticked up to 6.7 percent (Chart 6). The three-month moving average of single-family housing permits dipped 2.0 percent in August as builders pulled back amid sluggish demand.
NOTE: Data may not match previously published numbers due to revisions.
About Texas Economic Indicators
Questions or suggestions can be addressed to Dylan Council. Texas Economic Indicators publishes monthly after Texas employment data are released.