Agricultural Survey

Fourth Quarter 2018
Survey Highlights
Bankers responding to the fourth-quarter survey reported improved conditions across most regions of the Eleventh District. Crop yields have been good, particularly for corn and cotton, although some areas have reported problems with harvests due to excessive moisture. Respondents noted prices as being generally weak, particularly for cattle.
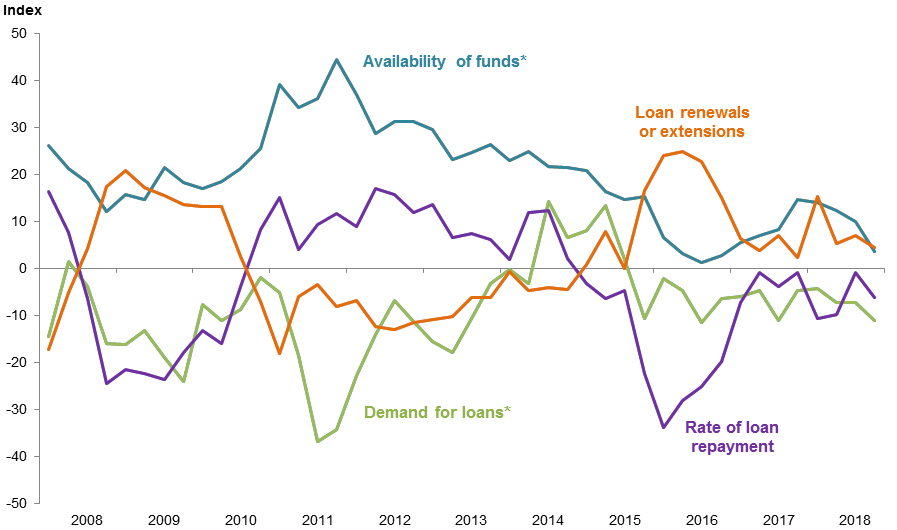
Demand for agricultural loans overall declined for a 13th consecutive quarter. Loan renewals and extensions decelerated, and the rate of loan repayment declined after flattening out in the third quarter. Loan volume fell across all major categories compared with a year ago, with the sharpest declines in dairy, farm machinery and feeder cattle loans (Figure 1).
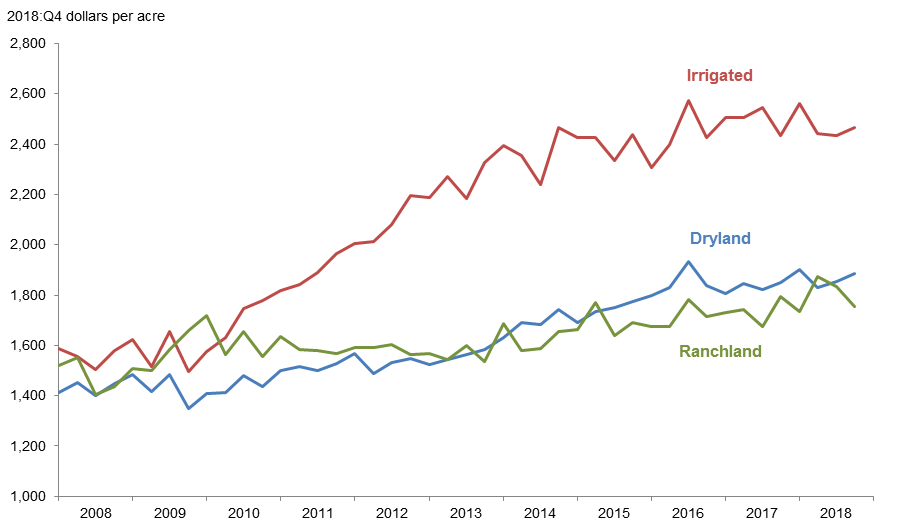
District cropland values ticked up this quarter, while ranchland values declined (Figure 2). According to bankers who responded in both this quarter and fourth quarter 2017, Texas nominal cropland and ranchland values increased year over year (Table 1). Southern New Mexico respondents indicated an increase in irrigated cropland and ranchland values but a decline in dryland values, and northern Louisiana respondents reported an increase in cropland and ranchland values.
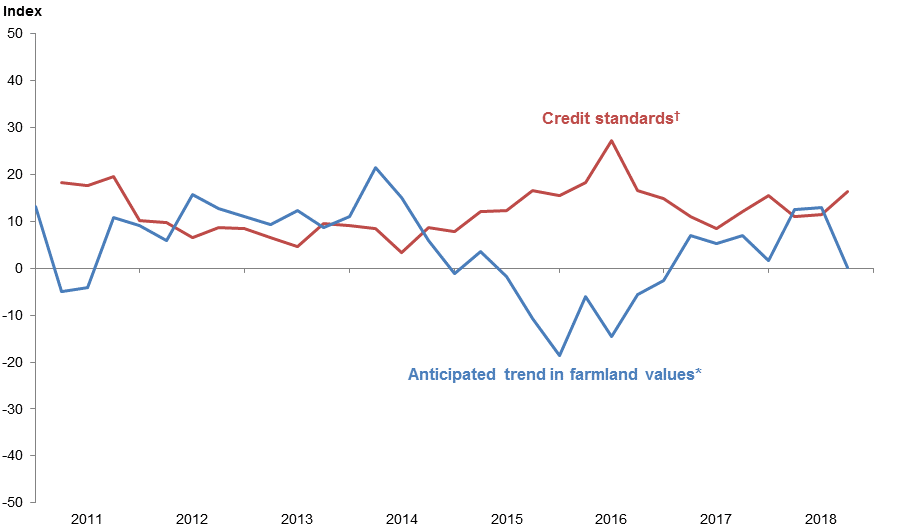
The anticipated trend in the farmland values index was flat after six consecutive quarters of increase, suggesting respondents expect farmland values to hold steady in the upcoming months. The credit standards index indicated further tightening of standards on net (Figure 4).
Quarterly Comments

District bankers were asked for additional comments concerning agricultural land values and credit conditions. These comments have been edited for publication.
Region 1—Northern High Plains
- Late summer moisture was good. Corn and milo harvests are complete, and the cotton harvest is finishing up. Yields on summer crops have been good. Wheat pasture looks good, but there are significantly fewer acres in wheat due to increases in cotton acres.
- Corn harvesting is complete, with yields coming in much higher than normal. Cotton harvesting is nearly complete, with farmers reporting two-to-three-bale cotton. Early ginning results are showing a much-improved quality over last year. This fall has been an exceptional time to wean calves. The health of the cattle this year has been tremendous.
Region 2—Southern High Plains
- Wind and overall weather have not been helpful for crops or harvesting of the same in our area. Cattle are good, but some have been feeding on cubes as weather has been colder. Agriculture is in dire need of a new farm bill or some of the producers will go out of business; older farmers are retiring and cash leasing their land to others.
- Drought in early spring eliminated most all of the dryland cotton and milo by early July. Major rains in September and October slowed harvesting, but irrigated crops remained average to above average in some areas with strong water. Irrigated crop prices should be much better this year than in 2017. Pastures and wheat improved in October, but conditions are declining with current dry conditions and cooler weather.
Region 5—Cross Timbers
- Substantial fall rain has dramatically improved the stock water situation as well as range conditions to some extent, although late in the growing season. Small-grain planting was delayed due to wet weather but is progressing now.
Region 6—North Central Texas
- Yields and prices are not good enough to cover the high input costs.
- Due to flooding in September and October, ample cotton and hay were ruined in the field. We are already experiencing a shortfall of hay for winter cattle.
Region 7—East Texas
- Due to the extremely wet October and November, cropland is about four to six weeks behind schedule for winter ground work. In some instances, as of the first week of December, there was still cotton in the field unable to be harvested due to wet ground conditions. Again, because of the wet conditions, hay production is off as hay pastures were too wet to cut and bale.
- Land values seem stable, but we do anticipate the possibility of slightly weakened cash flow due to the current cattle market prices and the impact that will have over the next six months or so.
Region 8—Central Texas
- We have finally dried out some, with hay producers now cutting dried-out hay fields that are left with freeze-damaged grasses and those fields that were cut back weeks before. The big news is the drop in cattle prices: Poor cows are selling below 15 cents per pound, with calf prices off substantially as well. Even the special sales this fall have seen lower prices on replacement cattle. Next year will be the big unknown, with commodity pricing looking to trend lower and possible inflation.
Region 9—Coastal Texas
- Rural land prices are impacted by purchases for recreational purposes.
Region 11—Trans-Pecos and Edwards Plateau
- Calves and yearlings were lighter this year as the summer rains came late. The country produced adequate forage in most places, allowing the operators to maintain their current stocking rates.
- Early fall rains resulted in good range conditions going into winter. However, livestock prices have been very weak, and we are seeing ranchers holding livestock for sale, waiting for prices to go up.
- The last quarter proved to be both a blessing and a curse for many parts of the Edwards Plateau, when welcome rains became deadly floods on many watersheds in the area. However, after the devastation of the flooding was over, as rebuilding and cleaning up began, the lasting benefits of the tremendous amounts of rain became apparent. A relatively late frost facilitated the growing of a great amount of feed in the late fall, and most areas of Central Texas are going into the winter with a lot of grass cover. In fact, in many minds, the country is in the best shape for this time of year in memory. Livestock prices remain fairly strong and, barring some weather catastrophes, the next few months should be fairly positive in the agriculture sector in this region.
- Pasture conditions are very good, with a large number of producers still not feeding. A decrease in market prices on all species, but particularly on cattle, will adversely affect operating profitability, which has already been marginal due to increasing expenses. Hunting season appears to be going well and is definitely critical to most producers’ overall revenue. Increased predator control is critical as it remains a real issue with almost all sheep and goat operations in our area.
Region 12—Southern New Mexico
- Corn and sorghum silage and haylage harvest is 95 percent complete. Winter wheat stands are exceptional as the fall rains’ timing created near-perfect conditions. Fall runs at area livestock auctions have been higher than normal for October and November. Winter wheat grazing has created good demand for stocker cattle. Beef prices are historically low.
Region 13—Northern Louisiana
- There are more large-row crop farms for sale in this area than there have been in a long time. They are currently priced based on levels from a few years ago when farming was more profitable. It appears the tariffs and unsure farm economy are reducing interest in these farms. The farm price data are based on sales and legitimate purchase plans that I have knowledge of. The large farms that are for sale are not believed to be under stress from debt. One farmer is retiring, one farm was an out-of- area investment, and one is owned by a family that is in another business now and wants to convert the farm to cash.
- Farmland values are holding up better than expected when considering the downward turn in commodity prices. This appears to be based on a lot of optimism that the markets will return and our trade relations improve.
- Farmers in this area are reporting a great in- terest in planting a higher percentage of crop acres in cotton for the 2019 growing season.
Eleventh District Agricultural Data
Figures
|
Figure 1 Farm Lending Trends |
|||||
|---|---|---|---|---|---|
| What changes occurred in non-real-estate farm loans at your bank in the past three months compared with a year earlier? | |||||
| Index | Percent reporting, Q4 | ||||
| 2018:Q3 | 2018:Q4 | Greater | Same | Less | |
| Demand for loans* | -7.2 | -11.0 | 9.2 | 70.6 | 20.2 |
| Availability of funds* | 10.1 | 3.6 | 10.9 | 81.8 | 7.3 |
| Rate of loan repayment | -0.8 | -6.1 | 4.4 | 85.1 | 10.5 |
| Loan renewals or extensions | 7.1 | 4.4 | 8.0 | 88.5 | 3.5 |
| What changes occurred in the volume of farm loans made by your bank in the past three months compared with a year earlier? | |||||
| Index | Percent reporting, Q4 | ||||
| 2018:Q3 | 2018:Q4 | Greater | Same | Less | |
| Non-real-estate farm loans | -1.6 | -13.8 | 8.6 | 69.0 | 22.4 |
| Feeder cattle loans* | -13.1 | -19.4 | 7.6 | 65.4 | 27.0 |
| Dairy loans* | -17.8 | -21.0 | 0.1 | 78.8 | 21.1 |
| Crop storage loans* | -15.1 | -6.8 | 5.1 | 83.0 | 11.9 |
| Operating loans | -1.5 | -7.1 | 9.7 | 73.5 | 16.8 |
| Farm machinery loans* | -16.5 | -19.5 | 2.4 | 75.7 | 21.9 |
| Farm real estate loans* | -9.1 | -13.0 | 6.5 | 74.0 | 19.5 |
| *Seasonally adjusted. NOTES: Survey responses are used to calculate an index for each item by subtracting the percentage of bankers reporting less from the percentage reporting greater. Positive index readings generally indicate an increase, while negative index readings generally indicate a decrease. |
|||||
| Figure 2 Real Land Values |
|---|
| Figure 3 Real Cash Rents |
|---|
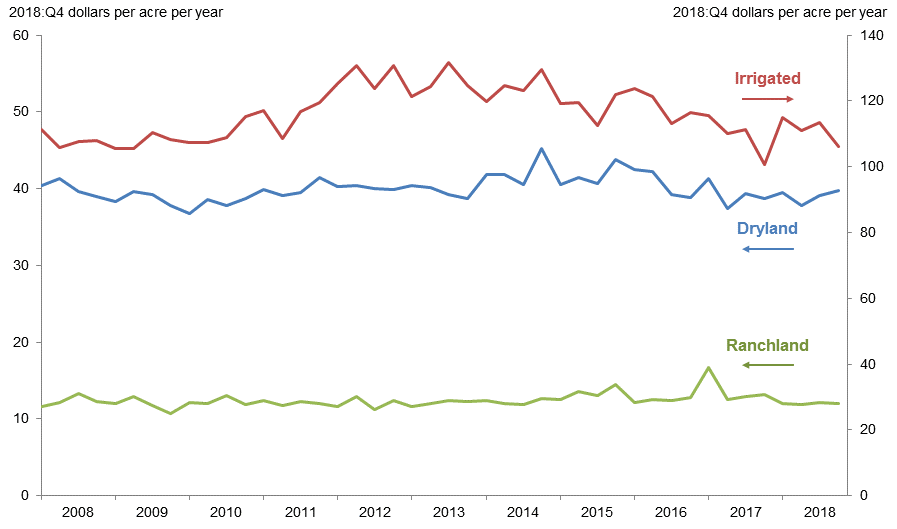
NOTES: All values have been seasonally adjusted. Real values are created by deflating the nominal values using the implicit price deflator for U.S. gross domestic product.
|
Figure 4 Anticipated Farmland Values and Credit Standards |
|||||
|---|---|---|---|---|---|
| What trend in farmland values do you expect in your area in the next three months? | |||||
| Index | Percent reporting, Q4 | ||||
| Anticipated trend in farmland values* | 2018:Q3 | 2018:Q4 | Up | Stable | Down |
| 13.0 | 0.1 | 7.6 | 84.9 | 7.5 | |
| What change occurred in credit standards for agricultural loans at your bank in the past three months compared with a year earlier?† | |||||
| Credit standards | 2018:Q3 | 2018:Q4 | Tightened | Same | Loosened |
| 11.5 | 16.4 | 17.2 | 81.9 | 0.9 | |
†Added to survey in second quarter 2011.
NOTES: Survey responses are used to calculate an index for each item by subtracting the percentage of bankers reporting less from the percentage reporting greater. Positive index readings generally indicate an increase, while negative index readings generally indicate a decrease.
Tables
Tables |
||||
| Table 1 Rural Real Estate Values—Fourth Quarter 2018 |
||||
|---|---|---|---|---|
| Banks1 | Average value2 | Percent change in value from previous year3 | ||
| Cropland—Dryland | ||||
| District* | 100 | 1,944 | 4.5 | |
| Texas* | 88 | 1,965 | 4.5 | |
| 1 | Northern High Plains | 9 | 917 | 0.7 |
| 2 | Southern High Plains | 13 | 819 | 7.8 |
| 3 | Northern Low Plains* | 7 | 852 | -3.3 |
| 4 | Southern Low Plains* | 3 | 953 | -3.8 |
| 5 | Cross Timbers | 5 | 1,550 | 0.7 |
| 6 | North Central Texas | 17 | 2,979 | 5.9 |
| 7 | East Texas* | 8 | 3,076 | 7.6 |
| 8 | Central Texas | 11 | 3,714 | 1.3 |
| 9 | Coastal Texas | 6 | 2,175 | 9.2 |
| 10 | South Texas | 5 | 2,510 | 5.6 |
| 11 | Trans-Pecos and Edwards Plateau | 4 | 2,850 | 6.5 |
| 12 | Southern New Mexico | 5 | 400 | -5.7 |
| 13 | Northern Louisiana | 7 | 2,800 | 6.8 |
| Cropland—Irrigated | ||||
| District* | 73 | 2,541 | 1.4 | |
| Texas* | 59 | 2,256 | 1.3 | |
| 1 | Northern High Plains | 9 | 1,978 | -0.3 |
| 2 | Southern High Plains | 12 | 1,738 | 3.6 |
| 3 | Northern Low Plains* | 4 | 2,321 | 2.2 |
| 4 | Southern Low Plains | 3 | 1,267 | 0.0 |
| 5 | Cross Timbers | N/A | N/A | N/A |
| 6 | North Central Texas | 6 | 3,292 | 2.7 |
| 7 | East Texas | 4 | 3,038 | 4.6 |
| 8 | Central Texas | 6 | 4,183 | 0.4 |
| 9 | Coastal Texas | 3 | 2,000 | -11.1 |
| 10 | South Texas | 5 | 3,600 | 3.2 |
| 11 | Trans-Pecos and Edwards Plateau | 5 | 3,770 | 7.5 |
| 12 | Southern New Mexico | 7 | 4,107 | 2.6 |
| 13 | Northern Louisiana | 7 | 3,743 | 0.5 |
| Ranchland | ||||
| District* | 105 | 1,808 | 4.1 | |
| Texas* | 92 | 2,163 | 4.2 | |
| 1 | Northern High Plains | 9 | 675 | 0.0 |
| 2 | Southern High Plains | 7 | 779 | 1.1 |
| 3 | Northern Low Plains | 7 | 836 | -7.5 |
| 4 | Southern Low Plains* | 3 | 819 | 0.0 |
| 5 | Cross Timbers | 6 | 1,708 | -1.1 |
| 6 | North Central Texas | 17 | 2,965 | 4.2 |
| 7 | East Texas | 12 | 3,096 | 0.2 |
| 8 | Central Texas | 11 | 5,686 | 9.8 |
| 9 | Coastal Texas | 5 | 2,120 | -12.6 |
| 10 | South Texas | 5 | 2,720 | 5.5 |
| 11 | Trans-Pecos and Edwards Plateau | 10 | 1,903 | 7.9 |
| 12 | Southern New Mexico | 7 | 271 | 3.4 |
| 13 | Northern Louisiana | 6 | 2,142 | 2.3 |
| *Seasonally adjusted. 1 Number of banks reporting land values. 2 Prices are dollars per acre, not adjusted for inflation. 3 Not adjusted for inflation and calculated using responses only from those banks reporting in both the past and current quarter. |
||||
| Table 2 Interest Rates by Loan Type |
|||||
|---|---|---|---|---|---|
| Feeder cattle | Other farm operating | Intermediate term | Long-term farm real estate | ||
| Fixed (average rate, percent) | |||||
| 2017:Q4 | 6.24 | 6.29 | 6.25 | 5.99 | |
| 2018:Q1 | 6.41 | 6.51 | 6.28 | 6.10 | |
| Q2 | 6.55 | 6.57 | 6.50 | 6.24 | |
| Q3 | 6.74 | 6.84 | 6.64 | 6.36 | |
| Q4 | 6.88 | 6.95 | 6.78 | 6.58 | |
| Variable (average rate, percent) | |||||
| 2017:Q4 | 5.91 | 5.93 | 5.97 | 5.65 | |
| 2018:Q1 | 6.18 | 6.17 | 6.04 | 5.75 | |
| Q2 | 6.25 | 6.28 | 6.23 | 5.90 | |
| Q3 | 6.48 | 6.48 | 6.43 | 6.02 | |
| Q4 | 6.70 | 6.69 | 6.66 | 6.26 | |
Back issues of Agricultural Survey »
For More Information
Questions regarding the Agricultural Survey can be addressed to Christopher Slijk at christopher.slijk@dal.frb.org.