Agricultural Survey

First Quarter 2020
Survey Highlights
Bankers responding to the first-quarter survey reported overall better conditions across most regions of the Eleventh District. They noted that a mild winter has allowed some farmers to be ahead of schedule. Above-normal rainfall so far in 2020 may contribute to better crop yields. Unfortunately, survey participants also noted that the negative impact on commodity prices from the coronavirus (COVID-19) outbreak has changed the outlook for 2020 from one of challenge to one of extreme concern.
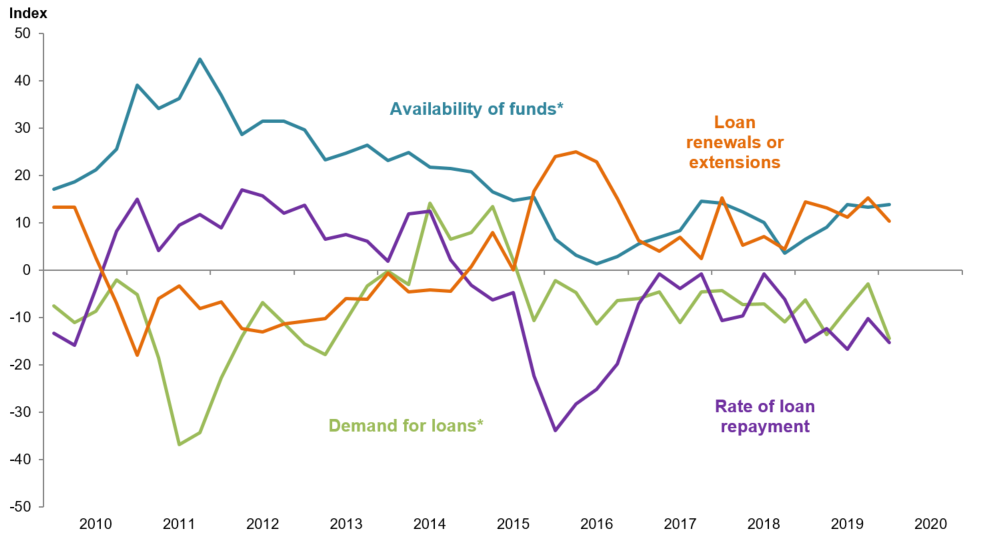
Demand for agricultural loans continued to decline, with the loan demand index registering its 18th quarter in negative territory. Loan renewals or extensions increased, and the rate of loan repayment continued to decline. Loan volume fell across all major categories compared with a year ago (Figure 1).
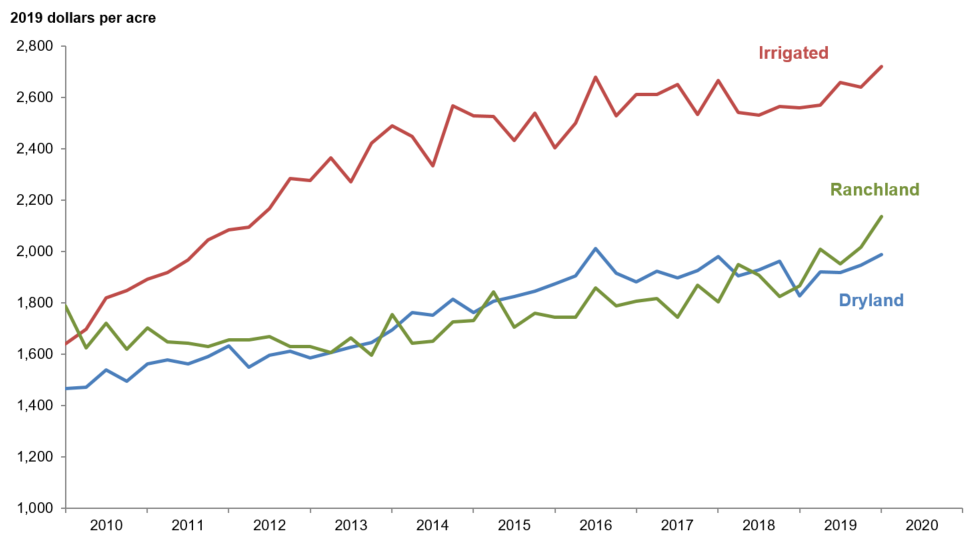
All district land values increased this quarter (Figure 2). According to bankers who responded in both this quarter and first quarter 2019, nominal dry cropland and ranchland values increased year over year in Texas, northern Louisiana and southern New Mexico; irrigated cropland only fell in southern New Mexico (Table 1).
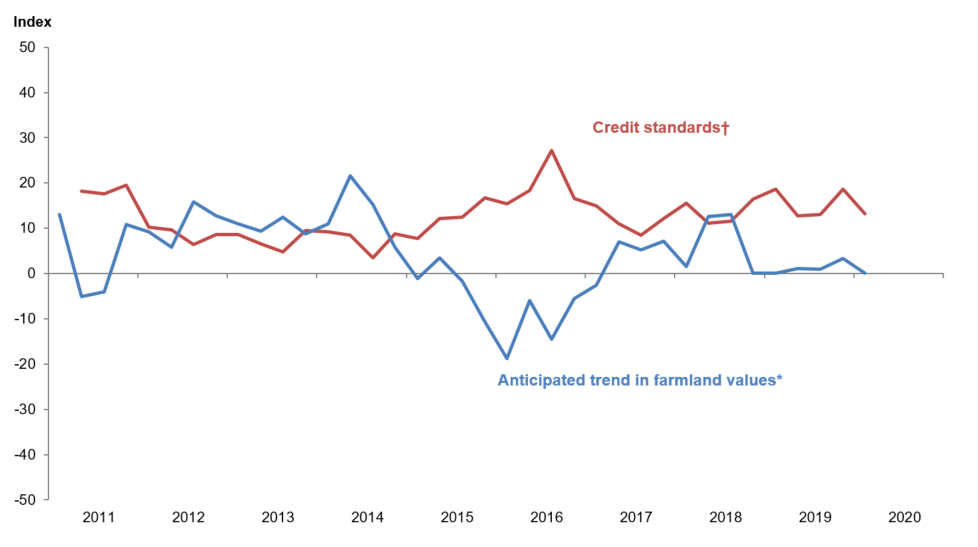
The anticipated trend in farmland values index was flat in first quarter 2020 after increasing slightly in fourth quarter 2019. The credit standards index went down, indicating some loosening of standards on net (Figure 4).Quarterly Comments

District bankers were asked for additional comments concerning agricultural land values and credit conditions. These comments have been edited for publication.
Region 1—Northern High Plains
- A mostly open winter has allowed farmers to be ahead of schedule. Corn and cotton planters will soon be running. Media coverage of the coronavirus has dropped commodity prices. The market volatility from external factors is about more than we can handle.
Region 2—Southern High Plains
- Our area is needing moisture. Land is still breaking pretty well but is needing rain now. The economy is not helping our agriculture loans, and prices continue to weaken.
- Local cotton and grain prices remain low with the coronavirus impact. Promises of Wildfire and Hurricane Indemnity Program–Plus (WHIP+) payments from the Farm Service Agency for crop years 2018 and 2019 on the horizon give hope to reduce shortfalls for those years. The proposal of another Market Facilitation Program (MFP) payment in October also gives some promise for a successful year in 2020. Moisture is average conditions with the needed rains this week, but more will be needed before seasonal winds in March.
- Farm income is down considerably from last year, and had it not been for the government money, 2019 would have been a total disaster financially. Prospects for 2020 are not looking good in our area due to moisture, crop prices, lower insurance prices and cost of production. We have lost several borrowers to retirement who are not wanting to risk it all at this time, and we will continue to lose them, either voluntarily or involuntarily.
- There were very few land sales in the past quarter. Figures quoted are more actual values experienced by owners at this time, rather than actual sales.
- The 2019 season wound up far better than envisioned. Substantial carryover conditions were anticipated, but those have been rare. In general, South Plains growers benefited by failing out much of the poor dryland crop for insurance, which paid better than harvesting it and selling the meager, low-grade fiber for discounted prices. In addition, trailing 2018 federal support payments plus receipt of all three installments of Market Facilitation Program payments helped cover their loans. Some operating loans for a few borrowers will need to be extended for final liquidation when 2019 price supports are paid in October. If that is the worst outcome from a tough season, we will take it. Looking forward, though, the extremely negative impact on commodity prices from the COVID-19 [coronavirus] scare has changed the outlook for 2020 from one of challenge to one of extreme concern. Producers have no realistic hope of covering all costs with 60-cent cotton prices. Their attitude is characterized by economizing on expenditures, which is understandable but won’t promote good yields. Insurance guarantees have declined to levels too low to provide acceptable coverage. We are now quantifying as best we can the value of price-support payments and hoping for better markets.
Region 3—Northern Low Plains
- Political and environmental influences continue to drive commodity markets with fear and uncertainty; this creates significant challenges in planning for production purposes. Highly leveraged borrowers will struggle to survive this environment.
Region 6—North Central Texas
- There were very mild conditions this past winter; not many of our farmers have had great hay sales the past season as a result. So far, 2020 has brought way above-normal rainfall, and more is currently expected in the forecast. Cattle/calf prices are still somewhat depressed; we hope as spring arrives, they will rebound. We are skeptical on taking on new agriculture customers because of the unusual weather patterns the past few years.
- Agriculture values are low compared with input costs.
- Crop costs of production have risen to the point where a “good” crop is required to break even, and a “great” crop produces an average margin.
- Due to the continued pattern of wet weather in northeast Texas, prospects for 2020 crop production are not particularly positive. The wheat acreage planted last fall was hampered by the wet fall, and now the volume of corn acreage is threatened by the wet early March 2020 weather.
Region 7—East Texas
- To date, the region has experienced a mild winter. Cattle are in good-to-moderate flesh. Small grain fields used for grazing are in good condition. Yearling cattle are expected to weigh heavy this spring. Row cropland is in excellent condition, and about 60 percent of corn acreage was planted before rains the first week of March.
Region 8—Central Texas
- The area is still in need of rainfall. Ponds continue to decline as the lack of rain continues. Spring rain will be needed for hay crops to be replenished.
- Winter hangs on and rain stays away—seems to be the theme for this spring. Winter grasses are already going to seed in some pastures due to lack of moisture. Corn is being planted right now in the fields, with the hope of no late freezes. Hay continues to be short, with most producers hoping to stretch supplies until warmer weather returns; we just hope we are not feeding hay in the summer months to survive. All commodity prices are down—panic over the coronavirus—so, farmers and ranchers need some good news soon to keep everyone from being depressed. Oil and gas rigs are still drilling in the area, with some recent sales and consolidation of oil and gas companies in the area. If oil prices drop again, it might slow the whole process down for a while.
Region 11—Trans-Pecos and Edwards Plateau
- Until the coronavirus phenomenon entered the picture, livestock prices were strong, and the spring looked promising. However, we will have to take a wait-and-see approach to how things will play out for the remainder of the year. While still dry, some sections of the Edwards Plateau have received a bit of rainfall recently, and there is a promise of maybe some more to come in the next 30 days or so. As always, moisture is the key for agriculture.
- Prior to recent rains, pastures were very dry, with amounts received being very variable. Much more rainfall is needed to keep the newly green winter grasses and weeds going and get deeper soil moisture. Livestock is showing the effects of the dry conditions, and feeding remains in full swing. Market sale prices and run numbers for all species are very variable. Predators remain a continually increasing problem.
Region 12—Southern New Mexico
- Agriculture land values remain on a steady path of stable to slightly increasing in value.
Region 13—Northern Louisiana
- Crop loan repayment for 2019 was down for the first quarter of 2020. This put a lot of farmers behind in coming in for their 2020 crop loans. Pricing, excessive rainfall and crops being held put everything behind for the start of a new crop season.
Eleventh District Agricultural Data
Figures
|
Figure 1 Farm Lending Trends |
|||||
|---|---|---|---|---|---|
| What changes occurred in non-real-estate farm loans at your bank in the past three months compared with a year earlier? | |||||
| Index | Percent reporting, Q1 | ||||
| 2019:Q4 | 2020:Q1 | Greater | Same | Less | |
| Demand for loans* | -2.9 | -14.4 | 8.1 | 69.4 | 22.5 |
| Availability of funds* | 13.3 | 13.8 | 17.0 | 79.8 | 3.2 |
| Rate of loan repayment | -10.3 | -15.3 | 2.0 | 80.6 | 17.4 |
| Loan renewals or extensions | 15.2 | 10.3 | 14.4 | 81.4 | 4.1 |
| What changes occurred in the volume of farm loans made by your bank in the past three months compared with a year earlier? | |||||
| Index | Percent reporting, Q1 | ||||
| 2019:Q4 | 2020:Q1 | Greater | Same | Less | |
| Non-real-estate farm loans | -11.1 | -15.3 | 5.1 | 74.5 | 20.4 |
| Feeder cattle loans* | -25.8 | -15.6 | 4.5 | 75.4 | 20.1 |
| Dairy loans* | -24.2 | -21.6 | 0.0 | 78.4 | 21.6 |
| Crop storage loans* | -14.9 | -10.3 | 9.4 | 70.9 | 19.7 |
| Operating loans | -3.8 | 0.0 | 11.7 | 76.6 | 11.7 |
| Farm machinery loans* | -19.6 | -19.6 | 5.2 | 70.0 | 24.8 |
| Farm real estate loans* | -14.0 | -10.1 | 8.3 | 73.3 | 18.4 |
| *Seasonally adjusted. NOTES: Survey responses are used to calculate an index for each item by subtracting the percentage of bankers reporting less from the percentage reporting greater. Positive index readings generally indicate an increase, while negative index readings generally indicate a decrease. |
|||||
| Figure 2 Real Land Values |
|---|
| Figure 3 Real Cash Rents |
|---|
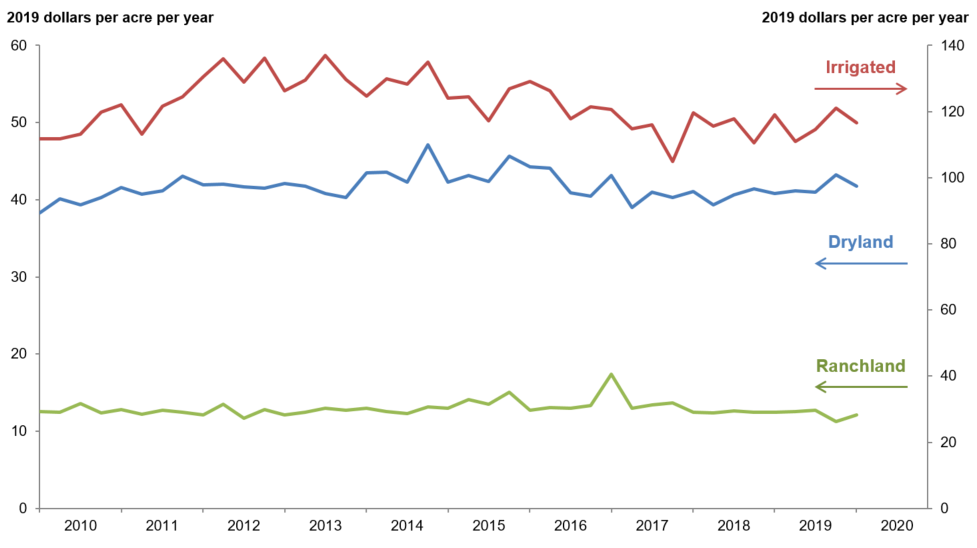
NOTES: All values have been seasonally adjusted. Real values are created by deflating the nominal values using the implicit price deflator for U.S. gross domestic product.
|
Figure 4 Anticipated Farmland Values and Credit Standards |
|||||
|---|---|---|---|---|---|
| What trend in farmland values do you expect in your area in the next three months? | |||||
| Index | Percent reporting, Q1 | ||||
| Anticipated trend in farmland values* | 2019:Q4 | 2020:Q1 | Up | Stable | Down |
| 3.4 | 0.1 | 7.5 | 85.1 | 7.4 | |
| What change occurred in credit standards for agricultural loans at your bank in the past three months compared with a year earlier?† | |||||
| Credit standards | 2019:Q4 | 2020:Q1 | Tightened | Same | Loosened |
| 18.7 | 13.1 | 13.1 | 86.9 | 0.0 | |
†Added to survey in second quarter 2011.
NOTES: Survey responses are used to calculate an index for each item by subtracting the percentage of bankers reporting less from the percentage reporting greater. Positive index readings generally indicate an increase, while negative index readings generally indicate a decrease.
Tables
Tables |
||||
| Table 1 Rural Real Estate Values—First Quarter 2020 |
||||
|---|---|---|---|---|
| Banks1 | Average value2 | Percent change in value from previous year3 | ||
| Cropland—Dryland | ||||
| District* | 75 | 2,011 | 9.0 | |
| Texas* | 67 | 2,023 | 8.5 | |
| 1 | Northern High Plains | 8 | 909 | 1.1 |
| 2 | Southern High Plains | 8 | 913 | 13.9 |
| 3 | Northern Low Plains* | n.a. | n.a. | n.a. |
| 4 | Southern Low Plains* | 5 | 1,043 | 0.0 |
| 5 | Cross Timbers | 4 | 1,738 | 13.0 |
| 6 | North Central Texas | 11 | 3,227 | 12.3 |
| 7 | East Texas* | 6 | 2,834 | -2.4 |
| 8 | Central Texas | 11 | 4,145 | 10.9 |
| 9 | Coastal Texas | 3 | 1,900 | 8.8 |
| 10 | South Texas | 5 | 2,450 | 22.5 |
| 11 | Trans-Pecos and Edwards Plateau | 4 | 3,000 | 4.3 |
| 12 | Southern New Mexico | 3 | 600 | 125.0 |
| 13 | Northern Louisiana | 5 | 2,990 | 2.1 |
| Cropland—Irrigated | ||||
| District* | 56 | 2,752 | 1.1 | |
| Texas* | 46 | 2,365 | 0.3 | |
| 1 | Northern High Plains | 8 | 2,129 | 2.0 |
| 2 | Southern High Plains | 8 | 1,744 | -5.8 |
| 3 | Northern Low Plains* | n.a. | n.a. | n.a. |
| 4 | Southern Low Plains | 4 | 1,575 | 0.0 |
| 5 | Cross Timbers | n.a. | n.a. | n.a. |
| 6 | North Central Texas | 5 | 3,640 | 33.3 |
| 7 | East Texas | 3 | 3,033 | 1.1 |
| 8 | Central Texas | 5 | 4,100 | 4.6 |
| 9 | Coastal Texas | n.a. | n.a. | n.a. |
| 10 | South Texas | 4 | 3,450 | -0.7 |
| 11 | Trans-Pecos and Edwards Plateau | 4 | 4,438 | 2.9 |
| 12 | Southern New Mexico | 5 | 5,000 | -2.1 |
| 13 | Northern Louisiana | 5 | 4,270 | 12.3 |
| Ranchland | ||||
| District* | 82 | 2,160 | 6.7 | |
| Texas* | 73 | 2,577 | 6.0 | |
| 1 | Northern High Plains | 8 | 719 | 3.0 |
| 2 | Southern High Plains | 5 | 790 | 3.0 |
| 3 | Northern Low Plains | n.a. | n.a. | n.a. |
| 4 | Southern Low Plains* | 4 | 1,129 | 10.0 |
| 5 | Cross Timbers | 6 | 2,433 | 24.8 |
| 6 | North Central Texas | 11 | 3,609 | 16.1 |
| 7 | East Texas | 10 | 3,015 | 3.7 |
| 8 | Central Texas | 12 | 6,250 | 2.9 |
| 9 | Coastal Texas | n.a. | n.a. | n.a. |
| 10 | South Texas | 4 | 2,788 | -3.0 |
| 11 | Trans-Pecos and Edwards Plateau | 9 | 2,500 | 3.7 |
| 12 | Southern New Mexico | 4 | 363 | 40.0 |
| 13 | Northern Louisiana | 5 | 2,130 | 1.7 |
| *Seasonally adjusted. 1 Number of banks reporting land values. 2 Prices are dollars per acre, not adjusted for inflation. 3 Not adjusted for inflation and calculated using responses only from those banks reporting in both the past and current quarter. n.a.—Not published due to insufficient responses but included in totals for Texas and district. |
||||
| Table 2 Interest Rates by Loan Type |
|||||
|---|---|---|---|---|---|
| Feeder cattle | Other farm operating | Intermediate term | Long-term farm real estate | ||
| Fixed (average rate, percent) | |||||
| 2019:Q1 | 7.01 | 7.11 | 6.88 | 6.58 | |
| Q2 | 7.02 | 7.11 | 6.83 | 6.40 | |
| Q3 | 6.90 | 6.89 | 6.71 | 6.42 | |
| Q4 | 6.58 | 6.61 | 6.45 | 6.11 | |
| 2020:Q1 | 6.46 | 6.53 | 6.28 | 5.96 | |
| Variable (average rate, percent) | |||||
| 2019:Q1 | 6.81 | 6.83 | 6.75 | 6.44 | |
| Q2 | 6.84 | 6.85 | 6.80 | 6.42 | |
| Q3 | 6.58 | 6.59 | 6.50 | 6.21 | |
| Q4 | 6.39 | 6.29 | 6.23 | 5.88 | |
| 2020:Q1 | 6.15 | 6.19 | 6.10 | 5.72 | |
Back issues of Agricultural Survey »
For More Information
Questions regarding the Agricultural Survey can be addressed to Jesus Cañas at Jesus.Canas@dal.frb.org.