Agricultural Survey

Second Quarter 2020
Survey Highlights
Bankers responding to the second-quarter survey reported overall weaker conditions across most regions of the Eleventh District. They noted that dry conditions are putting a strain on agricultural production despite some rainfall in late May. In addition, survey participants noted that commodity prices remain low, including beef prices. “Although beef prices are sky high at the supermarket, little of that increase has found its way to the producer, who still struggles with increased input costs and uncertainty in the weather,” a survey participant said.
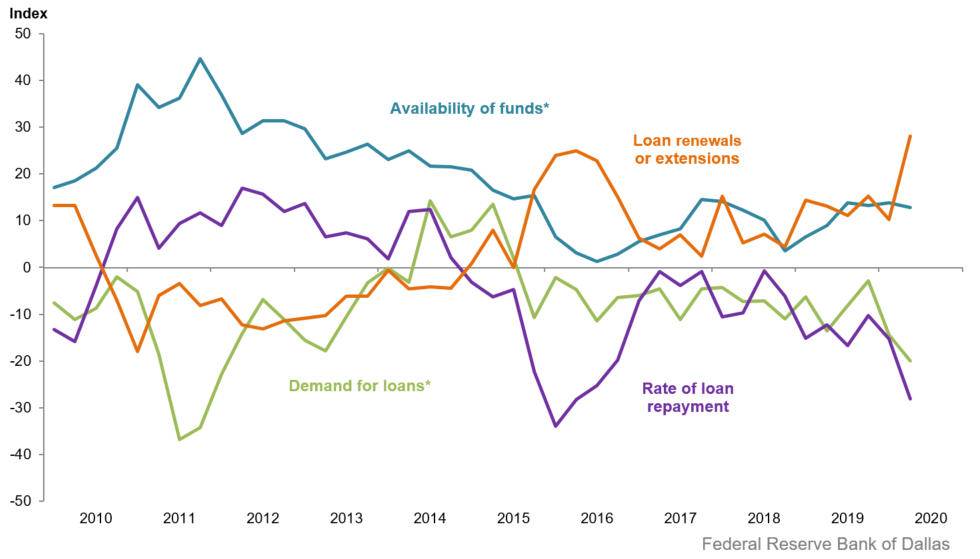
Demand for agricultural loans continued to decline, with the loan demand index registering its 19th quarter in negative territory. Loan renewals or extensions increased while the rate of loan repayment continued to decline. Loan volume fell across all major categories compared with a year ago (Figure 1).
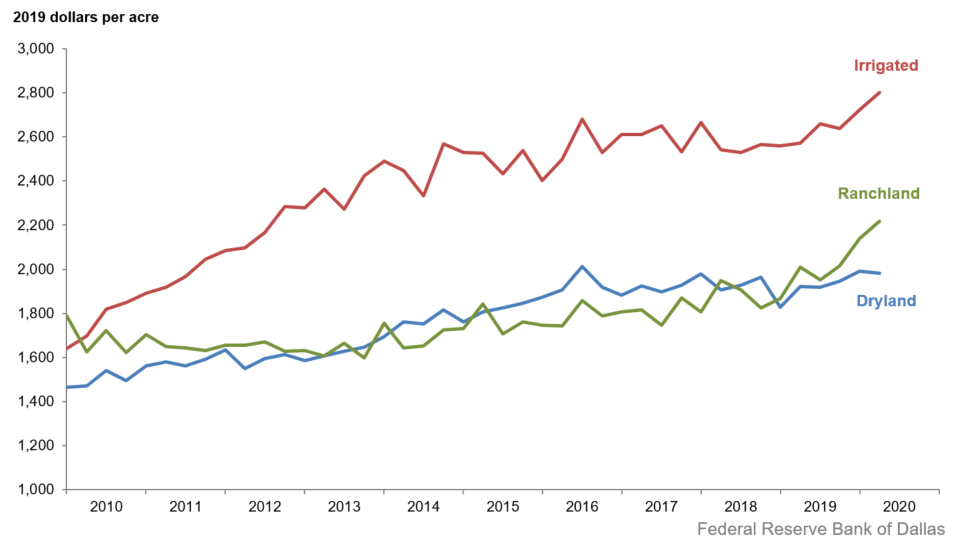
Irrigated and ranchland values increased this quarter, while dryland values were flat (Figure 2). According to bankers who responded in both this quarter and second quarter 2019, nominal dry and irrigated cropland and ranchland values increased year over year in Texas and southern New Mexico (Table 1).
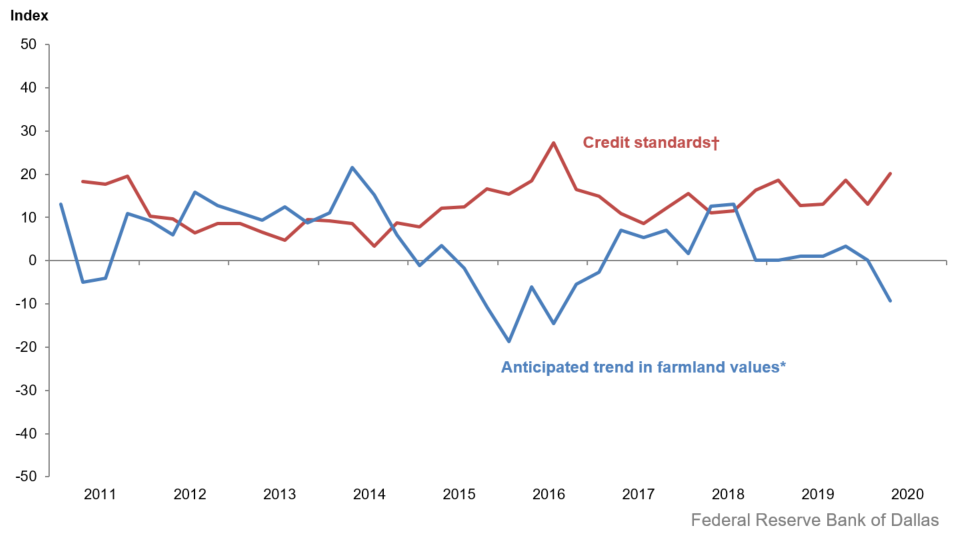
The anticipated trend in farmland values index fell in second quarter 2020, suggesting respondents expect farmland values to decrease. The credit standards index went up, indicating further tightening of standards on net (Figure 4).
Quarterly Comments

District bankers were asked for additional comments concerning agricultural land values and credit conditions. These comments have been edited for publication.
Region 1—Northern High Plains
- Low prices and extremely dry conditions are creating a strain on our producers. Producers have to reevaluate their crops and marketing strategies to find better ways to cash flow their operations.
- Dry conditions combined with low commodity prices have producers very concerned about challenges in the second half of 2020.
- We are extremely dry. Grassland is burning up, and the emerging corn and cotton crops are suffering wind damage. Packinghouse slowdowns have caused a backlog in beef processing. Commodity prices remain low. I’m not feeling very optimistic about the 2020 agriculture industry.
- It has been a challenging year for bankers and customers alike. I feel our communities need to open business as soon as possible to relieve some of the mental and financial stress caused by COVID-19. A very large concern also is the extended drought. The Mesonet weather station in the north Panhandle is showing 157 consecutive days without receiving more than .25 inches of rain. In the past six months, we have received 2.5 inches. A drought of this magnitude and low commodity prices may make for a challenging fall renewal season.
- Dry conditions in the north Panhandle region present an ongoing challenge to producers, as well as depressed commodity prices and economic uncertainty.
Region 2—Southern High Plains
- Drought is hurting our area. Cotton is being dry planted, and the grass color is turning now. Cattle are in fair-to-good shape. Peanuts are planted and looking OK currently. Overall, current economic conditions are impacting farmers who most likely will need government assistance to break even and stay in business.
- The ag community is in trouble. In West Texas, we have varied areas of moisture from good to bad. Irrigated land is decent, but no rain is in the forecast. And of course prices are horrible. We must have the government’s help to make it through 2020.
- All agriculture prices are impacted by COVID-19.
- It’s very dry in most of our territory. We are in need of rain soon to have a dryland cotton crop. Coronavirus Food Assistance Program (CFAP) funds are minimal but helpful especially for cattle producers. Markets continue below breakeven on all commodities.
- The Coronavirus Aid, Relief and Economic Security (CARES) Act worked out OK for those who actually marketed fat cattle; for all others, it has been immaterial. We had a substantial amount of our ag producers receive Payroll Protection Program loans. Virtually all our agribusiness customers did as well, and this has provided meaningful support. Utilization of the Small Business Administration’s Economic Injury Disaster Loan (EIDL) program has not been widespread. We only have a couple of agribusinesses at most who may have utilized the Main Street Lending Program. Crop prospects on the South Plains are terrible. Rainfall has been very much lacking, especially in the western half of the area. Abandonment will be sizeable; with crop prices so poor, insurance adjustments will probably work out better than taking the crop to harvest.
Region 3—Northern Low Plains
- Low commodity prices have impacted projected cash flow and last year’s payout of operating loans. The depressed commodity prices, drought conditions in some of our area and now the banning of the herbicide Dicamba has added to an unsettled undertone in our area. Our pasture conditions range from poor to fair. Cattle prices need to rebound to make that enterprise profitable again.
- A freeze and a couple of very hot days have hurt what looked to be a bumper wheat crop. Some fields were completely destroyed, while many others suffered 50–75 percent damage. Cattle prices have rebounded some at local sales. This is another year where the producers will have a hard time making a profit.
Region 6—North Central Texas
- Cattle prices are depressed due to supply chain issues. Agriculture land prices appear to be stable, but there is not much available for sale or many recent transactions.
Region 8—Central Texas
- Due to the shutdown of the economy, the real estate market has come to a virtual halt. Many transactions were scrubbed. Borrowers/buyers have taken to the sideline in a wait-and-see mode. Volatile beef prices have created more concern about ranch management planning. The good news is, we had some nice rains in May.
Region 11—Trans-Pecos and Edwards Plateau
- Cattle prices have somewhat fallen due to shutdowns in the packing industry. Although beef prices are sky high at the supermarket, little of that increase has found its way to the producer who still struggles with increased input costs, uncertainty in the weather and predator problems. Some rain has fallen in the Edwards Plateau over the last quarter, but it has been spotty.
- Market prices for sheep and goats remain at good levels, though they fluctuate week to week. Movement continues away from wool sheep toward hair sheep due to decreased labor requirements and productivity of the hair sheep. Market prices for cattle in general continue lower, though replacement-cow market prices remain decent. Pasture conditions remain on the dry side, though scattered areas have had very beneficial rainfall and increased grass production. General rainfall is needed ahead of the coming summer months. Profitable operation of ranching operations remains challenging.
Region 12—Southern New Mexico
- Precipitation is greatly needed in this area both for ranchers as well as for summer crops to have a chance. High temperatures and hot winds are quickly eradicating any moisture we had built up. Commodity prices are seen as being unstable right now.
Eleventh District Agricultural Data
Figures
| Figure 1 Farm Lending Trends |
|||||
|---|---|---|---|---|---|
| What changes occurred in non-real-estate farm loans at your bank in the past three months compared with a year earlier? | |||||
| Index | Percent reporting, Q2 | ||||
| 2020:Q1 | 2020:Q2 | Greater | Same | Less | |
|
Demand for loans* |
–14.4 |
–20.0 |
7.4 |
65.2 |
27.4 |
|
Availability of funds* |
13.8 |
12.9 |
18.5 |
75.9 |
5.6 |
|
Rate of loan repayment |
–15.3 |
–28.2 |
1.9 |
68.0 |
30.1 |
|
Loan renewals or extensions |
10.3 |
28.2 |
31.1 |
66.0 |
2.9 |
| What changes occurred in the volume of farm loans made by your bank in the past three months compared with a year earlier? | |||||
| Index | Percent reporting, Q2 | ||||
| 2020:Q1 | 2020:Q2 | Greater | Same | Less | |
|
Non–real–estate farm loans |
–15.3 |
–24.5 |
4.9 |
65.7 |
29.4 |
|
Feeder cattle loans* |
–15.6 |
–22.3 |
7.7 |
62.3 |
30.0 |
|
Dairy loans* |
–21.6 |
–11.9 |
5.2 |
77.7 |
17.1 |
|
Crop storage loans* |
–10.3 |
–14.7 |
7.3 |
70.7 |
22.0 |
|
Operating loans |
0.0 |
–7.1 |
8.1 |
76.8 |
15.2 |
|
Farm machinery loans* |
–19.6 |
–26.9 |
1.1 |
70.9 |
28.0 |
|
Farm real estate loans* |
–10.1 |
–24.1 |
3.0 |
69.9 |
27.1 |
| *Seasonally adjusted. NOTE: Survey responses are used to calculate an index for each item by subtracting the percentage of bankers reporting less from the percentage reporting greater. Positive index readings generally indicate an increase, while negative index readings generally indicate a decrease. |
|||||
| Figure 2 Real Land Values |
|---|
| Figure 3 Real Cash Rents |
|---|
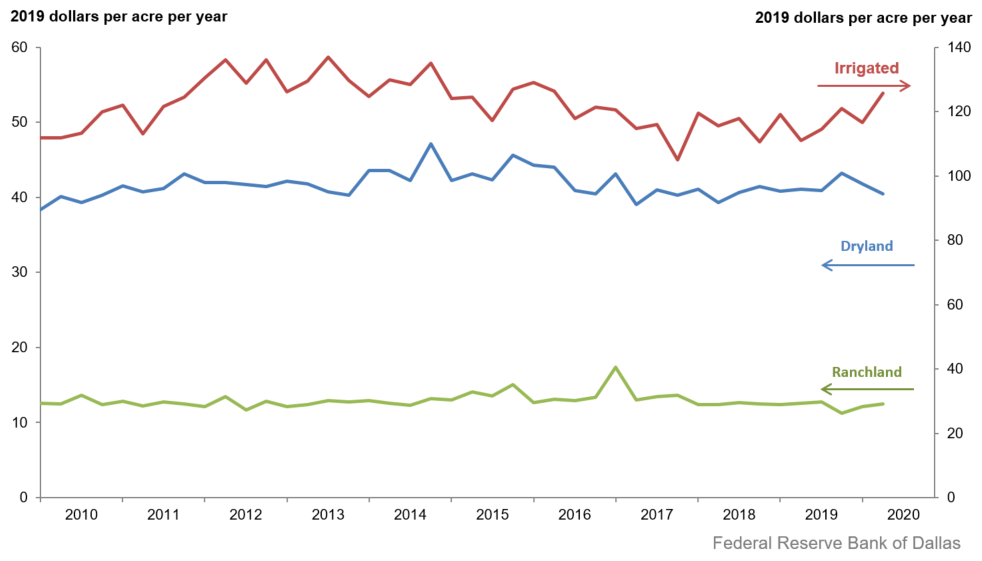
NOTE: All values have been seasonally adjusted. Real values are created by deflating the nominal values using the implicit price deflator for U.S. gross domestic product.
| Figure 4 Anticipated Farmland Values and Credit Standards |
|||||
|---|---|---|---|---|---|
| What trend in farmland values do you expect in your area in the next three months? | |||||
| Index | Percent reporting, Q2 | ||||
| 2020:Q1 | 2020:Q2 | Up | Stable | Down | |
| Anticipated trend in farmland values* |
0.1 |
–9.3 |
2.3 |
86.1 |
11.6 |
| What change occurred in credit standards for agricultural loans at your bank in the past three months compared with a year earlier? | |||||
| 2020:Q1 | 2020:Q2 | Tightened | Same | Loosened | |
| Credit standards† |
13.1 |
20.2 |
21.2 |
77.9 |
1.0 |
†Added to survey in second quarter 2011.
NOTE: Survey responses are used to calculate an index for each item by subtracting the percentage of bankers reporting less from the percentage reporting greater. Positive index readings generally indicate an increase, while negative index readings generally indicate a decrease.
Tables
| Table 1 Rural Real Estate Values—Second Quarter 2020 |
||||
|---|---|---|---|---|
| Banks1 | Average value2 | Percent change in value from previous year3 | ||
Cropland–Dryland |
||||
|
|
District* |
82 |
2,002 |
2.9 |
|
|
Texas* |
73 |
2,019 |
3.2 |
|
1 |
Northern High Plains |
10 |
944 |
4.1 |
|
2 |
Southern High Plains |
12 |
921 |
1.1 |
|
3 |
Northern Low Plains* |
6 |
862 |
–6.9 |
|
4 |
Southern Low Plains* |
n.a. |
n.a. |
n.a. |
|
5 |
Cross Timbers |
4 |
1,763 |
9.3 |
|
6 |
North Central Texas |
11 |
3,136 |
0.9 |
|
7 |
East Texas* |
5 |
2,959 |
5.2 |
|
8 |
Central Texas |
9 |
4,244 |
10.7 |
|
9 |
Coastal Texas |
3 |
1,900 |
–5.1 |
|
10 |
South Texas |
5 |
2,270 |
–0.5 |
|
11 |
Trans–Pecos and Edwards Plateau |
6 |
3,083 |
4.1 |
|
12 |
Southern New Mexico |
3 |
600 |
10.2 |
|
13 |
Northern Louisiana |
6 |
2,825 |
–5.0 |
Cropland–Irrigated |
||||
|
|
District* |
65 |
2,834 |
1.9 |
|
|
Texas* |
54 |
2,444 |
2.8 |
|
1 |
Northern High Plains |
10 |
2,351 |
1.2 |
|
2 |
Southern High Plains |
12 |
1,769 |
7.7 |
|
3 |
Northern Low Plains* |
5 |
2,178 |
3.3 |
|
4 |
Southern Low Plains |
n.a. |
n.a. |
n.a. |
|
5 |
Cross Timbers |
n.a. |
n.a. |
n.a. |
|
6 |
North Central Texas |
4 |
3,375 |
0.0 |
|
7 |
East Texas |
3 |
3,200 |
0.0 |
|
8 |
Central Texas |
5 |
4,080 |
9.4 |
|
9 |
Coastal Texas |
3 |
2,367 |
–11.5 |
|
10 |
South Texas |
4 |
3,275 |
0.0 |
|
11 |
Trans–Pecos and Edwards Plateau |
5 |
4,310 |
2.8 |
|
12 |
Southern New Mexico |
5 |
5,000 |
1.8 |
|
13 |
Northern Louisiana |
6 |
4,483 |
–3.1 |
Ranchland |
||||
|
|
District* |
85 |
2,243 |
4.0 |
|
|
Texas* |
76 |
2,675 |
4.0 |
|
1 |
Northern High Plains |
10 |
705 |
2.2 |
|
2 |
Southern High Plains |
8 |
763 |
4.9 |
|
3 |
Northern Low Plains |
5 |
940 |
1.4 |
|
4 |
Southern Low Plains* |
n.a. |
n.a. |
n.a. |
|
5 |
Cross Timbers |
5 |
1,920 |
5.5 |
|
6 |
North Central Texas |
11 |
3,359 |
1.7 |
|
7 |
East Texas |
10 |
3,070 |
8.5 |
|
8 |
Central Texas |
9 |
7,111 |
7.2 |
|
9 |
Coastal Texas |
3 |
3,000 |
0.0 |
|
10 |
South Texas |
4 |
2,713 |
5.2 |
|
11 |
Trans–Pecos and Edwards Plateau |
9 |
2,850 |
2.3 |
|
12 |
Southern New Mexico |
4 |
363 |
7.1 |
|
13 |
Northern Louisiana |
5 |
2,750 |
0.0 |
| *Seasonally adjusted. 1 Number of banks reporting land values. 2 Prices are dollars per acre, not adjusted for inflation. 3 Not adjusted for inflation and calculated using responses only from those banks reporting in both the past and current quarter. n.a.—Not published due to insufficient responses but included in totals for Texas and district. |
||||
| Table 2 Interest Rates by Loan Type |
||||
|---|---|---|---|---|
| Feeder cattle | Other farm operating | Intermediate term | Long-term farm real estate | |
| Fixed (average rate, percent) | ||||
|
2019:Q2 |
7.02 |
7.11 |
6.83 |
6.40 |
|
Q3 |
6.90 |
6.89 |
6.71 |
6.42 |
|
Q4 |
6.58 |
6.61 |
6.45 |
6.11 |
|
2020:Q1 |
6.46 |
6.53 |
6.28 |
5.96 |
|
Q2 |
5.81 |
5.91 |
5.80 |
5.58 |
| Variable (average rate, percent) | ||||
|
2019:Q2 |
6.84 |
6.85 |
6.80 |
6.42 |
|
Q3 |
6.58 |
6.59 |
6.50 |
6.21 |
|
Q4 |
6.39 |
6.29 |
6.23 |
5.88 |
|
2020:Q1 |
6.15 |
6.19 |
6.10 |
5.72 |
|
Q2 |
5.38 |
5.49 |
5.45 |
5.16 |
Back issues of Agricultural Survey »
For More Information
Questions regarding the Agricultural Survey can be addressed to Jesus Cañas at Jesus.Canas@dal.frb.org.