Agricultural Survey

Survey Highlights
Bankers responding to the first-quarter survey reported overall better conditions across most regions of the Eleventh District. They noted good crop yields and rising prices, while also expressing caution about continued dry conditions. “Crop prices are encouraging; however, we are still dry, and unless we receive good spring rains, most producers will be looking to insurance early,” said one survey respondent. Cattle sales continue to do well, and demand for rural properties remains strong.
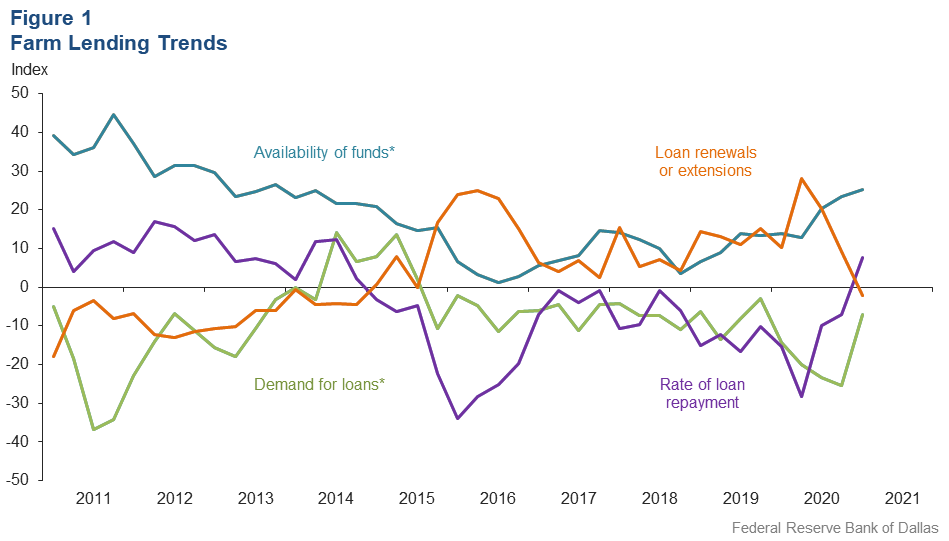
Demand for agricultural loans continued to decline, with the loan demand index registering its 22nd quarter in negative territory. Loan renewals or extensions fell this quarter while the rate of loan repayment increased for the first time since 2014. Loan volume decreased across all major categories compared with a year ago except for farm real estate, non-real-estate farm and operating loans (Figure 1).
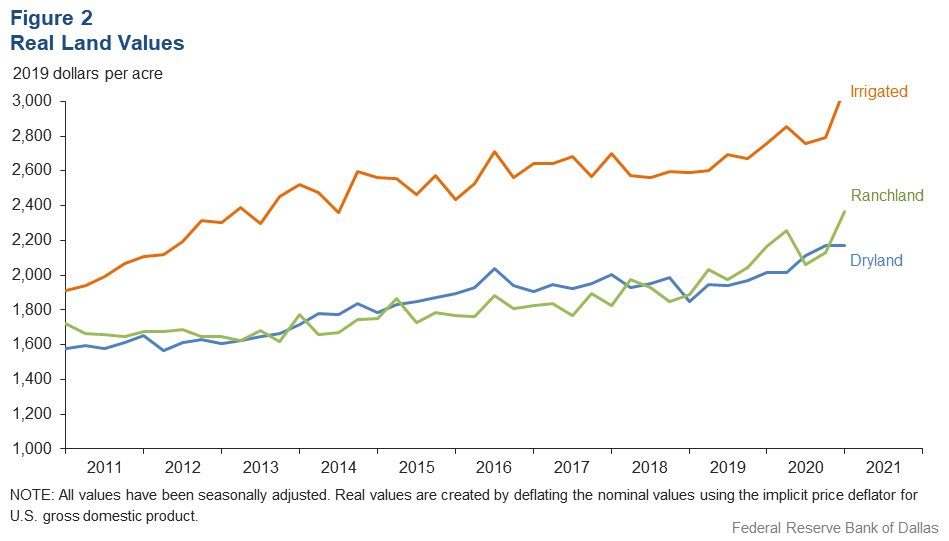
Irrigated and ranchland values increased, but dryland values were flat this quarter (Figure 2). According to bankers who responded in both this quarter and first quarter 2020, nominal irrigated cropland and ranchland values increased year over year in Texas and southern New Mexico (Table 1).
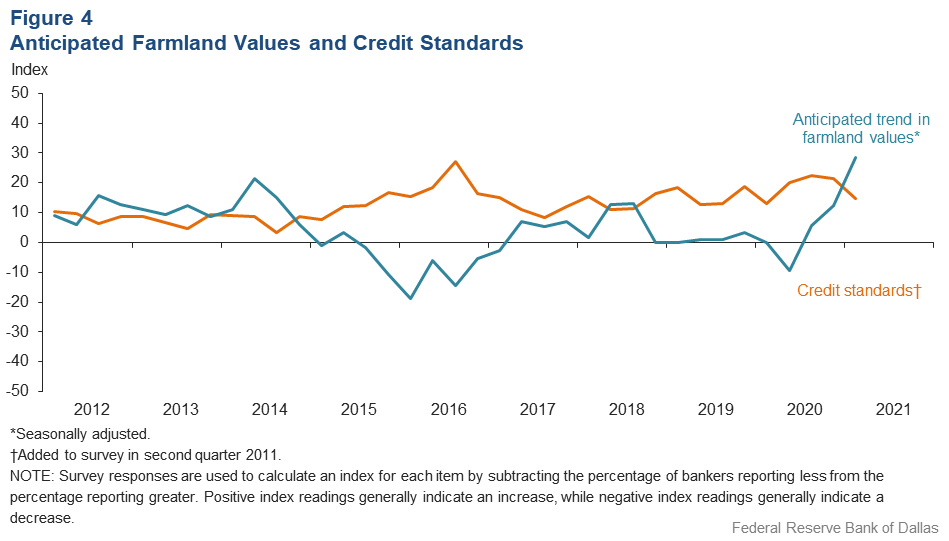
The anticipated trend in farmland values index grew in first quarter 2021, suggesting respondents expect farmland values to continue increasing. The credit standards index remained in positive territory, indicating further tightening of standards on net (Figure 4).
Next release: June 28, 2021
Agricultural Survey is compiled from a survey of Eleventh District agricultural bankers, and data have been seasonally adjusted as necessary. Data were collected March 2–10, and 106 bankers responded to the survey.
Quarterly Comments

District bankers were asked for additional comments concerning agricultural land values and credit conditions. These comments have been edited for publication.
Region 1—Northern High Plains
- Being from the north Panhandle, we survived the cold spell with limited problems. Increased grain and cotton prices are a blessing. Cattle feeders still have a major problem with excessive packer margins. Fat cattle should be bringing $30 per hundredweight more than the current price of $114.
- The 2021 farm outlook is optimistic with improved commodity prices; however, current dry conditions are keeping farmers on guard. Overall though, the moisture in the northern Texas Panhandle has been relatively good for the current La Niña weather pattern, which has historically been drier for this region. The cattle prices are also good for this time of year. A lot of policies with the new presidential administration are up in the air, and the potential impacts to farmers and ranchers are yet to be seen. Banking in general is again cautiously optimistic with declining COVID-19 cases and the reopening of the state of Texas.
- Drought is the primary concern for farm and livestock operations in our area. If spring or early summer rains do not develop, we will see continued liquidation of cow herds and no demand for pasture cattle loans.
Region 2—Southern High Plains
- The Southern High Plains region has experienced severe drought, creating a shortfall of harvested cotton. Sales were strong when available, and with the market rally, not having commodity to market was painful. Opportunities to market the new crop and have a strong insurance price were the lasting benefits. Global demand drivers are needed in order to capitalize on the short supply (expected to be sold by early June) and technically raise the price of cotton on the boards. Outside of the grain market, not much is to be said on the fundamentals influencing planting decisions. A Wildfire and Hurricane Indemnity Program Plus designation for 2020 is warranted for the 42-county area after losing 90 percent of the dryland crop due to the winter storm. Strong safety nets are crucial as many farmers struggle to add net worth after the past seven years of dismal growing conditions, geopolitical concerns and declining natural resources.
- This has been the easiest renewal season in years. This is on the heels of a terrible, drought-stricken crop and poor crop prices last fall. What turned things around? Good crop insurance payouts and a once-in-a-lifetime, almost endless stream of federal ad hoc assistance. While the drought doesn't seem to be changing, it looks like outsized federal supports are on the way out. It was good while it lasted.
- Farm real estate prices have increased in the Lubbock and Shallowater area due to optimism about future commodity prices plus commercial and residential development. Existing residential homes in Lubbock are almost at full capacity. This demand creates room for expansion in rural areas. Drought is still a major concern with no measurable rainfall since last September. The current moisture conditions are the result of freezing rain and snow. It also appears that government price support has improved the agriculture economy over the past two years.
- Income has been up, but it is due to insurance and government payments. Crop prices are encouraging; however, we are still dry, and unless we receive good spring rains, most producers will be looking to insurance early.
Region 3—Northern Low Plains
- The political environment has created unstable commodity prices, and continued drought conditions prevail, causing additional uncertainty in markets. A significant increase in commodities prices is creating an inflationary response of purchasing inputs in anticipation of future price increases.
- Farm commodity prices have increased. The insurance guarantee on cotton looks good at $0.83, but input prices are increasing faster than commodity prices. Our area is still in an extended drought with little underground moisture available and the water level of irrigation wells lower than it has ever been. Pasture conditions are poor. We are not looking at an easy year for agriculture.
- The wheat crop looks good now, and price is good. We will need a good rain soon to finish the crop strong and help producers take advantage of the high grain prices.
Region 6—North Central Texas
- Commodity prices are up and there is lots of “free” stimulus money, but the government can only give to some what they take from others. I am afraid this will have a bad ending.
- We think cattle prices will go up or at least stay stable due to an anticipated better trade environment with China. COVID-19 vaccines appear to be effective, which should help the economy get back on track.
- Core operating returns have gone down for both the farmer and the rancher. Profitability has been supported with government and non-operating monies. This will have to continue for the sustainability of the ag economy.
- The demand for rural properties continues to rise, and there are not many tracts for sale. Smaller tracts in the 10- to 20-acre category are selling for $8,000 to $12,000 per acre.
Region 7—East Texas
- Reported cattle losses due to the recent record cold weather were minimal in the area. Cropland is in good to excellent condition for spring planting. Farmers with corn storage can advance their corn sales significantly due to the recent increase in old-crop corn prices.
- Hay and feed reserves were depleted significantly due to the brutal cold and snowstorm in our area recently. Many ranchers also were affected somewhat by the loss of cattle due to the extreme temperatures.
Region 8—Central Texas
- The winter freeze was hard on everything from people to livestock to plants, but everyone made it through. The snow gave us some much-needed moisture, and hopefully we will have more rain in the near future. Hay is running short for most producers, as older hay is being used up for feed quickly. Some farmers are starting to plant corn at this time, hoping no more freezes will happen. Cattle sales in our area have been extremely strong for better-quality cattle as producers look forward to warmer weather and more grass. The storm does not appear to have hurt winter oats and rye grass, as they have already started to green up. Oil and gas activity is still evident with a couple of rigs running in the area and some new planning for future wells being discussed by producers.
Historical Data
Historical data can be downloaded dating back to first quarter 2000.
Figures
Farm Lending Trends
What changes occurred in non-real-estate farm loans at your bank in the past three months compared with a year earlier?
| Index | Percent reporting, Q1 | ||||
| 2020:Q4 | 2021:Q1 | Greater | Same | Less | |
Demand for loans* | –25.4 | –7.1 | 11.6 | 69.7 | 18.7 |
Availability of funds* | 23.4 | 25.3 | 27.6 | 70.1 | 2.3 |
Rate of loan repayment | –7.1 | 7.6 | 12.0 | 83.7 | 4.4 |
Loan renewals or extensions | 9.1 | –2.2 | 7.7 | 82.4 | 9.9 |

What changes occurred in the volume of farm loans made by your bank in the past three months compared with a year earlier?
| Index | Percent reporting, Q1 | ||||
| 2020:Q4 | 2021:Q1 | Greater | Same | Less | |
Non–real–estate farm loans | –15.0 | 1.1 | 14.0 | 73.1 | 12.9 |
Feeder cattle loans* | –32.3 | –16.7 | 11.1 | 61.1 | 27.8 |
Dairy loans* | –10.8 | –12.9 | 2.3 | 82.5 | 15.2 |
Crop storage loans* | –23.0 | –18.7 | 2.1 | 77.1 | 20.8 |
Operating loans | –10.3 | 0.0 | 11.1 | 77.8 | 11.1 |
Farm machinery loans* | –29.3 | –13.3 | 3.5 | 79.7 | 16.8 |
Farm real estate loans* | –7.2 | 7.0 | 18.5 | 70.0 | 11.5 |
| *Seasonally adjusted. NOTES: Survey responses are used to calculate an index for each item by subtracting the percentage of bankers reporting less from the percentage reporting greater. Positive index readings generally indicate an increase, while negative index readings generally indicate a decrease. |
|||||
Real Land Values

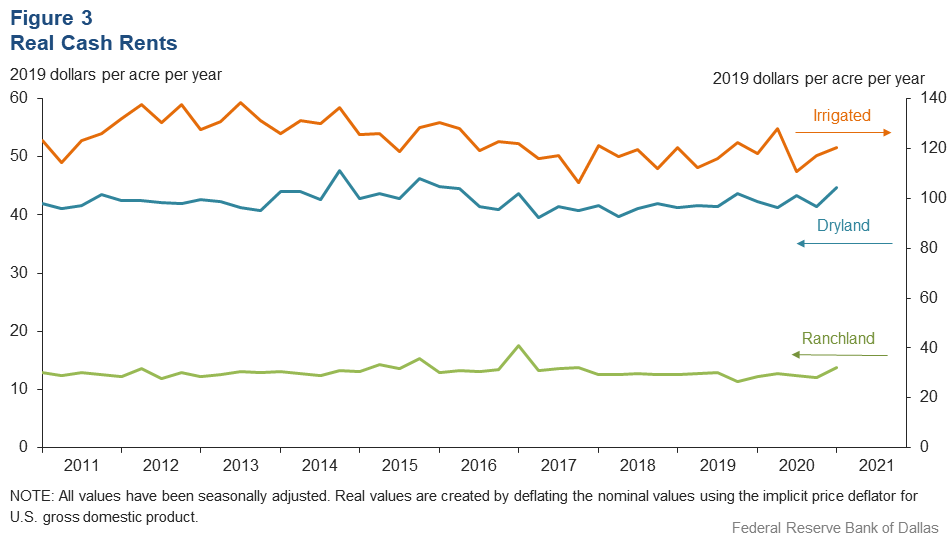
Real Cash Rents

Anticipated Farmland Values and Credit Standards
What trend in farmland values do you expect in your area in the next three months?
| Index | Percent reporting, Q1 | ||||
| 2020:Q4 | 2021:Q1 | Up | Same | Down | |
| Anticipated trend in farmland values* | 12.3 | 28.6 | 29.0 | 70.6 | 0.4 |
What change occurred in credit standards for agricultural loans at your bank in the past three months compared with a year earlier?†
| 2020:Q4 | 2021:Q1 | Up | Same | Down | |
| Credit standards | 21.4 | 14.9 | 14.9 | 85.1 | 0.0 |

Tables
Rural Real Estate Values—First Quarter 2021
| Banks1 | Average value2 | Percent change in value from previous year3 | ||
Cropland–Dryland | ||||
| District* | 75 | 2,196 | 6.8 |
| Texas* | 65 | 2,220 | 7.7 |
1 | Northern High Plains | 11 | 958 | 2.8 |
2 | Southern High Plains | 8 | 938 | –5.0 |
3 | Northern Low Plains* | 4 | 951 | 6.8 |
4 | Southern Low Plains* | 3 | 1,029 | –3.2 |
5 | Cross Timbers | 4 | 1,813 | 4.3 |
6 | North Central Texas | 8 | 3,738 | 9.5 |
7 | East Texas* | 6 | 3,485 | 17.6 |
8 | Central Texas | 10 | 5,445 | 16.0 |
9 | Coastal Texas | 3 | 2,167 | 14.1 |
10 | South Texas | n.a. | n.a. | n.a. |
11 | Trans–Pecos and Edwards Plateau | 6 | 2,742 | –5.3 |
12 | Southern New Mexico | 3 | 625 | 4.2 |
13 | Northern Louisiana | 7 | 3,021 | –9.2 |
Cropland–Irrigated | ||||
| District* | 63 | 3,112 | 8.3 |
| Texas* | 52 | 2,532 | 5.5 |
1 | Northern High Plains | 11 | 2,186 | 3.6 |
2 | Southern High Plains | 8 | 1,906 | 11.6 |
3 | Northern Low Plains* | 3 | 2,651 | 4.9 |
4 | Southern Low Plains | 3 | 1,533 | –4.2 |
5 | Cross Timbers | n.a. | n.a. | n.a. |
6 | North Central Texas | 5 | 3,700 | 1.6 |
7 | East Texas | 4 | 4,500 | 26.4 |
8 | Central Texas | 6 | 6,017 | 4.6 |
9 | Coastal Texas | 3 | 2,450 | 4.8 |
10 | South Texas | 3 | 3,733 | 7.7 |
11 | Trans–Pecos and Edwards Plateau | 4 | 3,750 | –5.9 |
12 | Southern New Mexico | 4 | 7,200 | 22.6 |
13 | Northern Louisiana | 7 | 4,621 | 2.9 |
Ranchland | ||||
| District* | 80 | 2,393 | 8.9 |
| Texas* | 69 | 2,853 | 9.1 |
1 | Northern High Plains | 11 | 757 | –4.7 |
2 | Southern High Plains | 6 | 921 | 1.9 |
3 | Northern Low Plains | 4 | 925 | 5.6 |
4 | Southern Low Plains* | 3 | 1,200 | –1.4 |
5 | Cross Timbers | 5 | 1,960 | 2.1 |
6 | North Central Texas | 8 | 3,650 | 4.5 |
7 | East Texas | 9 | 3,317 | 11.2 |
8 | Central Texas | 10 | 8,010 | 14.6 |
9 | Coastal Texas | n.a. | n.a. | n.a. |
10 | South Texas | 3 | 3,333 | 30.7 |
11 | Trans–Pecos and Edwards Plateau | 8 | 2,775 | 4.9 |
12 | Southern New Mexico | 5 | 409 | 6.3 |
13 | Northern Louisiana | 6 | 2,342 | 0.0 |
| *Seasonally adjusted. 1 Number of banks reporting land values. 2 Prices are dollars per acre, not adjusted for inflation. 3 Not adjusted for inflation and calculated using responses only from those banks reporting in both the past and current quarter. n.a.—Not published due to insufficient responses but included in totals for Texas and district. |
||||
Interest Rates by Loan Type—First Quarter 2021
| Feeder cattle | Other farm operating | Intermediate term | Long-term farm real estate | Fixed (average rate, percent) |
2020:Q1 | 6.46 | 6.53 | 6.28 | 5.96 |
2020:Q2 | 5.81 | 5.91 | 5.80 | 5.58 |
2020:Q3 | 5.71 | 5.80 | 5.69 | 5.33 |
2020:Q4 | 5.67 | 5.78 | 5.60 | 5.17 |
2021:Q1 | 5.77 | 5.76 | 5.55 | 5.13 | Variable (average rate, percent) |
2020:Q1 | 6.15 | 6.19 | 6.10 | 5.72 |
2020:Q2 | 5.38 | 5.49 | 5.45 | 5.16 |
2020:Q3 | 5.39 | 5.43 | 5.32 | 4.97 |
2020:Q4 | 5.36 | 5.41 | 5.35 | 4.91 |
2021:Q1 | 5.32 | 5.33 | 5.22 | 4.95 |
For More Information
Questions regarding the Agricultural Survey can be addressed to Jesus Cañas at Jesus.Canas@dal.frb.org.