Agricultural Survey

Survey Highlights
Bankers responding to the third-quarter survey reported improved conditions across most regions of the Eleventh District. Survey respondents noted that rainfall and moisture have contributed to above-average crop yields so far this year. “This could be the best crop year we have had in several years,” a survey respondent said. Commodity prices are favorable for cattle and crop producers. Real estate values are increasing as people from the cities continue to migrate to the rural areas.
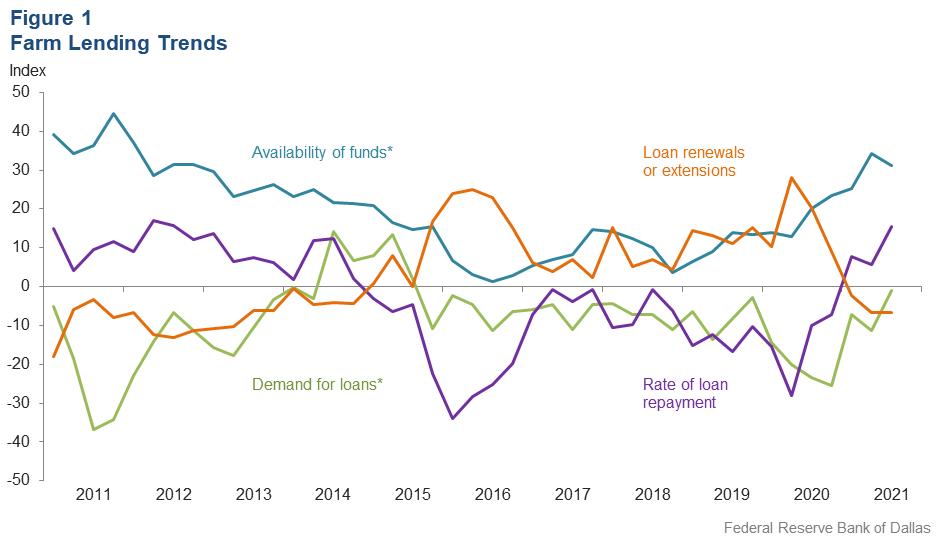
Demand for agricultural loans continued to decline, with the loan demand index registering its 24th quarter in negative territory; however, demand growth increased considerably from the second quarter as the loan demand index improved to -1.0 from -11.2. Loan renewals or extensions fell for the third quarter in a row, while the rate of loan repayment continued to increase. Loan volume decreased across most major categories compared with a year ago, except for operating loans, farm real estate and machinery loans (Figure 1).
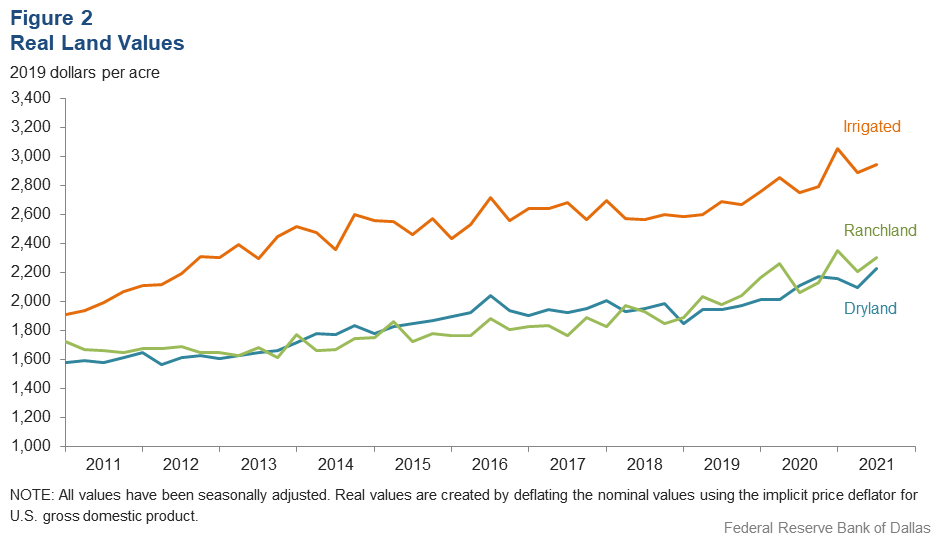
Irrigated, dryland and ranchland values rose this quarter (Figure 2). According to bankers who responded in both this quarter and third quarter 2020, irrigated cropland and ranchland values increased year over year in Texas, southern New Mexico and northern Louisiana (Table 1).
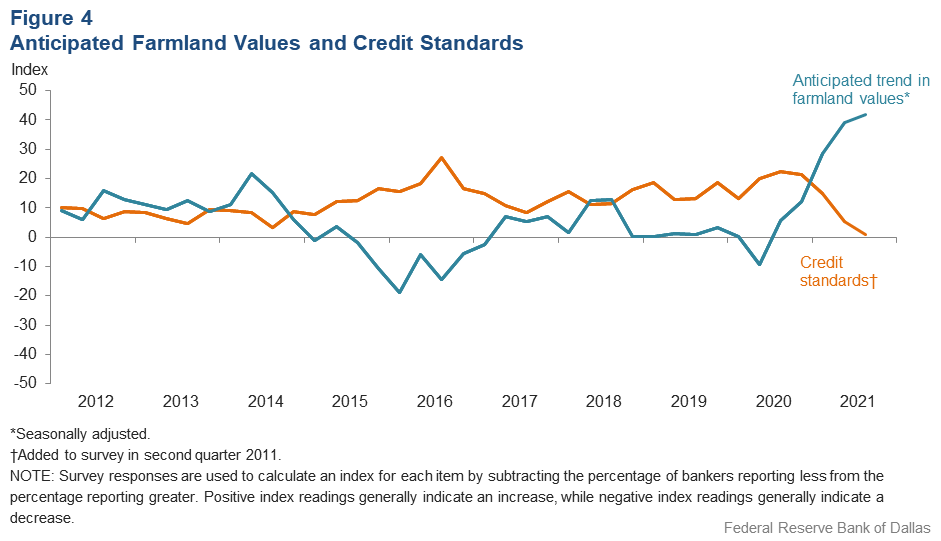
The anticipated trend in farmland values index grew in the third quarter to reach yet another historical high, suggesting respondents expect farmland values to continue increasing. The credit standards index fell for the fourth consecutive quarter but remained in positive territory. The continued positive value of the index indicates further tightening of standards on net (Figure 4).
Next release: January 3, 2022
Agricultural Survey is compiled from a survey of Eleventh District agricultural bankers, and data have been seasonally adjusted as necessary. Data were collected Sept. 7–15, and 94 bankers responded to the survey.
Quarterly Comments

District bankers were asked for additional comments concerning agricultural land values and credit conditions. These comments have been edited for publication.
Region 1—Northern High Plains
- Rainfall has been abundant. Silage, corn and grain sorghum yields well above average are anticipated.
- Summer crops look good. We are probably a couple of weeks away from the beginning of both corn and milo harvest. Milo is early this year. Most of our customers have taken advantage of the market volatility and are already priced. There is quite a bit of ag land changing hands right now, and the values are rising. We need some moisture to aid in dryland wheat growth or we will miss out on fall grazing.
- We think we have a great corn and cotton crop in the field and will be excited to get it harvested. Very little wheat has been planted at this time due to dry weather. Most customers are telling stories of shortages and higher cost on supplies. Fuel and fertilizer costs have seen the biggest price increase, and they are the two top input costs for farmers.
- The summer heat in the high plains was mostly bearable save for a few sporadic weeks. Moisture for some was abundant while others missed out. In the banking side of agriculture, we have kept a close eye on crop expenses and cash flows. At least in this area we haven't seen the need for an increase in lines of credit for operating expenses. Our customers have been able to stay within the cash flows that were projected early in the year. With some bumping their max line now, silage and harvest around the corner is a welcome sight for the income stream. We expect many in this area to have fantastic yields across the board with their fall crops of corn, sorghum and cotton. Many of our producers have already begun forward purchasing of inputs for next year: seed, fertilizer, chemical, etc. We will be taking a close look at renewals after the first of the year and stress testing for rate and commodity prices and yields.
Region 2—Southern High Plains
- All crops are above average so far this year. If we can get through harvest, this could be the best crop year we have had in several years. Cattle prices have fluctuated a lot lately, but the pasture grasses have had some needed moisture, and it helps to be able to hold the herd until prices rebound.
- After rains fell in early June, crop is about two weeks behind but is extremely good in most areas. There are some weak spots but overall one of the better crops in many years. Dryland will be much better, and prices seem to be holding in most commodities.
Region 3—Northern Low Plains
- We need rain. Crops look good, but dryland needs moisture to finish out. Pasture conditions have declined, and producers have began supplemental feeding. Commodity prices are still a bright spot for cattle and crop producers.
Region 4—Southern Low Plains
- Cotton crop looks great, but it will need rain soon. Livestock markets are strong provided you have quality livestock.
- We see wide ranges of prices on all categories of land.
Region 5—Cross Timbers
- Real estate values shown are above average, but some smaller tracts have been selling for $6,000 to $10,000 per acre based on recreational value. Actual farm-/ranch-sized tracts are still in the $3,000 to $3,500 range per acre. Credit conditions are tight but stable. Banks are willing to fund ag loans with sound credit, cash flow, collateral and operator. Cattle, sheep and goat as well as pecan markets have been strong despite dry conditions locally.
Region 6—North Central Texas
- Wheat looked great early but got too much rain. Corn has had good average yields, and the price has been better than years past. With the Paycheck Protection Program loans and government money, the ag producers should fair pretty well this year.
- There are not many ag properties for sale. It is a seller’s market.
Region 8—Central Texas
- Land prices continue to remain strong, as people from the cities continue to migrate to the rural areas. Small tracts from five to 20 acres are at all-time highs, with demand exceeding supply levels. Several oil and gas companies continue to make new wells in the area. Cattle prices remain strong, with grass and water still in good supply. Winter wheat and oat planting is to begin soon. Hay numbers are good so far, but everyone still wants to make more for the winter.
Region 9—Coastal Texas
- What started out to be a bumper crop was damaged by all the rain. Upon harvest, the yield was better than expected and, in some cases, not hurt at all. Overall, we think that 2021 will be a fairly good year with only a few farms showing stress. As always, good farmers seem to always do well, and the poor farmers struggle.
Region 11—Trans-Pecos and Edwards Plateau
- Most ranchers have received some rainfall though it has mostly varied from good to marginal. Livestock is in average condition with market values remaining good. Predators remain a problem, with a few sheep and goat producers moving more to cattle due to predation losses. Hunting lease revenue remains a vital part of ranching income. Deer numbers have recovered some from the area's 2019 anthrax losses.
Region 12—Southern New Mexico
- The drought is over. A number of hay producers said quality was affected by the rain.
Region 13—Northern Louisiana
- Thankfully, our area has not been hit very hard so far this hurricane season. The corn harvest is almost completed. The yields this year are among the better yields for farmers in a very long time.
Historical Data
Historical data can be downloaded dating back to first quarter 2000.
Figures
Farm Lending Trends
What changes occurred in non-real-estate farm loans at your bank in the past three months compared with a year earlier?
| Index | Percent reporting, Q3 | ||||
| 2021:Q2 | 2021:Q3 | Greater | Same | Less | |
Demand for loans* | –11.2 | –1.0 | 22.5 | 54.0 | 23.5 |
Availability of funds* | 34.3 | 31.2 | 31.2 | 68.8 | 0.0 |
Rate of loan repayment | 5.7 | 15.6 | 17.8 | 80.0 | 2.2 |
Loan renewals or extensions | –6.7 | –6.7 | 4.4 | 84.4 | 11.1 |

What changes occurred in the volume of farm loans made by your bank in the past three months compared with a year earlier?
| Index | Percent reporting, Q3 | ||||
| 2021:Q2 | 2021:Q3 | Greater | Same | Less | |
Non–real–estate farm loans | –1.1 | 6.6 | 19.8 | 67.0 | 13.2 |
Feeder cattle loans* | –12.8 | –14.2 | 8.7 | 68.4 | 22.9 |
Dairy loans* | 3.7 | –10.2 | 3.2 | 83.4 | 13.4 |
Crop storage loans* | –9.0 | –20.5 | 4.3 | 70.9 | 24.8 |
Operating loans | 6.8 | 5.6 | 16.9 | 71.9 | 11.2 |
Farm machinery loans* | –9.7 | 0.1 | 14.3 | 71.5 | 14.2 |
Farm real estate loans* | 9.1 | 8.8 | 18.6 | 71.6 | 9.8 |
| *Seasonally adjusted. NOTES: Survey responses are used to calculate an index for each item by subtracting the percentage of bankers reporting less from the percentage reporting greater. Positive index readings generally indicate an increase, while negative index readings generally indicate a decrease. |
|||||
Real Land Values

Real Cash Rents

Anticipated Farmland Values and Credit Standards
What trend in farmland values do you expect in your area in the next three months?
| Index | Percent reporting, Q3 | ||||
| 2021:Q2 | 2021:Q3 | Up | Same | Down | |
| Anticipated trend in farmland values* | 39.0 | 42.0 | 42.1 | 57.8 | 0.1 |
What change occurred in credit standards for agricultural loans at your bank in the past three months compared with a year earlier?†
| 2021:Q2 | 2021:Q3 | Up | Same | Down | |
| Credit standards | 5.5 | 1.1 | 4.4 | 92.4 | 3.3 |

Tables
Rural Real Estate Values—Third Quarter 2021
| Banks1 | Average value2 | Percent change in value from previous year3 | ||
Cropland–Dryland | ||||
| District* | 76 | 2,327 | 11.9 |
| Texas* | 68 | 2,328 | 11.6 |
1 | Northern High Plains | 11 | 973 | 1.1 |
2 | Southern High Plains | 8 | 981 | 0.7 |
3 | Northern Low Plains* | 4 | 940 | 5.6 |
4 | Southern Low Plains* | 4 | 1,824 | 24.9 |
5 | Cross Timbers | 4 | 1,750 | 2.2 |
6 | North Central Texas | 7 | 3,900 | 16.5 |
7 | East Texas* | 4 | 3,123 | 17.1 |
8 | Central Texas | 14 | 5,550 | 13.0 |
9 | Coastal Texas | 5 | 2,420 | 19.1 |
10 | South Texas | 3 | 2,367 | 8.4 |
11 | Trans–Pecos and Edwards Plateau | 4 | 2,675 | 0.0 |
12 | Southern New Mexico | n.a. | n.a. | n.a. |
13 | Northern Louisiana | 6 | 3,742 | 17.6 |
Cropland–Irrigated | ||||
| District* | 57 | 3,078 | 6.5 |
| Texas* | 48 | 2,506 | 6.4 |
1 | Northern High Plains | 11 | 2,327 | 4.1 |
2 | Southern High Plains | 8 | 1,863 | 13.4 |
3 | Northern Low Plains* | 3 | 2,136 | –5.9 |
4 | Southern Low Plains | 3 | 3,233 | 0.0 |
5 | Cross Timbers | n.a. | n.a. | n.a. |
6 | North Central Texas | 3 | 4,667 | 12.0 |
7 | East Texas | 3 | 3,733 | 34.1 |
8 | Central Texas | 7 | 4,129 | 10.0 |
9 | Coastal Texas | 3 | 2,133 | 0.0 |
10 | South Texas | 3 | 3,333 | 4.2 |
11 | Trans–Pecos and Edwards Plateau | n.a. | n.a. | n.a. |
12 | Southern New Mexico | 3 | 6,667 | 8.1 |
13 | Northern Louisiana | 6 | 5,075 | 4.5 |
Ranchland | ||||
| District* | 80 | 2,402 | 16.8 |
| Texas* | 73 | 2,866 | 17.4 |
1 | Northern High Plains | 11 | 766 | 7.2 |
2 | Southern High Plains | 8 | 872 | 9.5 |
3 | Northern Low Plains | 4 | 900 | 14.2 |
4 | Southern Low Plains* | 4 | 1,944 | 16.1 |
5 | Cross Timbers | 5 | 2,040 | 5.7 |
6 | North Central Texas | 7 | 4,875 | 19.7 |
7 | East Texas | 8 | 3,381 | 16.8 |
8 | Central Texas | 13 | 7,692 | 12.8 |
9 | Coastal Texas | 4 | 3,088 | 5.7 |
10 | South Texas | 3 | 3,000 | 8.4 |
11 | Trans–Pecos and Edwards Plateau | 6 | 2,633 | 31.6 |
12 | Southern New Mexico | 3 | 392 | 0.5 |
13 | Northern Louisiana | 4 | 2,413 | 0.0 |
| *Seasonally adjusted. 1 Number of banks reporting land values. 2 Prices are dollars per acre, not adjusted for inflation. 3 Not adjusted for inflation and calculated using responses only from those banks reporting in both the past and current quarter. n.a.—Not published due to insufficient responses but included in totals for Texas and district. |
||||
Interest Rates by Loan Type—Third Quarter 2021
| Feeder cattle | Other farm operating | Intermediate term | Long-term farm real estate | Fixed (average rate, percent) |
2020:Q3 | 5.71 | 5.80 | 5.69 | 5.33 |
2020:Q4 | 5.67 | 5.78 | 5.60 | 5.17 |
2021:Q1 | 5.77 | 5.76 | 5.55 | 5.13 |
2021:Q2 | 5.65 | 5.67 | 5.53 | 5.20 |
2021:Q3 | 5.55 | 5.61 | 5.45 | 5.15 | Variable (average rate, percent) |
2020:Q3 | 5.39 | 5.43 | 5.32 | 4.97 |
2020:Q4 | 5.36 | 5.41 | 5.35 | 4.91 |
2021:Q1 | 5.32 | 5.33 | 5.22 | 4.95 |
2021:Q2 | 5.33 | 5.31 | 5.24 | 5.00 |
2021:Q3 | 5.23 | 5.31 | 5.23 | 4.93 |
For More Information
Questions regarding the Agricultural Survey can be addressed to Jesus Cañas at Jesus.Canas@dal.frb.org.