Agricultural Survey

Survey Highlights
Bankers responding to the fourth-quarter survey reported improved conditions across most regions of the Eleventh District. Survey respondents noted record yields and prices for corn and cotton crops. However, they also noted extremely dry conditions and increased input costs as major concerns for 2022. “It looks like increases in the cost of goods and services related to producing crops in 2022 will greatly reduce net profits even with crop prices above normal,” said one survey respondent. Strong demand for agricultural real estate continues, with rural real estate prices increasing almost weekly in some regions.
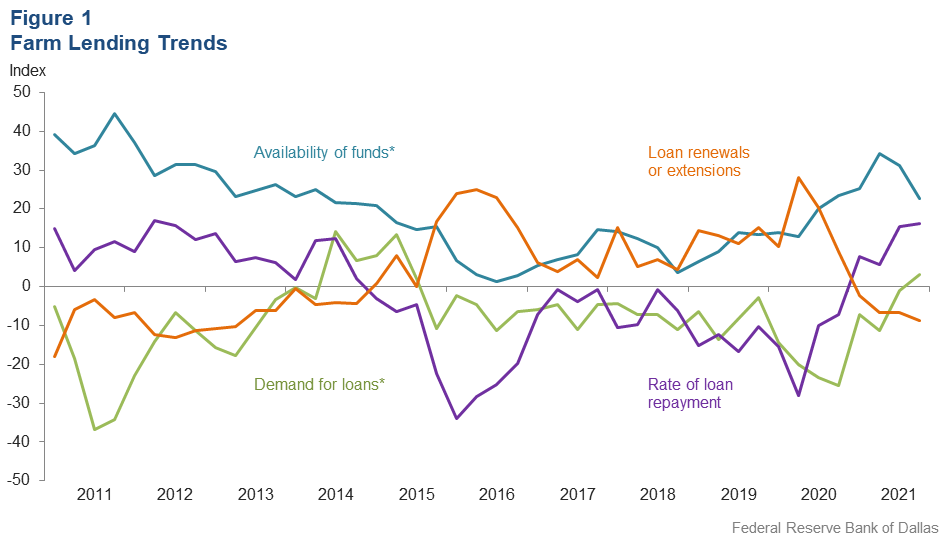
Demand for agricultural loans increased for the first time since third quarter 2015 as the loan demand index improved to 3.1 from -1.0 in the previous quarter. Loan renewals or extensions fell for the fourth quarter in a row, while the rate of loan repayment continued to increase. Loan volume decreased for feeder cattle loans, dairy loans and crop storage loans compared with a year ago (Figure 1).
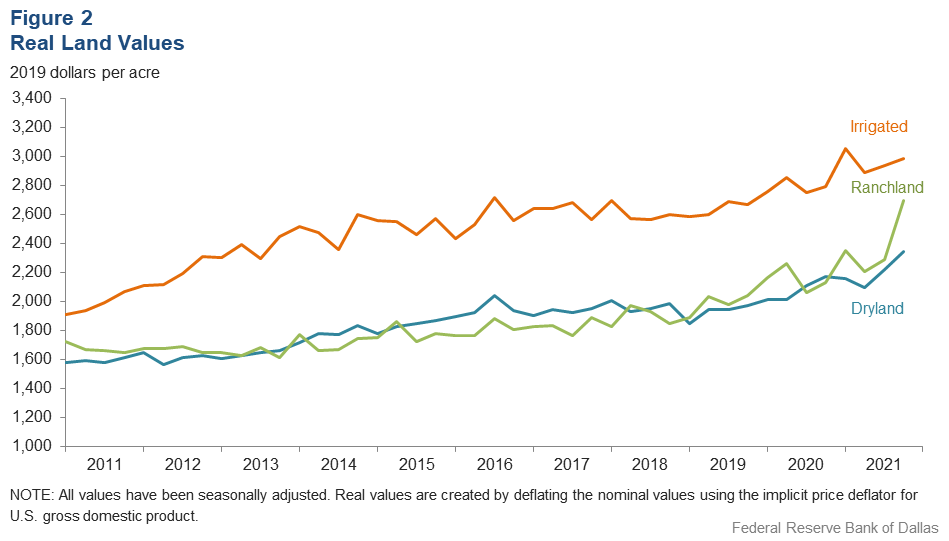
Irrigated, dryland and ranchland values rose this quarter (Figure 2). According to bankers who responded in both this quarter and fourth quarter 2020, irrigated cropland and ranchland values increased year over year in Texas and southern New Mexico (Table 1).
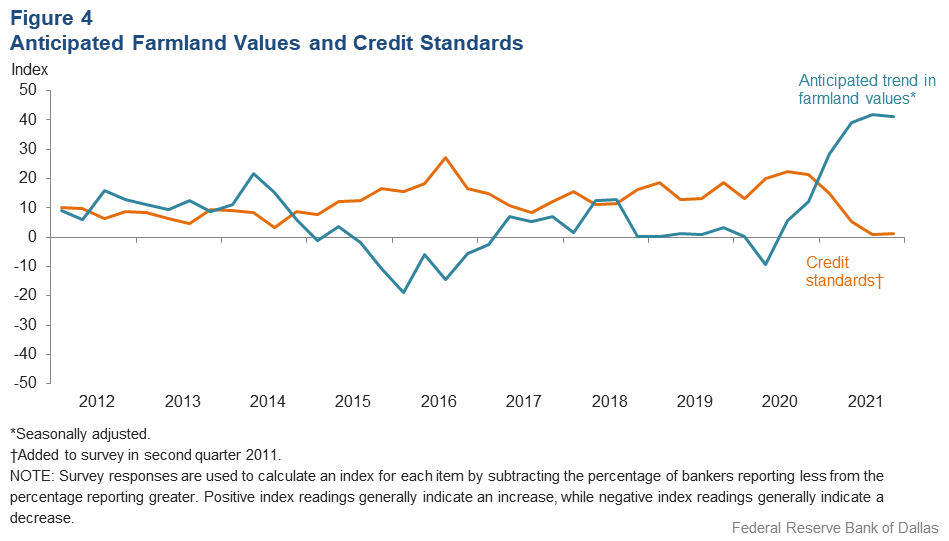
The anticipated trend in farmland values index grew in the fourth quarter, suggesting respondents expect farmland values to continue increasing. The credit standards index was flat and remained in positive territory (Figure 4).
Next release: March 28, 2022
Agricultural Survey is compiled from a survey of Eleventh District agricultural bankers, and data have been seasonally adjusted as necessary. Data were collected Dec. 7–14, and 83 bankers responded to the survey.
Quarterly Comments

District bankers were asked for additional comments concerning agricultural land values and credit conditions. These comments have been edited for publication.
Region 1—Northern High Plains
- Extreme dry conditions are negatively impacting winter wheat and limiting wheat grazing. Dry conditions and increased input costs are major concerns as we enter 2022.
- The year 2021 has been profitable for most farmers and ranchers. However, early cash-flow projections for 2022 are break-even at best. Inflation has become a problem. Input prices are across the board higher than last year, and some are up to 50 percent. We are seeing lots of shortages and backorders on parts and supplies.
- This is shaping up to be a very good year; however, the expected rise in input costs for next year coupled with current drought conditions leaves our expectations for next year as very poor.
- There have been dry conditions, very limited wheat pasture and a dramatic increase in all input costs.
- Drought is the major concern in our area. We are having atypical warm weather with very dry conditions. Fire danger is high. Wheat pasture conditions are poor unless irrigated.
Region 2—Southern High Plains
- Crop production is up, and cotton prices are very good. Therefore, operating loans should pay off in full. Cattle prices are down some and hopefully will rebound early next year.
- Real estate sales have greatly improved over the past two years. There have been major price increases in cotton and grains and better-than-normal yields. The local ag economy should be excellent this year. However, it looks like increases in the cost of goods and services related to producing crops in 2022 will greatly reduce net profits even with crop prices above normal. According to a local supplier, seed, fertilizer, herbicides and fuel could add up to 30 percent to this year’s cost of production. Cotton and grain prices will be above five-year averages next year but less than prices observed in 2021.
- The crops have been extremely good. Some areas are not as strong as others but are much better than previous years. Fortunately farmers are getting high prices and will offset bad yields for some producers. It continues to be dry, and we will need some winter moisture soon.
Region 3—Northern Low Plains
- Commodity prices are good, but their increase has not kept pace with the increase in fertilizer and chemical prices and crop insurance premiums. Wheat and pasture conditions are poor, and wheat may not rebound with rain. Cattle are being supplemented with hay; feed prices are high. Sufficient hay was produced over the summer to meet current needs. It’s been over 60 days without any significant rainfall; we need rain.
- We are very dry. No wheat pastures this year. Most wheat is dry planted and not sprouted. Pastures are getting thin. No winter grass has emerged yet. Stock water is getting low. We could see some liquidation of cows within 90 days if we don’t get needed rain.
Region 5—Cross Timbers
- Real estate values of all types are increasing over time with average prices consistently reported around $3,000 per acre. However, recent transactions indicate that $4,000 is market value for larger tracts, with smaller tracts selling for $10,000 or more per acre.
- Cotton harvest is moving along. Small grains need rain.
Region 6—North Central Texas
- Land values are going up fast as Samsung announced its [plans to build in the] Taylor location. We are going to lose a lot of tillable land.
- We had good yields and prices for corn and cotton crops. Cattle prices are good.
- Smaller tracts of unimproved land have sold recently (<20 acres) in the $12,000 to $15,000 [range]. The demand for this type of property has increased with the limited supply, so prices are increasing dramatically.
Region 7—East Texas
- There is strong demand for ag real estate.
- Cotton harvest is complete with record yields and very high prices. Fertilizer prices are anticipated to be much higher as well as chemicals. This could affect the crop mix, and it is too early to make any decisions. The area needs rain for pastures and small-grains fields. Rural real estate prices are increasing almost weekly in the western portion of the area.
Region 8—Central Texas
- The weather has been unseasonably warm, which has been great for ranchers, with green grass and no hay having to be fed yet, but we could use additional rains. Oats and rye grass are looking good. The biggest problem producers are facing at this time is fertilizer cost, which could have a big effect on producers in the spring. There’s lots of talk about switching to chicken manure, but it is a limited supply and is not much cheaper than commercial fertilizer. Two oil companies in the area are still drilling and completing new wells.
Region 11—Trans-Pecos and Edwards Plateau
- Pasture conditions are dry, and the outlook for needed rainfall is not promising going into winter. A lot of higher-dollar feed will be used, which will adversely affect net income. The markets have been positive with consistent record prices on sheep and goats and improved cattle prices. Hopefully, the sales values can offset the additional feed costs many are looking at. Predators remain a problem.
Historical Data
Historical data can be downloaded dating back to first quarter 2000.
Figures
Farm Lending Trends
What changes occurred in non-real-estate farm loans at your bank in the past three months compared with a year earlier?
| Index | Percent reporting, Q4 | ||||
| 2021:Q3 | 2021:Q4 | Greater | Same | Less | |
Demand for loans* | –1.0 | 3.1 | 19.4 | 64.3 | 16.3 |
Availability of funds* | 31.2 | 22.6 | 25.6 | 71.4 | 3.0 |
Rate of loan repayment | 15.6 | 16.3 | 20.0 | 76.3 | 3.8 |
Loan renewals or extensions | –6.7 | –8.8 | 3.8 | 83.8 | 12.5 |

What changes occurred in the volume of farm loans made by your bank in the past three months compared with a year earlier?
| Index | Percent reporting, Q4 | ||||
| 2021:Q3 | 2021:Q4 | Greater | Same | Less | |
Non–real–estate farm loans | 6.6 | 0.0 | 18.1 | 63.9 | 18.1 |
Feeder cattle loans* | –14.2 | –15.4 | 4.9 | 74.8 | 20.3 |
Dairy loans* | –10.2 | –11.6 | 3.2 | 82.0 | 14.8 |
Crop storage loans* | –20.5 | –6.5 | 5.0 | 83.5 | 11.5 |
Operating loans | 5.6 | 2.5 | 12.4 | 77.8 | 9.9 |
Farm machinery loans* | 0.1 | 0.4 | 12.3 | 75.8 | 11.9 |
Farm real estate loans* | 8.8 | 12.2 | 17.4 | 77.4 | 5.2 |
| *Seasonally adjusted. NOTES: Survey responses are used to calculate an index for each item by subtracting the percentage of bankers reporting less from the percentage reporting greater. Positive index readings generally indicate an increase, while negative index readings generally indicate a decrease. |
|||||
Real Land Values

Real Cash Rents

Anticipated Farmland Values and Credit Standards
What trend in farmland values do you expect in your area in the next three months?
| Index | Percent reporting, Q4 | ||||
| 2021:Q3 | 2021:Q4 | Up | Same | Down | |
| Anticipated trend in farmland values* | 42.0 | 41.3 | 41.3 | 58.7 | 0.0 |
What change occurred in credit standards for agricultural loans at your bank in the past three months compared with a year earlier?†
| 2021:Q3 | 2021:Q4 | Up | Same | Down | |
| Credit standards | 1.1 | 1.2 | 4.9 | 91.5 | 3.7 |

Tables
Rural Real Estate Values—Fourth Quarter 2021
| Banks1 | Average value2 | Percent change in value from previous year3 | ||
Cropland–Dryland | ||||
| District* | 64 | 2,480 | 15.4 |
| Texas* | 59 | 2,523 | 15.7 |
1 | Northern High Plains | 10 | 993 | 3.7 |
2 | Southern High Plains | 8 | 1,006 | 7.9 |
3 | Northern Low Plains* | 3 | 952 | 9.6 |
4 | Southern Low Plains* | 3 | 1,377 | 11.1 |
5 | Cross Timbers | 4 | 2,906 | 30.7 |
6 | North Central Texas | 7 | 4,000 | 17.9 |
7 | East Texas* | 3 | 3,869 | 8.3 |
8 | Central Texas | 9 | 6,922 | 31.1 |
9 | Coastal Texas | 3 | 2,200 | 17.8 |
10 | South Texas | n.a. | n.a. | n.a. |
11 | Trans–Pecos and Edwards Plateau | 7 | 3,271 | 13.0 |
12 | Southern New Mexico | 3 | 633 | 3.3 |
13 | Northern Louisiana | n.a. | n.a. | n.a. |
Cropland–Irrigated | ||||
| District* | 51 | 3,156 | 10.9 |
| Texas* | 45 | 2,597 | 10.4 |
1 | Northern High Plains | 10 | 2,250 | 11.1 |
2 | Southern High Plains | 8 | 2,031 | 9.2 |
3 | Northern Low Plains* | n.a. | n.a. | n.a. |
4 | Southern Low Plains | 3 | 2,233 | 0.0 |
5 | Cross Timbers | 3 | 3,025 | 16.5 |
6 | North Central Texas | 3 | 5,000 | 12.8 |
7 | East Texas | n.a. | n.a. | n.a. |
8 | Central Texas | 4 | 4,675 | 3.3 |
9 | Coastal Texas | n.a. | n.a. | n.a. |
10 | South Texas | n.a. | n.a. | n.a. |
11 | Trans–Pecos and Edwards Plateau | 6 | 4,367 | 11.6 |
12 | Southern New Mexico | 4 | 7,375 | 11.1 |
13 | Northern Louisiana | n.a. | n.a. | n.a. |
Ranchland | ||||
| District* | 72 | 2,852 | 24.1 |
| Texas* | 66 | 3,424 | 24.9 |
1 | Northern High Plains | 10 | 790 | 3.3 |
2 | Southern High Plains | 7 | 943 | 10.9 |
3 | Northern Low Plains | 3 | 917 | 10.1 |
4 | Southern Low Plains* | 3 | 1,778 | 46.2 |
5 | Cross Timbers | 5 | 2,965 | 24.4 |
6 | North Central Texas | 7 | 5,089 | 27.2 |
7 | East Texas | 6 | 4,000 | 12.1 |
8 | Central Texas | 9 | 9,578 | 22.3 |
9 | Coastal Texas | 3 | 2,100 | 0.0 |
10 | South Texas | 4 | 2,875 | 16.1 |
11 | Trans–Pecos and Edwards Plateau | 9 | 3,672 | 37.8 |
12 | Southern New Mexico | 4 | 388 | 2.6 |
13 | Northern Louisiana | n.a. | n.a. | n.a. |
| *Seasonally adjusted. 1 Number of banks reporting land values. 2 Prices are dollars per acre, not adjusted for inflation. 3 Not adjusted for inflation and calculated using responses only from those banks reporting in both the past and current quarter. n.a.—Not published due to insufficient responses but included in totals for Texas and district. |
||||
Interest Rates by Loan Type—Fourth Quarter 2021
| Feeder cattle | Other farm operating | Intermediate term | Long-term farm real estate | Fixed (average rate, percent) |
2020:Q4 | 5.67 | 5.78 | 5.60 | 5.17 |
2021:Q1 | 5.77 | 5.76 | 5.55 | 5.13 |
2021:Q2 | 5.65 | 5.67 | 5.53 | 5.20 |
2021:Q3 | 5.55 | 5.61 | 5.45 | 5.15 |
2021:Q4 | 5.59 | 5.61 | 5.48 | 5.19 | Variable (average rate, percent) |
2020:Q4 | 5.36 | 5.41 | 5.35 | 4.91 |
2021:Q1 | 5.32 | 5.33 | 5.22 | 4.95 |
2021:Q2 | 5.33 | 5.31 | 5.24 | 5.00 |
2021:Q3 | 5.23 | 5.31 | 5.23 | 4.93 |
2021:Q4 | 5.40 | 5.38 | 5.33 | 4.96 |
For More Information
Questions regarding the Agricultural Survey can be addressed to Jesus Cañas at Jesus.Canas@dal.frb.org.