Agricultural Survey

Survey Highlights
Bankers responding to the second-quarter survey reported overall weaker conditions across most regions of the Eleventh District. Respondents noted that high commodity prices and insurance programs are not enough to compensate for continued severe drought and high input costs. Extreme dry conditions are putting a strain agricultural production, particularly for cotton. “We’d like to get out of this drought—it looks like the dryland cotton crop will be very short. Grassland is stressing for cattle, and herds will be down,” a survey participant noted.
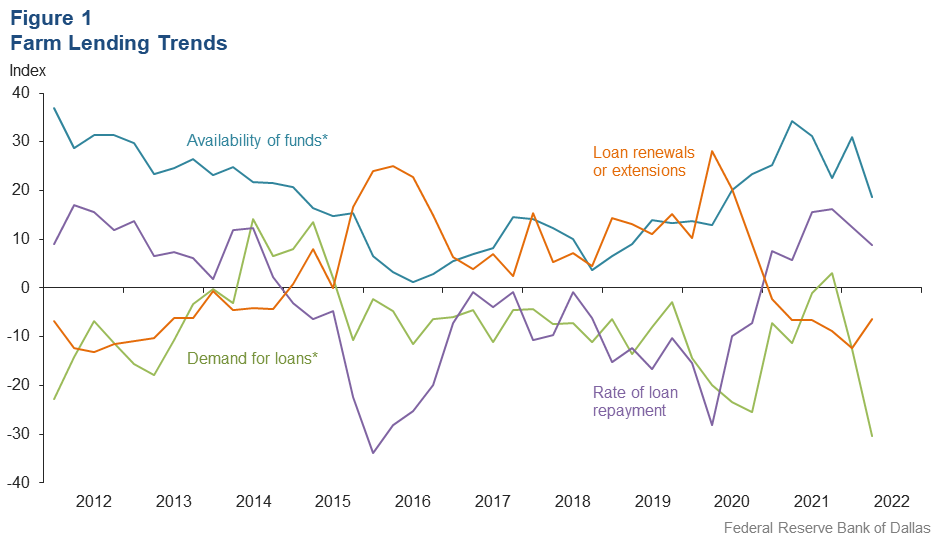
Demand for agricultural loans decreased again in second quarter 2022, with the loan demand index showing negative values not seen since 2011. Loan renewals or extensions fell for the sixth quarter in a row, while the rate of loan repayment continued to increase, albeit at a slower pace. Loan volume decreased for all categories compared with a year ago (Figure 1).
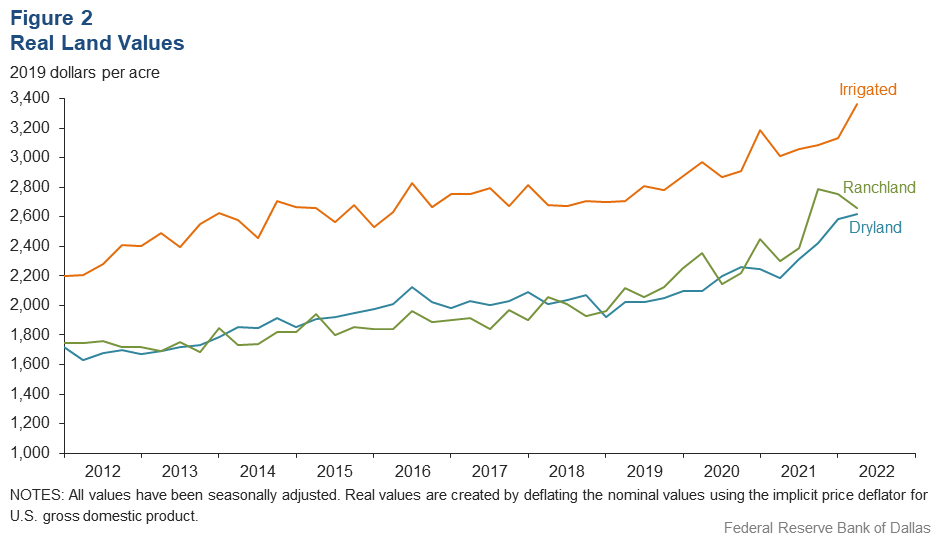
Irrigated cropland and dryland values rose this quarter, while ranchland values fell (Figure 2). According to bankers who responded in both this quarter and second quarter 2021, cropland, dryland and ranchland values increased at least 10 percent year over year in Texas, with some segments seeing much higher increases (Table 1).
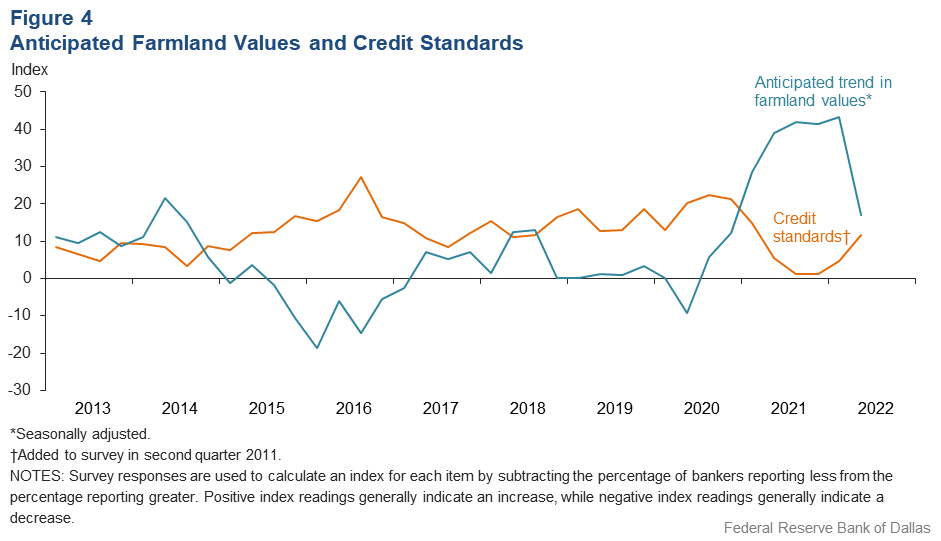
The anticipated trend in farmland values index stayed in positive territory but fell considerably in the second quarter, suggesting respondents expect farmland values to continue increasing but at a significantly slower pace. The credit standards index pushed further into positive territory, indicating a tightening of standards on net (Figure 4).
Next release: October 3, 2022
Agricultural Survey is compiled from a survey of Eleventh District agricultural bankers, and data have been seasonally adjusted as necessary. Data were collected June 7–14, and 79 bankers responded to the survey.
Quarterly Comments

District bankers were asked for additional comments concerning agricultural land values and credit conditions. These comments have been edited for publication.
Region 1—Northern High Plains
- Positives are high commodity prices and strong insurance programs. Negatives are continued severe drought and high input costs (fuel, fertilizer, labor and most other inputs). Drought is resulting in productivity being well below average. It’s a very unusual year, with no historical records to compare . Producers are encouraged to manage risks and evaluate spending of every sort.
- Crop inputs have increased dramatically and caused many of our borrowers to ask for increases in their line. Severe weather has killed a lot of the cotton, and those acres will likely shift to short-season corn, milo, soybeans or some type of hay since it is too late to replant cotton. Severe drought has pushed some cattlemen to reduce cow numbers; 2022 is going to be a challenging year!
- The recent rains on the High Plains have brought some temporary drought relief to the farmers and ranchers. Pastures are finally starting to green up, but it was too late for many dryland wheat crops around the area. With the rains came large hail, with some fields of corn and wheat being total losses and some center pivots laid over from the damaging winds. Farmers will have an opportunity to replant or shift to a different crop, however. House and agricultural land prices have seen an increase to some unbelievable values for this area. With the rising interest rates, there could be a slowdown in some borrowing for equipment and land purchases, but we have not seen that yet. Most of the revolving lines of credit for farmers were increased at renewal to match the rise in production costs, and so far, the rise in commodity prices has made up the difference. The cost to consumers at the pump and in the grocery store is affecting people’s purchasing power. As for the outlook for the bank, we’ve had good growth in loans and deposits so far, good income as a result, low turnover of employees and overall high job satisfaction.
- Drought is still a major factor in our area. Input costs and fuel continue to increase.
Region 2—Southern High Plains
- We’d like to get out of this drought—it looks like the dryland cotton crop will be very short. Grassland is stressing for cattle, and herds will be down.
- Demand for loans increased due to higher input costs. Optimism increased with rain across the area, but the subsoil moisture profile is insufficient for dryland crop. We’re expecting many partial losses and difficulty balancing crop expectations. Emergency Relief Program payments began to lend a helpful boost in the midst of such uncertainty. Weather patterns will dictate the size and quality for the 2022 crop year.
- Continued drought conditions and increased input costs concern all producers. There are great prices available to secure for crops, but production will be limited due to drought conditions.
- The South Plains area received some rain but not enough. There is still no underground moisture to carry a crop to finish. If there are additional rains, producers will go to an alternative crop other than cotton since the insurance price is good. From the bank standpoint, loan volumes will be down due to late rains and government program payments.
Region 3—Northern Low Plains
- Our region has received some rain to allow planting, but we are still in a drought situation as current moisture will not last long. Pasture conditions did improve, but cattle herd reduction has already taken place. Hay is in short supply and the cost of supplemental feed is too high. There is a general consensus that the cost of inputs has more than offset the higher commodity prices. Fuel and fertilizer costs are more than double compared to 2021.
Region 4—Southern Low Plains
- Very little wheat was combined. Cotton will be planted by June 20, but it’s currently too dry to get it up even with recent rains. Livestock conditions have improved but will need a wet summer to survive the fall and winter.
- Extreme heat and drought, along with high input costs, have demand at a standstill.
Region 6—North Central Texas
- Fuel, increasing input costs and inflation are killing us. Biden and his management team are clueless. We need rain!
Region 7—East Texas
- Dry conditions continue across the banking area, with sporadic rains enabling hay producers to get one cutting so far. Corn is good, with expected yields to come close to 2020 record yields. Cotton is struggling with recent heat wave, and farmers seem to be watering earlier.
Region 8—Central Texas
- The drought continues to worsen in our area, with only spots getting showers. Little or no hay has been made so far, and prospects do not look good for the coming months. The corn crop is starting to wilt, and it looks like yields will be way down this year as well. Cattle prices remain firm—even cull cow and packer bull prices are strong. Cattle producers should see good prices in the fall if they can weather the summer this year. Oil and gas activity is still strong in the area, with some renewed leasing going on also in the area.
- High input costs continue to plague producers. Luckily, with high commodity prices, there is still profit potential. Unfortunately, the extended hot, dry weather that has occurred and is forecast to continue for the rest of the month is hurting grain crops tremendously, while cotton is still showing potential if it gets a good soaking rain in the next 30 minutes. The LCRA [Lower Colorado River Authority] cutting out water for second-crop rice will hurt the profit potential for rice producers as well. If they make a decent first crop at current market prices, there is a possibility that they can still come out with a slight profit.
Region 9—Coastal Texas
- The banking industry could use some help in competing with the nonprofit financial firms. Making agricultural loans nontaxable would help the banking industry be competitive.
Region 11—Trans-Pecos and Edwards Plateau
- Agricultural commodity prices are good, but input prices are offsetting any major change to net income. Additionally, the drought is having a negative effect on carrying capacity and, therefore, the favorable prices for livestock cannot be fully realized.
- All of Southwest Texas is in need of good, general, recurring rainfall. While some rain has fallen, few areas have received the critical follow-up rains to make a real difference. Most areas remain in critical condition, with continuing wind quickly drying out where rains have fallen. Feed costs and overall expenses continue to increase. Livestock market prices have fallen but remain reasonable on those in good condition. A significant value decline is seen in thin, drought-affected animals. Wildfire potential remains a real threat.
Region 12—Southern New Mexico
- Appreciable moisture is needed for farmers to be able to benefit from higher commodity prices. Increased input costs are significant, but it’s hopeful that, with enough moisture, the increase in prices will offset them.
Historical Data
Historical data can be downloaded dating back to first quarter 2000.
Figures
Farm Lending Trends
What changes occurred in non-real-estate farm loans at your bank in the past three months compared with a year earlier?
| Index | Percent reporting, Q2 | ||||
| 2022:Q1 | 2022:Q2 | Greater | Same | Less | |
Non–real–estate farm loans | –2.5 | –26.6 | 7.6 | 58.2 | 34.2 |
Feeder cattle loans* | –22.1 | –30.6 | 5.4 | 58.6 | 36.0 |
Dairy loans* | –8.7 | –11.3 | 2.9 | 82.9 | 14.2 |
Crop storage loans* | –9.4 | –27.4 | 1.4 | 69.8 | 28.8 |
Operating loans | 2.6 | –6.5 | 20.8 | 52.0 | 27.3 |
Farm machinery loans* | –9.2 | –23.6 | 5.1 | 66.2 | 28.7 |
Farm real estate loans* | 3.7 | –5.6 | 14.2 | 66.0 | 19.8 |

What changes occurred in the volume of farm loans made by your bank in the past three months compared with a year earlier?
| Index | Percent reporting, Q2 | ||||
| 2022:Q1 | 2022:Q2 | Greater | Same | Less | |
Non–real–estate farm loans | –2.5 | –26.6 | 7.6 | 58.2 | 34.2 |
Feeder cattle loans* | –22.1 | –30.6 | 5.4 | 58.6 | 36.0 |
Dairy loans* | –8.7 | –11.3 | 2.9 | 82.9 | 14.2 |
Crop storage loans* | –9.4 | –27.4 | 1.4 | 69.8 | 28.8 |
Operating loans | 2.6 | –6.5 | 20.8 | 52.0 | 27.3 |
Farm machinery loans* | –9.2 | –23.6 | 5.1 | 66.2 | 28.7 |
Farm real estate loans* | 3.7 | –5.6 | 14.2 | 66.0 | 19.8 |
| *Seasonally adjusted. NOTES: Survey responses are used to calculate an index for each item by subtracting the percentage of bankers reporting less from the percentage reporting greater. Positive index readings generally indicate an increase, while negative index readings generally indicate a decrease. |
|||||
Real Land Values

Real Cash Rents

Anticipated Farmland Values and Credit Standards
What trend in farmland values do you expect in your area in the next three months?
| Index | Percent reporting, Q2 | ||||
| 2022:Q1 | 2022:Q2 | Up | Same | Down | |
| Anticipated trend in farmland values* | 43.3 | 16.9 | 22.3 | 72.3 | 5.4 |
What change occurred in credit standards for agricultural loans at your bank in the past three months compared with a year earlier?†
| 2022:Q1 | 2022:Q2 | Up | Same | Down | |
| Credit standards | 4.8 | 11.7 | 13.0 | 85.7 | 1.3 |

Tables
Rural Real Estate Values—Second Quarter 2022
| Banks1 | Average value2 | Percent change in value from previous year3 | ||
Cropland–Dryland |
||||
District* |
66 |
2,775 |
21.8 |
|
Texas* |
59 |
2,818 |
23.2 |
|
1 |
Northern High Plains |
11 |
1,039 |
4.3 |
2 |
Southern High Plains |
8 |
1,131 |
16.7 |
3 |
Northern Low Plains* |
3 |
983 |
–1.7 |
4 |
Southern Low Plains* |
3 |
1,746 |
52.4 |
5 |
Cross Timbers |
n.a. |
n.a. |
n.a. |
6 |
North Central Texas |
6 |
5,250 |
33.8 |
7 |
East Texas* |
6 |
3,469 |
11.1 |
8 |
Central Texas |
9 |
6,750 |
33.8 |
9 |
Coastal Texas |
5 |
2,580 |
12.7 |
10 |
South Texas |
n.a. |
n.a. |
n.a. |
11 |
Trans–Pecos and Edwards Plateau |
4 |
4,313 |
16.7 |
12 |
Southern New Mexico |
3 |
650 |
2.7 |
13 |
Northern Louisiana |
4 |
3,688 |
6.1 |
Cropland–Irrigated |
||||
District* |
49 |
3,558 |
11.7 |
|
Texas* |
42 |
2,749 |
9.8 |
|
1 |
Northern High Plains |
11 |
2,373 |
6.9 |
2 |
Southern High Plains |
7 |
2,129 |
8.4 |
3 |
Northern Low Plains* |
n.a. |
n.a. |
n.a. |
4 |
Southern Low Plains |
n.a. |
n.a. |
n.a. |
5 |
Cross Timbers |
n.a. |
n.a. |
n.a. |
6 |
North Central Texas |
3 |
5,500 |
13.8 |
7 |
East Texas |
3 |
4,833 |
35.7 |
8 |
Central Texas |
4 |
5,425 |
20.9 |
9 |
Coastal Texas |
3 |
2,233 |
9.3 |
10 |
South Texas |
n.a. |
n.a. |
n.a. |
11 |
Trans–Pecos and Edwards Plateau |
4 |
5,313 |
9.4 |
12 |
Southern New Mexico |
3 |
9,500 |
16.3 |
13 |
Northern Louisiana |
4 |
5,450 |
13.0 |
Ranchland |
||||
District* |
67 |
2,814 |
21.1 |
|
Texas* |
59 |
3,375 |
22.2 |
|
1 |
Northern High Plains |
11 |
877 |
14.3 |
2 |
Southern High Plains |
6 |
900 |
15.3 |
3 |
Northern Low Plains |
n.a. |
n.a. |
n.a. |
4 |
Southern Low Plains* |
3 |
2,094 |
67.9 |
5 |
Cross Timbers |
3 |
3,150 |
26.0 |
6 |
North Central Texas |
6 |
6,417 |
41.0 |
7 |
East Texas |
7 |
4,143 |
30.6 |
8 |
Central Texas |
8 |
9,563 |
16.8 |
9 |
Coastal Texas |
5 |
2,860 |
2.9 |
10 |
South Texas |
n.a. |
n.a. |
n.a. |
11 |
Trans–Pecos and Edwards Plateau |
6 |
2,992 |
35.3 |
12 |
Southern New Mexico |
4 |
388 |
–4.4 |
13 |
Northern Louisiana |
4 |
2,675 |
5.3 |
| *Seasonally adjusted. 1 Number of banks reporting land values. 2 Prices are dollars per acre, not adjusted for inflation. 3 Not adjusted for inflation and calculated using responses only from those banks reporting in both the past and current quarter. n.a.—Not published due to insufficient responses but included in totals for Texas and district. |
||||
Interest Rates by Loan Type—Second Quarter 2022
| Feeder cattle | Other farm operating | Intermediate term | Long-term farm real estate | Fixed (average rate, percent) |
2021:Q2 | 5.65 | 5.67 | 5.53 | 5.20 |
2021:Q3 | 5.55 | 5.61 | 5.45 | 5.15 |
2021:Q4 | 5.59 | 5.61 | 5.48 | 5.19 |
2022:Q1 | 5.69 | 5.62 | 5.54 | 5.30 |
2022:Q2 | 5.97 | 6.00 | 5.81 | 5.45 | Variable (average rate, percent) |
2021:Q2 | 5.33 | 5.31 | 5.24 | 5.00 |
2021:Q3 | 5.23 | 5.31 | 5.23 | 4.93 |
2021:Q4 | 5.40 | 5.38 | 5.33 | 4.96 |
2022:Q1 | 5.42 | 5.33 | 5.25 | 4.93 |
2022:Q2 | 5.63 | 5.67 | 5.53 | 5.30 |
For More Information
Questions regarding the Agricultural Survey can be addressed to Jesus Cañas at Jesus.Canas@dal.frb.org.