Agricultural Survey

Survey Highlights
Bankers responding to the third-quarter survey reported overall weaker conditions across most regions of the Eleventh District. Extreme dry conditions are putting a strain on agricultural production, particularly for cotton and pasture. “The South Plains cotton crop is a disaster. Almost all dryland crop has already been abandoned from drought, and the irrigated crop still standing is pitiful,” a survey participant said. Respondents also noted that herd reduction was heavy before recent rains.
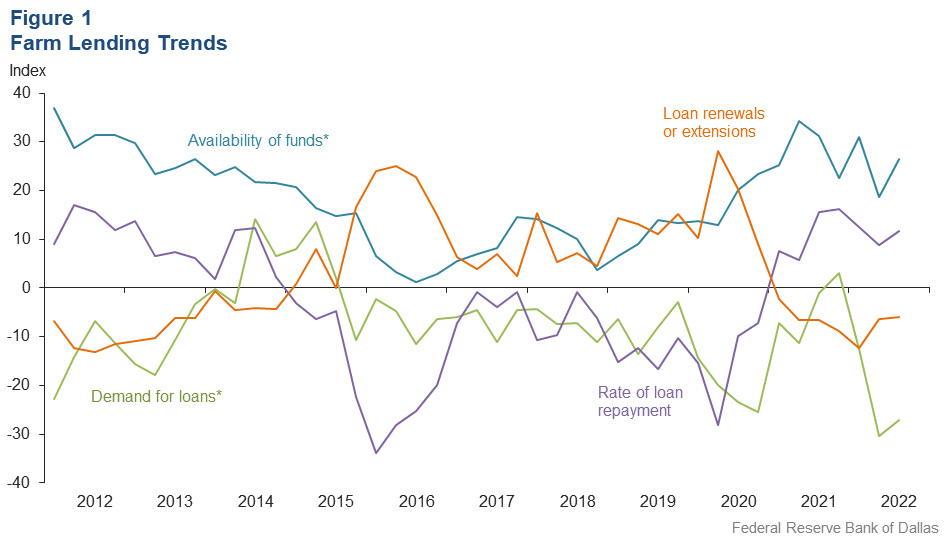
Demand for agricultural loans decreased for the third consecutive quarter in third quarter 2022. Loan renewals or extensions fell for the seventh quarter in a row, while the rate of loan repayment continued to increase. Loan volume decreased for all categories compared with a year ago (Figure 1).
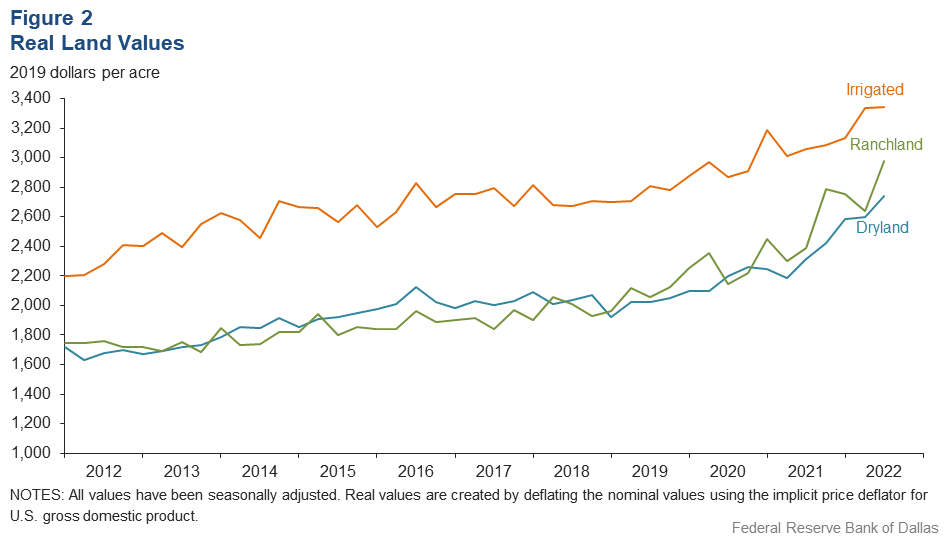
Ranchland and dryland values rose this quarter, while irrigated cropland values were steady (Figure 2). According to bankers who responded in both this quarter and third quarter 2021, cropland, dryland and ranchland values increased at least 10 percent year over year in Texas, with some segments seeing much higher increases (Table 1).
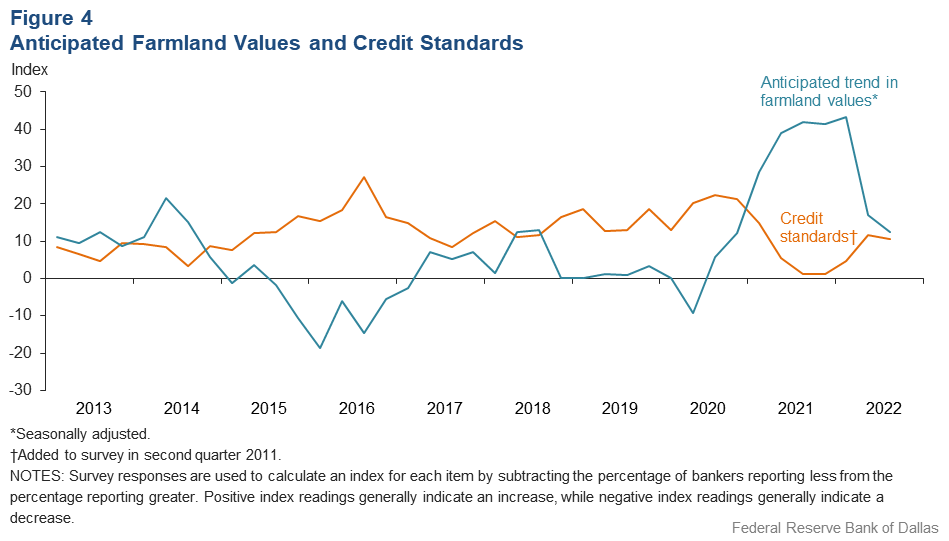
The anticipated trend in farmland values index stayed in positive territory but fell for the second quarter in a row, suggesting respondents expect farmland values to continue increasing but at a slower pace. The credit standards index continued in positive territory, indicating a tightening of standards on net (Figure 4).
Next release: January 3, 2023
Agricultural Survey is compiled from a survey of Eleventh District agricultural bankers, and data have been seasonally adjusted as necessary. Data were collected September 6–14, and 87 bankers responded to the survey.
Quarterly Comments

District bankers were asked for additional comments concerning agricultural land values and credit conditions. These comments have been edited for publication.
Region 1—Northern High Plains
- We’re getting ready for a corn harvest that most of us are nervous about. Conditions have been poor for high corn yields, but the irrigated cotton looks good. High input prices have led us to increase our operating lines. We need some additional moisture to have a possibility of good wheat pasture. In summary, it’s a harsh year to be an ag producer with limited irrigation capabilities.
- Moisture has come too late for fall crops. Yields will be well below average. Recent moisture will help with wheat, but the soil moisture profile remains well below average. Increasing costs of production for the remainder of 2022 and into 2023 are a major concern.
Region 2—Southern High Plains
- I will observe my 40th year in banking this month. I’ve never experienced a year remotely like this one. The South Plains cotton crop is a disaster. Almost all dryland crop has already been abandoned from drought, and the irrigated crop still standing is pitiful. Nevertheless, our producers’ financial condition has never been better. For the most part, crop expenditures were negligible and crop insurance payouts were outsized due to high price guarantees. The result is that most operating lines are paid out, and growers are sitting on piles of cash. I would say crop insurance provided a very, very good secondary source of repayment.
Region 3—Northern Low Plains
- The majority of dryland cotton has been destroyed. Irrigated cotton is fair, and pasture conditions have improved slightly due to recent rains, but hay is in short supply. Liquidation of cow herds continues due to the drought.
Region 4—Southern Low Plains
- Drought has claimed the cotton crop and reduced cattle herds by 50 percent. Rains last week of 3–7 inches in the area saved us.
Region 5— Cross Timbers
- Lots of cattle have been sold due to the drought. Beef cattle producers are buying lots of hay, and recent rains have jumpstarted the pastures and hay fields.
Region 7—East Texas
- Loan demand continues to be strong.
- Corn harvest is complete, with averages a little less than the previous two years. Cotton harvest is well underway, with production looking to close the year at around average yields. Hay production is still about 25 percent of normal due to the drought during most of the summer. About 50 percent of milo and corn stubble was baled for winter feed. Recent rains have helped tremendously and will push hay production back by several months. Pastures in most areas have improved because of the rains. Herd reduction was heavy prior to rain.
Region 8—Central Texas
- We finally got rain over most of the area. Some got more, some less, but it has greened up and is looking better. The corn crop is very poor, except on irrigated land. Cattle prices continue to climb weekly, and we should see a slowdown in cattle coming into the sale barns as pasture conditions improve. Hopefully, ranchers will make some hay before the first freeze, but there is still expected to be a shortage of good-quality hay this year.
Region 11—Trans-Pecos and Edwards Plateau
- Recent rains will help ranchers going into the winter. However, the rains are slowing down the cotton harvest.
- We have finally received some much-needed, recurring rainfall, and pasture conditions have improved a lot—though additional follow-up rains will certainly be needed to provide adequate grazing into fall. Producers have decreased cattle numbers quite a bit and, to a lesser extent, sheep and goats. Generally, livestock are in good shape, especially considering the extended drought conditions we have experienced. Livestock markets have remained exceptionally good considering the volumes going to market before the recent rains. Prayers for recurring rains continue.
Region 12— Southern New Mexico
- Monsoon moisture across most of our area has been welcomed by producers. It was late enough that the summer crops didn’t receive much benefit, but the prospects for winter crops are very good.
Historical Data
Historical data can be downloaded dating back to first quarter 2000.
Figures
Farm Lending Trends
What changes occurred in non-real-estate farm loans at your bank in the past three months compared with a year earlier?
| Index | Percent reporting, Q3 | ||||
| 2022:Q2 | 2022:Q3 | Greater | Same | Less | |
Demand for loans* | –30.3 | –27.1 | 6.4 | 60.1 | 33.5 |
Availability of funds* | 18.6 | 26.4 | 27.6 | 71.2 | 1.2 |
Rate of loan repayment | 8.9 | 11.6 | 20.9 | 69.8 | 9.3 |
Loan renewals or extensions | –6.3 | –5.9 | 7.1 | 80.0 | 12.9 |

What changes occurred in the volume of farm loans made by your bank in the past three months compared with a year earlier?
| Index | Percent reporting, Q3 | ||||
| 2022:Q2 | 2022:Q3 | Greater | Same | Less | |
Non–real–estate farm loans | –26.6 | –25.6 | 10.5 | 53.5 | 36.1 |
Feeder cattle loans* | –30.6 | –36.3 | 4.6 | 54.5 | 40.9 |
Dairy loans* | –11.3 | –21.2 | 0.0 | 78.8 | 21.2 |
Crop storage loans* | –27.4 | –21.4 | 2.4 | 73.8 | 23.8 |
Operating loans | –6.5 | –6.0 | 15.5 | 63.1 | 21.4 |
Farm machinery loans* | –23.6 | –18.4 | 10.1 | 61.4 | 28.5 |
Farm real estate loans* | –5.6 | –16.5 | 7.7 | 68.1 | 24.2 |
| *Seasonally adjusted. NOTES: Survey responses are used to calculate an index for each item by subtracting the percentage of bankers reporting less from the percentage reporting greater. Positive index readings generally indicate an increase, while negative index readings generally indicate a decrease. |
|||||
Real Land Values

Real Cash Rents

Anticipated Farmland Values and Credit Standards
What trend in farmland values do you expect in your area in the next three months?
| Index | Percent reporting, Q3 | ||||
| 2022:Q2 | 2022:Q3 | Up | Same | Down | |
| Anticipated trend in farmland values* | 16.9 | 12.4 | 17.6 | 77.2 | 5.2 |
What change occurred in credit standards for agricultural loans at your bank in the past three months compared with a year earlier?†
| 2022:Q2 | 2022:Q3 | Up | Same | Down | |
| Credit standards | 11.7 | 10.6 | 11.8 | 87.1 | 1.2 |

Tables
Rural Real Estate Values—Third Quarter 2022
| Banks1 | Average value2 | Percent change in value from previous year3 | ||
Cropland–Dryland | ||||
District* | 67 | 2,958 | 17.3 | |
Texas* | 58 | 3,011 | 18.3 | |
1 | Northern High Plains | 9 | 1,106 | 8.2 |
2 | Southern High Plains | 8 | 1,134 | 18.3 |
3 | Northern Low Plains* | n.a. | n.a. | n.a. |
4 | Southern Low Plains* | n.a. | n.a. | n.a. |
5 | Cross Timbers | 3 | 4,467 | 48.8 |
6 | North Central Texas | 5 | 5,300 | 30.5 |
7 | East Texas* | 5 | 3,629 | 5.4 |
8 | Central Texas | 11 | 7,682 | 20.7 |
9 | Coastal Texas | 4 | 2,600 | 3.0 |
10 | South Texas | n.a. | n.a. | n.a. |
11 | Trans–Pecos and Edwards Plateau | 7 | 3,600 | 11.7 |
12 | Southern New Mexico | 3 | 667 | 6.5 |
13 | Northern Louisiana | 6 | 3,800 | 1.5 |
Cropland–Irrigated | ||||
District* | 53 | 3,606 | 12.1 | |
Texas* | 43 | 2,912 | 10.6 | |
1 | Northern High Plains | 9 | 2,567 | 9.5 |
2 | Southern High Plains | 8 | 2,113 | 2.7 |
3 | Northern Low Plains* | n.a. | n.a. | n.a. |
4 | Southern Low Plains | n.a. | n.a. | n.a. |
5 | Cross Timbers | n.a. | n.a. | n.a. |
6 | North Central Texas | 3 | 5,500 | 17.8 |
7 | East Texas | 3 | 4,583 | 6.7 |
8 | Central Texas | 6 | 8,283 | 49.5 |
9 | Coastal Texas | n.a. | n.a. | n.a. |
10 | South Texas | n.a. | n.a. | n.a. |
11 | Trans–Pecos and Edwards Plateau | 5 | 4,990 | 11.4 |
12 | Southern New Mexico | 4 | 8,625 | 22.5 |
13 | Northern Louisiana | 6 | 5,300 | 4.4 |
Ranchland | ||||
District* | 70 | 3,211 | 29.1 | |
Texas* | 61 | 3,859 | 29.9 | |
1 | Northern High Plains | 9 | 925 | 14.1 |
2 | Southern High Plains | 6 | 1,033 | 18.7 |
3 | Northern Low Plains | n.a. | n.a. | n.a. |
4 | Southern Low Plains* | n.a. | n.a. | n.a. |
5 | Cross Timbers | 4 | 4,375 | 47.0 |
6 | North Central Texas | 5 | 6,400 | 33.3 |
7 | East Texas | 7 | 4,043 | 20.2 |
8 | Central Texas | 11 | 9,673 | 16.3 |
9 | Coastal Texas | 4 | 2,825 | 10.1 |
10 | South Texas | n.a. | n.a. | n.a. |
11 | Trans–Pecos and Edwards Plateau | 9 | 4,094 | 45.7 |
12 | Southern New Mexico | 4 | 413 | 8.4 |
13 | Northern Louisiana | 5 | 2,700 | 8.8 |
| *Seasonally adjusted. 1 Number of banks reporting land values. 2 Prices are dollars per acre, not adjusted for inflation. 3 Not adjusted for inflation and calculated using responses only from those banks reporting in both the past and current quarter. n.a.—Not published due to insufficient responses but included in totals for Texas and district. |
||||
Interest Rates by Loan Type—Third Quarter 2022
| Feeder cattle | Other farm operating | Intermediate term | Long-term farm real estate | Fixed (average rate, percent) |
2021:Q3 | 5.55 | 5.61 | 5.45 | 5.15 |
2021:Q4 | 5.59 | 5.61 | 5.48 | 5.19 |
2022:Q1 | 5.69 | 5.62 | 5.54 | 5.30 |
2022:Q2 | 5.97 | 6.00 | 5.81 | 5.45 |
2022:Q3 | 6.80 | 6.75 | 6.66 | 6.35 | Variable (average rate, percent) |
2021:Q3 | 5.23 | 5.31 | 5.23 | 4.93 |
2021:Q4 | 5.40 | 5.38 | 5.33 | 4.96 |
2022:Q1 | 5.42 | 5.33 | 5.25 | 4.93 |
2022:Q2 | 5.63 | 5.67 | 5.53 | 5.30 |
2022:Q3 | 6.72 | 6.60 | 6.41 | 6.19 |
For More Information
Questions regarding the Agricultural Survey can be addressed to Jesus Cañas at Jesus.Canas@dal.frb.org.