Agricultural Survey

Survey highlights
Bankers responding to the second-quarter survey reported overall better conditions across most regions of the Eleventh District. They noted good crop yields—a result of recent rains—and rising cattle prices.
“Recent rains will make all the difference. Cotton may not all be planted, but all areas received good rain to start a late crop, and pastureland is in great shape,” one survey participant said. “Wheat harvest is halfway complete, and the crop has exceeded earlier expectations,” another noted. “Beneficial rain has hampered harvest somewhat but is welcomed. We are growing good pasture, and stock tanks have caught enough water to get through the summer. Cattle prices are phenomenal.”
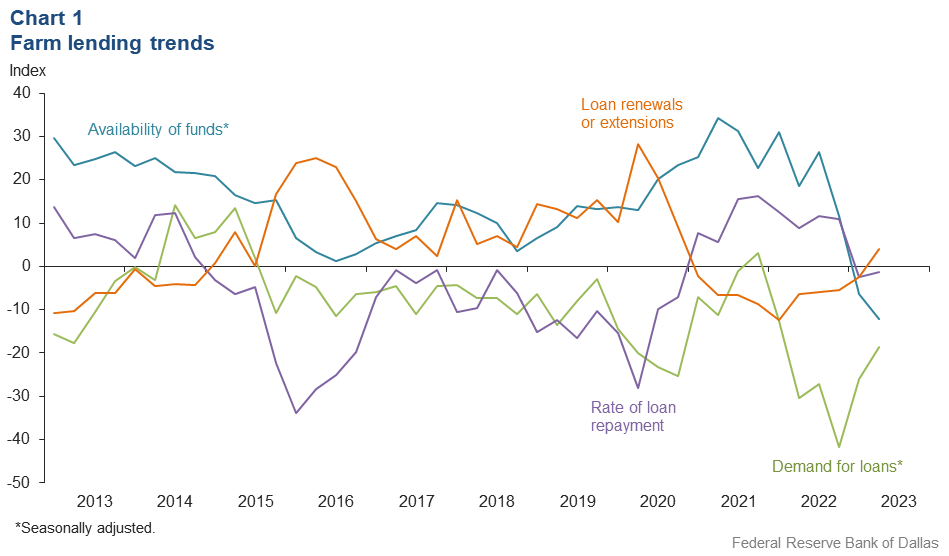
Demand for agricultural loans decreased in the second quarter for the sixth straight quarter. However, loan renewals or extensions increased after falling for nine quarters in a row, while the rate of loan repayment fell again. Loan volume was down for all categories compared with a year ago, except for operating loans (Chart 1).
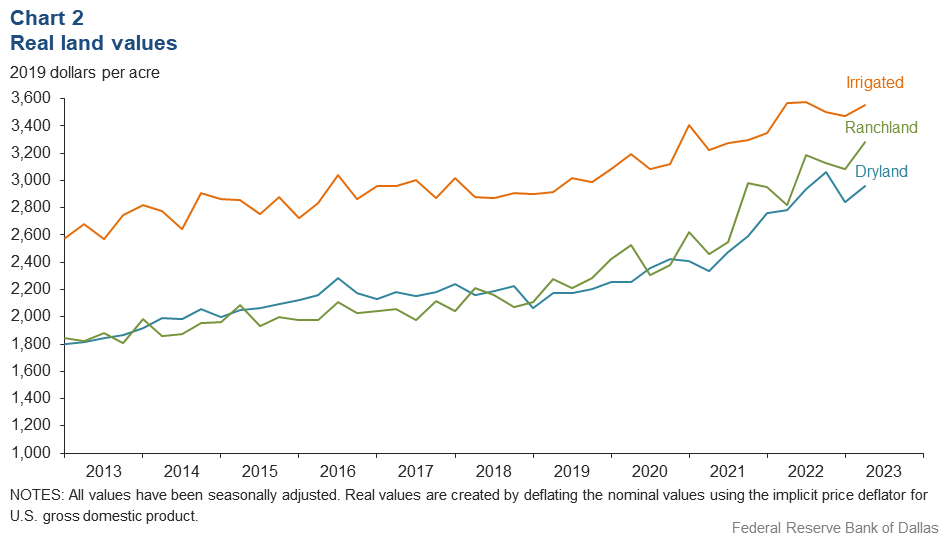
Ranchland, irrigated cropland and dryland values increased this quarter (Chart 2). According to bankers who responded in both this quarter and second quarter 2022, ranchland, irrigated cropland and dryland values rose at least 5 percent year over year in Texas, with cropland seeing much higher increases (Table 1).
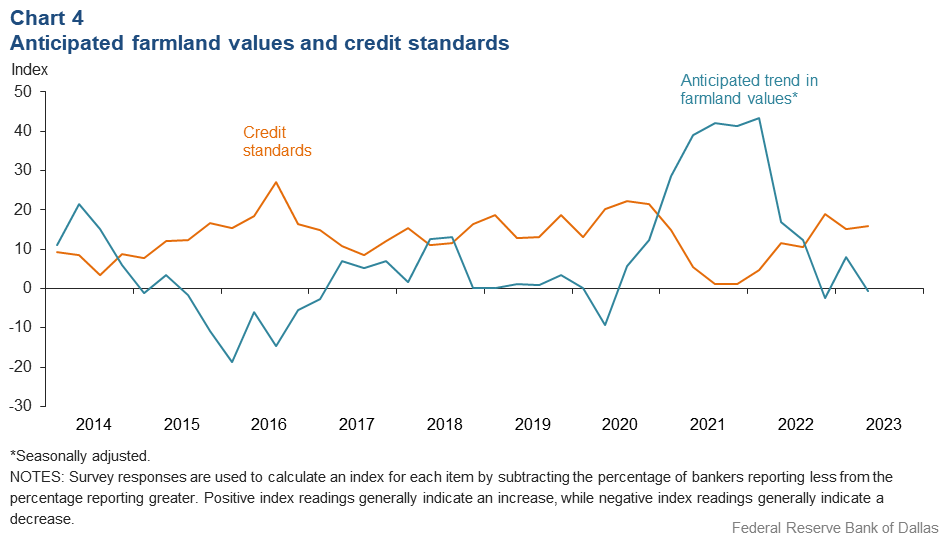
The anticipated trend in farmland values index slipped into negative territory, suggesting respondents expect farmland values to fall. The credit standards index was positive, indicating a tightening of standards on net (Chart 4).
Next release: October 2, 2023
Agricultural Survey is compiled from a survey of Eleventh District agricultural bankers, and data have been seasonally adjusted as necessary. Data were collected June 6–14, and 78 bankers responded to the survey.
Quarterly comments

District bankers were asked for additional comments concerning agricultural land values and credit conditions. These comments have been edited for publication.
- Rainfall has been above normal. It’s much appreciated, but now most cotton farmers won’t get acres planted by the deadline. Cotton acres will become forage, hay or sorghum. Grass pasture is in very good shape.
- Our region finally received rain. While the deep moisture profile is still dry, there’s adequate moisture to get all dryland crops up and started. We will need timely rains through the summer without the deeper wet moisture profile.
- Recent rains will make all the difference. Cotton may not all be planted, but all areas received good rain to start a late crop. Pastureland is in great shape.
- Timely planting rains in the Southern High Plains create a glimpse of promise for the cotton crop. With the rain, prevented planting will be a factor. The moisture will improve the outlook for the 2023 growing season but likely be more of a benefit to catch crops, winter crops and the growing season in 2024 due to the current high deficit in ground moisture. Should timely rain continue with the forecasted El Niño shift, the dryland crop will be successful and drive down the price of cotton. Hay and grain choices for first crop have been more prevalent with the uncertainty of the weather and market. Cattle remain a lifesaver for the diversified operation with high prices. Hay and feed remain inflated as well, compressing profit margins.
- Wheat harvest is halfway complete, and the crop has exceeded earlier expectations. Beneficial rain has hampered harvest somewhat but is welcomed. We are growing good pasture, and stock tanks have caught enough water to get through the summer. Cattle prices are phenomenal.
- Currently, the land values in the area have seemed to stabilize and, in some cases, have reduced somewhat as interest rates have continued to climb. Decent commodity and significantly higher cattle prices have continued to help the credit conditions of our agriculture portfolio. The banks’ equity position has greatly increased from these favorable market conditions of late.
- A good wheat crop is about 75 percent harvested; recent rains have yielded some runoff, grass is growing, the cattle market is at near-record highs and cotton is being planted. Overall conditions are very good.
- Ranchland recently sold for $9,627 per acre.
- Rains have improved pasture quality and helped hay producers get off on a good start. Corn looks exceptional, while cotton seems to be a little behind. There have been very little land sales due to interest rates.
- Cattle prices are stout, and better precipitation this year compared to last bodes well for anticipated levels of hay production.
- There has been an increasing trend in ranchland for sale as a result of younger generations not being as interested in continuing to hold historic family ranchland. A lot of sales are going to recreational users, though some purchasers are existing ranchers. Recent rains have certainly greened up pastures, and now grass is in some places where there hasn’t been any in a good while. Predator issues continue, primarily in sheep and goats, with operating costs continuing to increase and good agriculture workers being hard to find.
- The agriculture sector continues to be good for forage farmers and excellent for cow/calf producers. Dairies are struggling with price pressures on milk and continued high input costs. Drought continues to be an issue for many, with only a few areas seeing improvement.
Historical data
Historical data can be downloaded dating back to first quarter 2000.
Charts
Farm lending trends
What changes occurred in non-real-estate farm loans at your bank in the past three months compared with a year earlier?
| Index | Percent reporting, Q2 | ||||
| 2023:Q1 | 2023:Q2 | Greater | Same | Less | |
Demand for loans* | –25.9 | –18.7 | 10.6 | 60.1 | 29.3 |
Availability of funds* | –6.5 | –12.1 | 6.0 | 75.9 | 18.1 |
Rate of loan repayment | –2.4 | –1.3 | 3.9 | 90.9 | 5.2 |
Loan renewals or extensions | –2.4 | 3.9 | 7.9 | 88.2 | 4.0 |
| *Seasonally adjusted. | |||||

What changes occurred in the volume of farm loans made by your bank in the past three months compared with a year earlier?
| Index | Percent reporting, Q2 | ||||
| 2023:Q1 | 2023:Q2 | Greater | Same | Less | |
Non–real–estate farm loans | –16.1 | –16.0 | 13.3 | 57.3 | 29.3 |
Feeder cattle loans* | –14.0 | –12.9 | 13.4 | 60.3 | 26.3 |
Dairy loans* | –21.3 | –15.4 | 3.0 | 78.6 | 18.4 |
Crop storage loans* | –17.9 | –17.1 | 4.1 | 74.7 | 21.2 |
Operating loans | –3.5 | 2.8 | 20.8 | 61.1 | 18.1 |
Farm machinery loans* | –21.2 | –24.1 | 7.0 | 61.9 | 31.1 |
Farm real estate loans* | –25.1 | –25.1 | 6.6 | 61.7 | 31.7 |
| *Seasonally adjusted. NOTES: Survey responses are used to calculate an index for each item by subtracting the percentage of bankers reporting less from the percentage reporting greater. Positive index readings generally indicate an increase, while negative index readings generally indicate a decrease. |
|||||
Real land values

Real cash rents

Anticipated farmland values and credit standards
What trend in farmland values do you expect in your area in the next three months?
| Index | Percent reporting, Q2 | ||||
| 2023:Q1 | 2023:Q2 | Up | Same | Down | |
| Anticipated trend in farmland values* | 8.1 | –0.6 | 7.3 | 84.8 | 7.9 |
| *Seasonally adjusted. | |||||
What change occurred in credit standards for agricultural loans at your bank in the past three months compared with a year earlier?
| 2023:Q1 | 2023:Q2 | Up | Same | Down | |
| Credit standards | 15.1 | 15.8 | 17.1 | 81.6 | 1.3 |

Tables
Rural real estate values—second quarter 2023
| Banks1 | Average value2 | Percent change in value from previous year3 | ||
Cropland–Dryland | ||||
District* | 60 | 3,064 | 4.5 | |
Texas* | 52 | 3,124 | 5.0 | |
1 | Northern High Plains | 6 | 1,142 | 7.9 |
2 | Southern High Plains | 7 | 1,193 | 15.0 |
3 | Northern Low Plains* | 3 | 1,022 | 3.5 |
4 | Southern Low Plains* | 5 | 2,291 | 11.8 |
5 | Cross Timbers | 3 | 3,000 | 2.4 |
6 | North Central Texas | 4 | 6,125 | 6.5 |
7 | East Texas* | 3 | 3,405 | –4.8 |
8 | Central Texas | 9 | 8,333 | 3.4 |
9 | Coastal Texas | 4 | 2,350 | –7.3 |
10 | South Texas | 3 | 2,933 | 22.0 |
11 | Trans–Pecos and Edwards Plateau | 5 | 4,300 | 5.8 |
12 | Southern New Mexico | 4 | 575 | –28.2 |
13 | Northern Louisiana | 4 | 3,950 | 1.1 |
Cropland–Irrigated | ||||
District* | 48 | 3,686 | 15.5 | |
Texas* | 39 | 3,176 | 25.0 | |
1 | Northern High Plains | 6 | 2,717 | 44.9 |
2 | Southern High Plains | 7 | 2,321 | 12.7 |
3 | Northern Low Plains* | n.a. | n.a. | n.a. |
4 | Southern Low Plains | 4 | 3,175 | 0.0 |
5 | Cross Timbers | n.a. | n.a. | n.a. |
6 | North Central Texas | 3 | 6,167 | 12.1 |
7 | East Texas | 3 | 4,333 | –10.3 |
8 | Central Texas | 4 | 10,125 | 12.6 |
9 | Coastal Texas | n.a. | n.a. | n.a. |
10 | South Texas | n.a. | n.a. | n.a. |
11 | Trans–Pecos and Edwards Plateau | 4 | 4,900 | 8.5 |
12 | Southern New Mexico | 5 | 6,919 | –1.4 |
13 | Northern Louisiana | 4 | 5,425 | 3.5 |
Ranchland | ||||
District* | 65 | 3,404 | 4.6 | |
Texas* | 56 | 4,086 | 4.9 | |
1 | Northern High Plains | 6 | 1,092 | 17.0 |
2 | Southern High Plains | 5 | 1,100 | 9.4 |
3 | Northern Low Plains | 3 | 1,000 | 5.3 |
4 | Southern Low Plains* | 5 | 2,210 | 9.6 |
5 | Cross Timbers | 4 | 3,800 | 45.0 |
6 | North Central Texas | 5 | 8,025 | 7.0 |
7 | East Texas | 5 | 4,100 | –5.6 |
8 | Central Texas | 9 | 10,389 | 2.6 |
9 | Coastal Texas | 4 | 2,650 | –3.0 |
10 | South Texas | 4 | 3,375 | –8.3 |
11 | Trans–Pecos and Edwards Plateau | 6 | 4,267 | 2.6 |
12 | Southern New Mexico | 5 | 452 | –5.9 |
13 | Northern Louisiana | 4 | 2,875 | 3.3 |
| *Seasonally adjusted. 1 Number of banks reporting land values. 2 Prices are dollars per acre, not adjusted for inflation. 3 Not adjusted for inflation and calculated using responses only from those banks reporting in both the past and current quarter. n.a.—Not published due to insufficient responses but included in totals for Texas and district. |
||||
Interest rates by loan type—second quarter 2023
| Feeder cattle | Other farm operating | Intermediate term | Long-term farm real estate | |
| Fixed (average rate, percent) | ||||
2022:Q2 | 5.97 | 6.00 | 5.81 | 5.45 |
2022:Q3 | 6.80 | 6.75 | 6.66 | 6.35 |
2022:Q4 | 7.97 | 8.00 | 7.87 | 7.47 |
2023:Q1 | 8.57 | 8.56 | 8.44 | 8.08 |
2023:Q2 | 9.16 | 9.14 | 8.88 | 8.41 |
| Variable (average rate, percent) | ||||
2022:Q2 | 5.63 | 5.67 | 5.53 | 5.30 |
2022:Q3 | 6.72 | 6.60 | 6.41 | 6.19 |
2022:Q4 | 8.07 | 8.04 | 7.92 | 7.51 |
2023:Q1 | 8.79 | 8.75 | 8.57 | 8.21 |
2023:Q2 | 9.28 | 9.31 | 9.00 | 8.59 |
For More Information
Questions regarding the Agricultural Survey can be addressed to Jesus Cañas at Jesus.Canas@dal.frb.org.