Agricultural Survey

Survey highlights
Bankers responding to the third-quarter agricultural survey reported weaker conditions across most regions of the Eleventh District. Dryer conditions and adverse weather conditions decreased crop production and increased reliance on insurance. Profitability remains a concern as commodity prices are low and input prices remain elevated. The one bright spot is the cattle market, which remains strong.
“Cotton prices are shaping up for the low, 60-cent level. Below average yields, 60-cent-per-pound prices and elevated inputs will leave most producers with a crop in our area losing net income,” reported one survey participant.
Early summer rains were not enough to offset the late summer dry spell. As a respondent said, “We have continued dry conditions after an extreme heat wave last month. Therefore, wheat pasture will be short.”
In addition, some coastal farms hit by Hurricane Beryl faced near total crop losses. One participant said, “Several farms totaled out crops and filed on insurance to cover debts and expenses.”
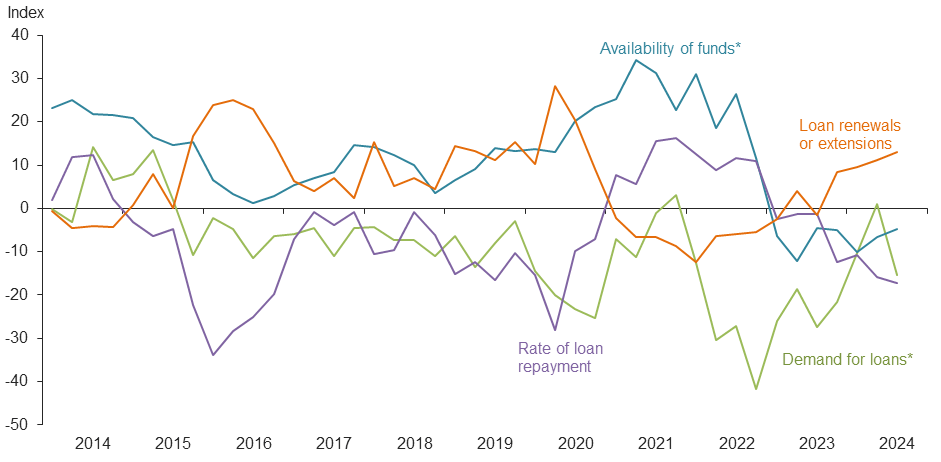
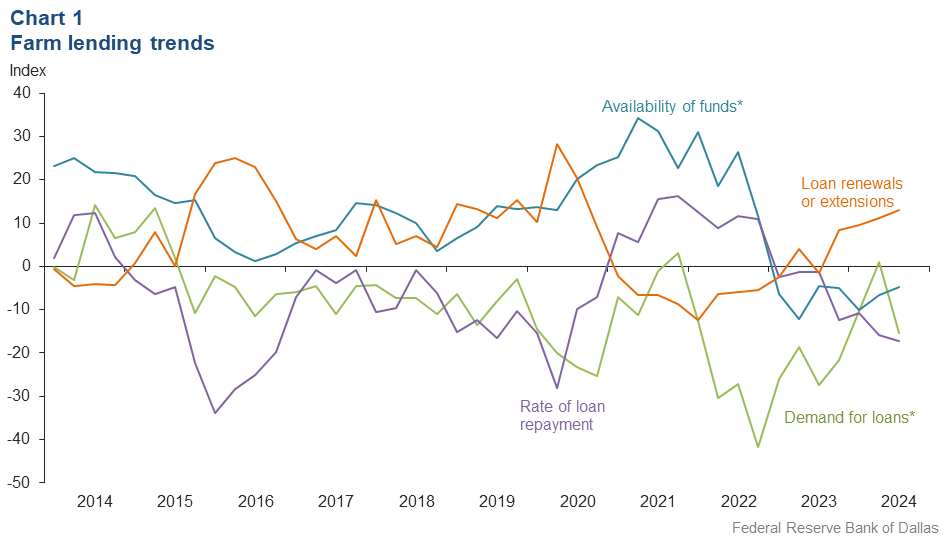
Demand for agricultural loans decreased in the third quarter after increasing last quarter. Loan renewal or extensions continued to increase in the third quarter. The rate of loan repayment declined at an accelerated pace. Except for operating loans, loan volume was down for all remaining categories compared with a year ago (Chart 1).
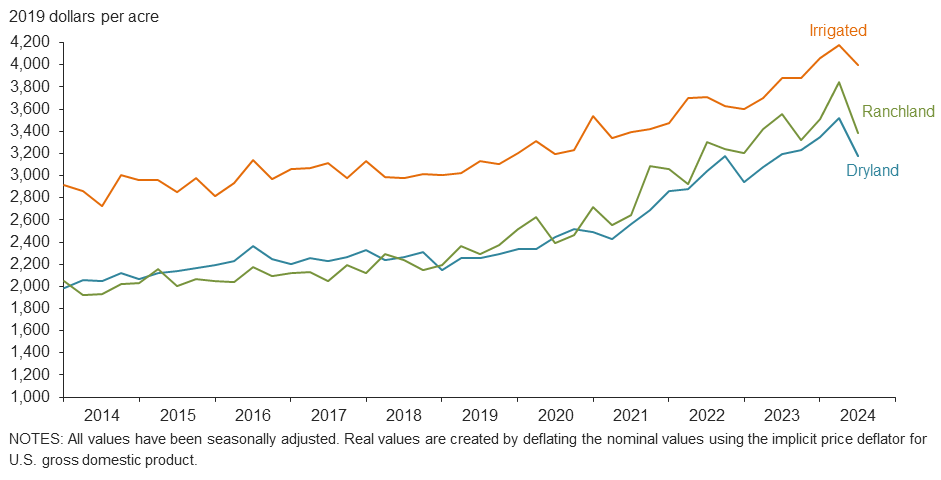
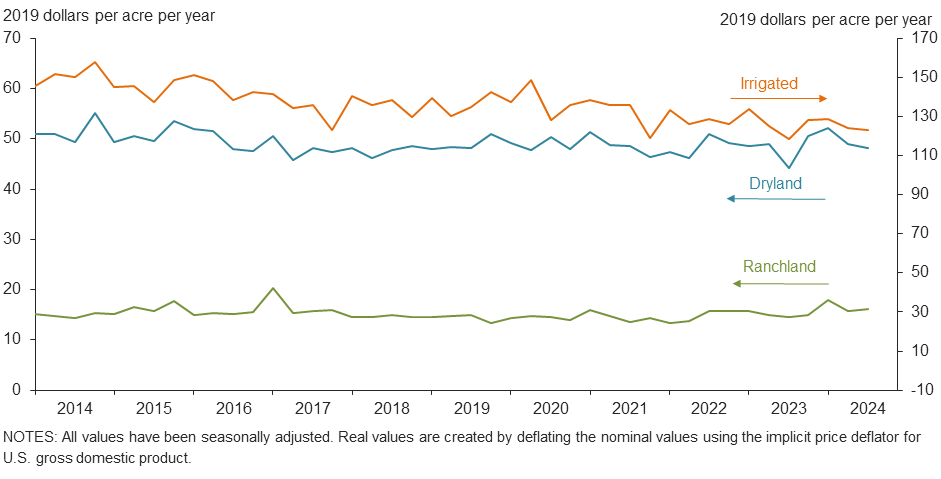
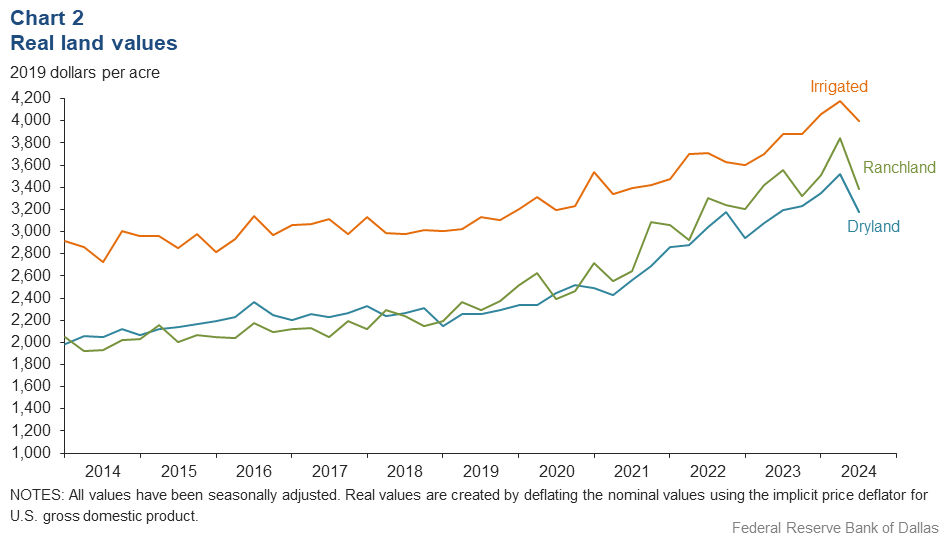
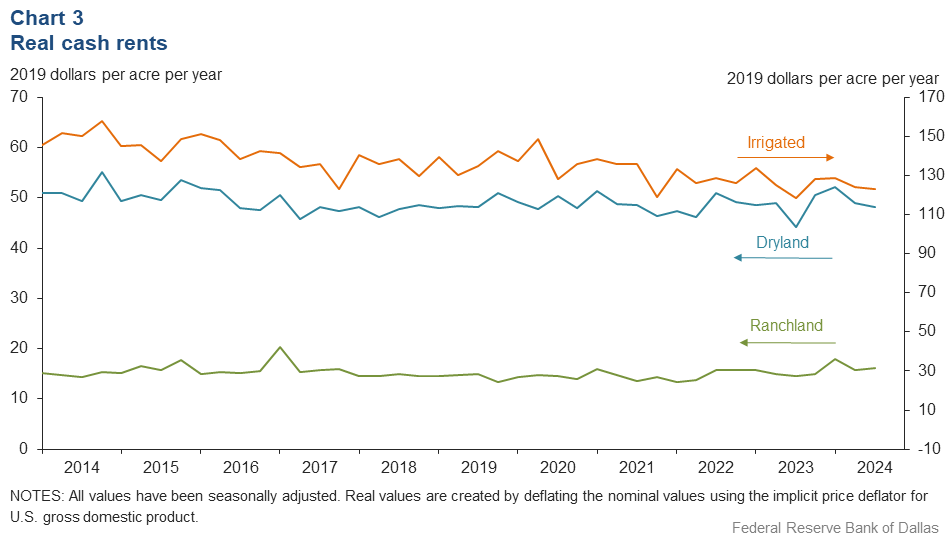
Real land values for dryland, irrigated cropland and ranchland decreased this quarter (Chart 2). Ranchland and irrigated cropland declined around 3 percent year over year and dryland rose a meager 0.3 percent (Table 1). In the third quarter 2024, real cash rents declined for irrigated cropland and dryland while rising slightly for ranchland (Chart 3).
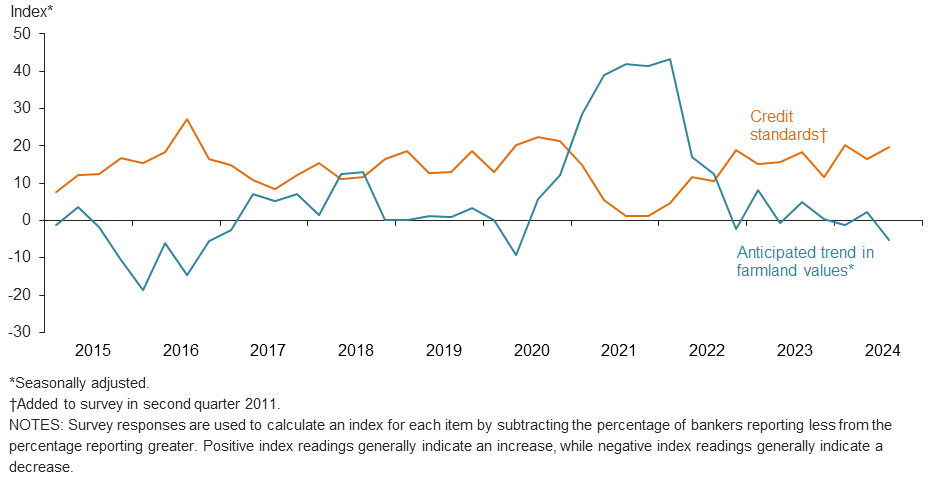
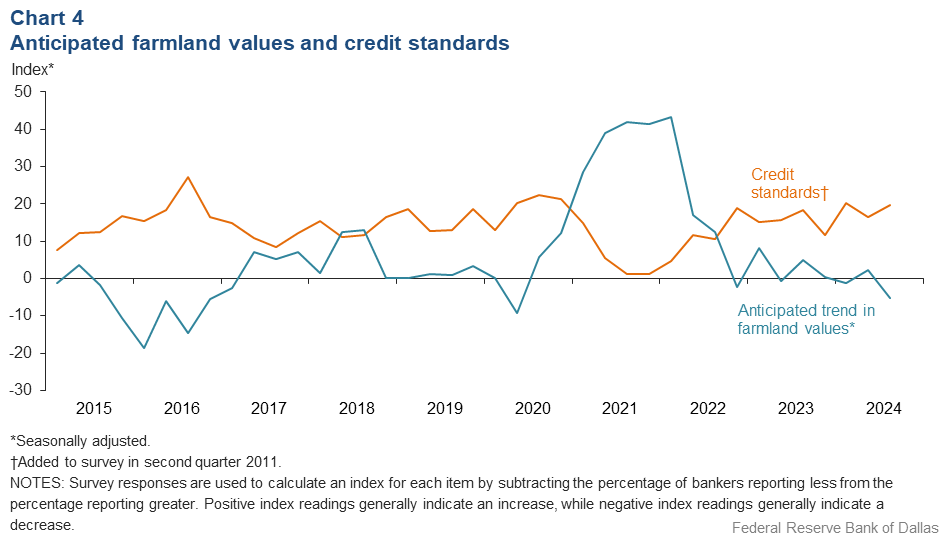
The anticipated trend in the farmland values index turned negative, falling to its lowest level since the spring of 2020. This suggests respondents expect farmland values to decrease significantly. The credit standards index showed an increase in credit tightening but at a faster pace than the second quarter 2024 (Chart 4). Respondents reported interest rates increased or were stable across almost all loan types, reversing the decline in rates that occurred in the second quarter (Table 2).
Next release: December 23, 2024
Agricultural Survey is compiled from a survey of Eleventh District agricultural bankers, and data have been seasonally adjusted as necessary. Data were collected September 3-11, and 73 bankers responded to the survey.
Quarterly comments
District bankers were asked for additional comments concerning agricultural land values and credit conditions. These comments have been edited for publication.
We have continued dry conditions after an extreme heat wave last month. Therefore, wheat pasture will be short.
It’s mostly an insurance year for our dryland producers. The areas that had some rain through planting are still not looking favorable. After a good stand in the field, no moisture through August has left yields likely below average. Cotton prices are shaping up for the low 60-cent level. Below average yields, 60-cent-per-pound prices and elevated inputs will leave most producers with a crop in our area losing net income.
Our area of the Texas Panhandle has been extremely dry. Supplemental feeding of livestock began at the beginning of August. Hay is plentiful due to the wheat and rye that was harvested for hay. Irrigated crops are in fair to good condition, dryland crops are poor to very poor. Depressed prices are a cause for concern.
Recent rain in our area has improved the outlook for everything. However, low crop prices and the high input costs will create a severe problem. There are concerns about the future of crop insurance as well.
We recently had good rains. Farmers are beginning to plow for fall wheat. The cattle market is still strong
Demand for cattle loans continues to be strong.
Hurricane Beryl made landfall in the coastal plains in early July causing widespread damages at the point of harvest for our producers. Several farms totaled out crops and filed for insurance to cover debts and expenses, while others have supplemental hurricane coverage that offsets yield reductions from damage. Loan repayments have accelerated from insurance proceeds but are still comparable to if a crop had been harvested. Grain prices have been depressed, although showing some signs of a rebound, so many producers are holding grain in on-farm storage. Cattle prices have remained stable, and weather conditions have been favorable, resulting in excellent pasture and hay reserves. Downward pressure in cattle futures currently don't materially impact repayment expectations.
So far 2024 has been a tough year for the farmer. However, yields have been exceptional for soybeans and above average for corn. It’s too soon to tell for cotton. The prices are the big stumbling block for the producer this year.
Historical data
Historical data can be downloaded dating back to first quarter 2000.
Charts
Farm lending trends
What changes occurred in non-real-estate farm loans at your bank in the past three months compared with a year earlier?
| Index | Percent reporting, Q3 | ||||
| 2024:Q2 | 2024:Q3 | Greater | Same | Less | |
Demand for loans* | 1.1 | –15.3 | 8.1 | 68.5 | 23.4 |
Availability of funds* | –6.7 | –4.7 | 6.6 | 82.1 | 11.3 |
Rate of loan repayment | –15.9 | –17.1 | 1.4 | 80.0 | 18.6 |
Loan renewals or extensions | 11.1 | 13.0 | 14.5 | 84.1 | 1.5 |
| *Seasonally adjusted. | |||||
What changes occurred in the volume of farm loans made by your bank in the past three months compared with a year earlier?
| Index | Percent reporting, Q3 | ||||
| 2024:Q2 | 2024:Q3 | Greater | Same | Less | |
Non–real–estate farm loans | –8.1 | –11.6 | 10.1 | 68.1 | 21.7 |
Feeder cattle loans* | 2.1 | –7.4 | 7.5 | 77.6 | 14.9 |
Dairy loans* | –2.8 | –6.5 | 0.1 | 93.3 | 6.6 |
Crop storage loans* | –9.6 | –12.1 | 0.9 | 86.1 | 13.0 |
Operating loans | 21.3 | 5.8 | 14.5 | 76.8 | 8.7 |
Farm machinery loans* | –12.3 | –18.4 | 7.0 | 67.6 | 25.4 |
Farm real estate loans* | –19.0 | –20.3 | 3.1 | 73.5 | 23.4 |
| *Seasonally adjusted. NOTES: Survey responses are used to calculate an index for each item by subtracting the percentage of bankers reporting less from the percentage reporting greater. Positive index readings generally indicate an increase, while negative index readings generally indicate a decrease. |
|||||
Real land values
Real cash rents
Anticipated farmland values and credit standards
What trend in farmland values do you expect in your area in the next three months?
| Index | Percent reporting, Q3 | ||||
| 2024:Q2 | 2024:Q3 | Up | Same | Down | |
| Anticipated trend in farmland values* | 2.3 | –5.3 | 6.5 | 81.7 | 11.8 |
| *Seasonally adjusted. | |||||
What change occurred in credit standards for agricultural loans at your bank in the past three months compared with a year earlier?
| 2024:Q2 | 2024:Q3 | Up | Same | Down | |
| Credit standards | 16.4 | 19.7 | 21.1 | 77.5 | 1.4 |
Tables
Rural real estate values—third quarter 2024
| Banks1 | Average value2 | Percent change in value from previous year3 | ||
Cropland–Dryland | ||||
District* | 56 | 3,265 | 0.7 | |
Texas* | 48 | 3,338 | 0.3 | |
1 | Northern High Plains | 7 | 1,161 | 0.4 |
2 | Southern High Plains | 4 | 1,175 | –13.0 |
3 | Northern Low Plains* | n.a. | n.a. | n.a. |
4 | Southern Low Plains* | 5 | 2,183 | –7.7 |
5 | Cross Timbers | 3 | 3,833 | –36.8 |
6 | North Central Texas | 4 | 5,625 | 9.4 |
7 | East Texas* | 3 | 4,113 | 1.3 |
8 | Central Texas | 11 | 9,409 | 8.5 |
9 | Coastal Texas | 3 | 3,083 | 14.2 |
10 | South Texas | n.a. | n.a. | n.a. |
11 | Trans–Pecos and Edwards Plateau | 4 | 5,375 | 0.9 |
12 | Southern New Mexico | n.a. | n.a. | n.a. |
13 | Northern Louisiana | 6 | 4,175 | 6.6 |
Cropland–Irrigated | ||||
District* | 43 | 4,108 | –2.0 | |
Texas* | 33 | 3,467 | –3.4 | |
1 | Northern High Plains | 7 | 3,136 | –2.1 |
2 | Southern High Plains | 4 | 2,500 | –16.7 |
3 | Northern Low Plains* | n.a. | n.a. | n.a. |
4 | Southern Low Plains | 3 | 2,833 | 10.4 |
5 | Cross Timbers | n.a. | n.a. | n.a. |
6 | North Central Texas | n.a. | n.a. | n.a. |
7 | East Texas | n.a. | n.a. | n.a. |
8 | Central Texas | 4 | 7,375 | 11.8 |
9 | Coastal Texas | n.a. | n.a. | n.a. |
10 | South Texas | n.a. | n.a. | n.a. |
11 | Trans–Pecos and Edwards Plateau | 3 | 5,167 | –1.3 |
12 | Southern New Mexico | 4 | 8,815 | 0.0 |
13 | Northern Louisiana | 6 | 5,583 | 3.1 |
Ranchland | ||||
District* | 60 | 3,474 | –2.8 | |
Texas* | 52 | 4,128 | –3.1 | |
1 | Northern High Plains | 7 | 1,271 | 13.3 |
2 | Southern High Plains | 3 | 1,167 | 0.0 |
3 | Northern Low Plains | n.a. | n.a. | n.a. |
4 | Southern Low Plains* | 5 | 2,466 | –4.1 |
5 | Cross Timbers | 3 | 4,250 | –50.0 |
6 | North Central Texas | 4 | 5,875 | 8.8 |
7 | East Texas | 8 | 5,025 | –0.2 |
8 | Central Texas | 11 | 11,591 | 2.2 |
9 | Coastal Texas | n.a. | n.a. | n.a. |
10 | South Texas | n.a. | n.a. | n.a. |
11 | Trans–Pecos and Edwards Plateau | 6 | 4,217 | 3.8 |
12 | Southern New Mexico | 3 | 642 | 5.6 |
13 | Northern Louisiana | 5 | 3,110 | 3.7 |
| *Seasonally adjusted. 1 Number of banks reporting land values. 2 Prices are dollars per acre, not adjusted for inflation. 3 Not adjusted for inflation and calculated using responses only from those banks reporting in both the past and current quarter. n.a.—Not published due to insufficient responses but included in totals for Texas and district. |
||||
Interest rates by loan type—third quarter 2024
| Feeder cattle | Other farm operating | Intermediate term | Long-term farm real estate | Fixed (average rate, percent) |
2023:Q3 | 9.26 | 9.22 | 8.98 | 8.66 |
2023:Q4 | 9.43 | 9.35 | 9.23 | 8.76 |
2024:Q1 | 9.31 | 9.32 | 9.07 | 8.69 |
2024:Q2 | 9.19 | 9.23 | 8.93 | 8.58 |
2024:Q3 | 9.19 | 9.19 | 8.92 | 8.63 | Fixed (average rate, percent) |
2023:Q3 | 9.39 | 9.38 | 9.09 | 8.83 |
2023:Q4 | 9.53 | 9.48 | 9.32 | 8.89 |
2024:Q1 | 9.51 | 9.49 | 9.27 | 8.88 |
2024:Q2 | 9.30 | 9.31 | 9.06 | 8.71 |
2024:Q3 | 9.40 | 9.37 | 9.07 | 8.71 |
For More Information
Questions regarding the Agricultural Survey can be addressed to Mariam Yousuf at Mariam.Yousuf@dal.frb.org.

