Agricultural Survey

Survey highlights
Bankers responding to the fourth-quarter agricultural survey reported persistent weak conditions across most regions of the Eleventh District. The lack of rain and heat in the late summer months resulted in a weak cotton harvest, but recent rains have improved the outlook for crops planted this quarter. Farmers remain reliant on insurance for cash flow. The cattle market remains resilient, although drought conditions might force an early sell-off.
“We experienced a poor cotton crop this growing season due to the hot and dry conditions throughout much of the region. However, we have had significant rain of late and are hopeful for a decent wheat crop,” one survey participant reported.
Unfavorable weather, high input costs, and low commodity prices made reliance on insurance the financially sound option, as another respondent noted: “Increased input costs, lower than break-even prices and weak moisture have caused significant net losses in some cases. Producers that had their crop insured earlier in the cycle performed much better than producers that took a crop to harvest.”
Despite the overall pessimism for current ag conditions, a few respondents noted newfound optimism in the industry due to the presidential election results. As one respondent said: “Since the presidential election customers have hope again.”
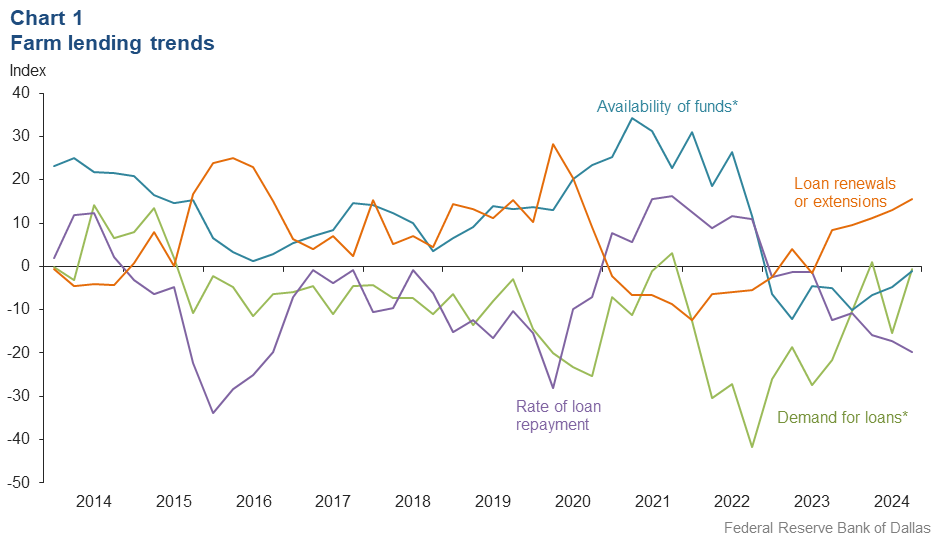
Demand for agricultural loans and availability of funds were stable in the fourth quarter after decreasing last quarter (Chart 1). Loan renewal or extensions continued to increase in the fourth quarter. The rate of loan repayment continued to decline at the fastest pace since second quarter of 2020. Except for operating loans and feeder cattle loans, loan volume was down for all remaining categories compared with a year ago.
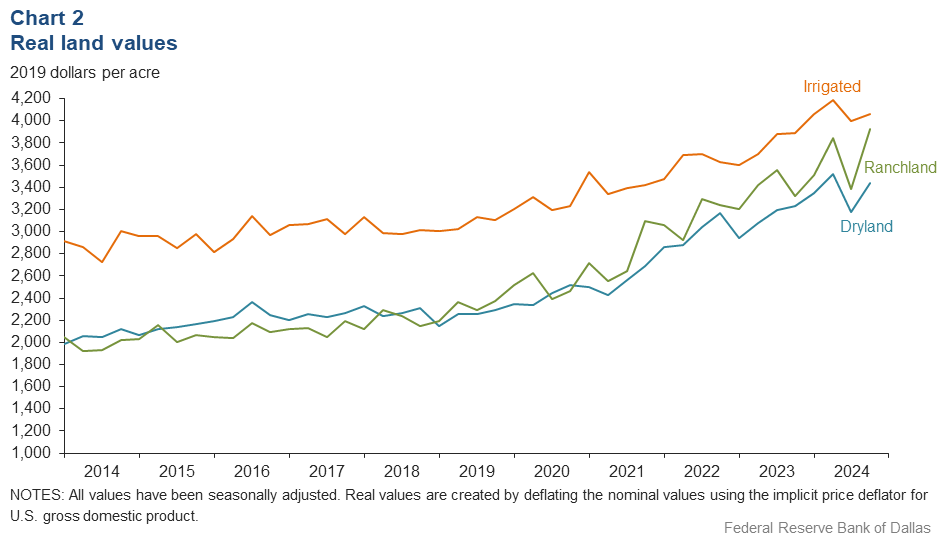
Real land values for dryland, irrigated cropland and ranchland increased this quarter (Chart 2). Ranchland and dryland increased by more than 6 percent year over year, and irrigated cropland rose a meager 0.6 percent (Table 1).
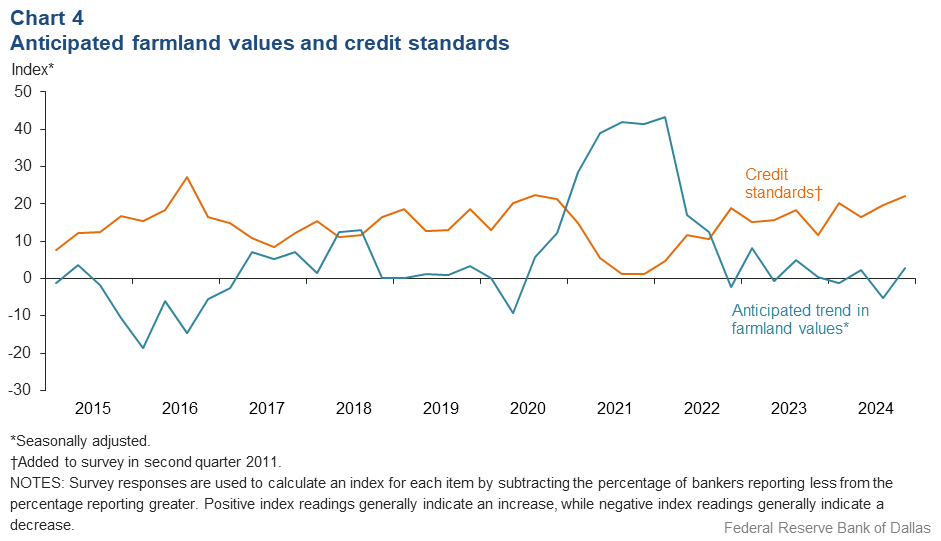
The anticipated trend in farmland values index turned barely positive in the fourth quarter after declining in the previous quarter. This implies respondents expect farmland values to continue to rise but not substantially. The credit standards index showed an increase in credit tightening at a similar pace as third quarter 2024 (Chart 4). Respondents reported interest rate decreases across all types in the current quarter (Table 2).
Next release: March 24, 2025
Agricultural Survey is compiled from a survey of Eleventh District agricultural bankers, and data have been seasonally adjusted as necessary. Data were collected December 3-11, and 73 bankers responded to the survey.
Quarterly comments

District bankers were asked for additional comments concerning agricultural land values and credit conditions. These comments have been edited for publication.
Extreme heat, winds, reduced rainfall amounts during the late summer growing season resulted in poor dry land and marginal irrigated crops. Low commodity prices will also lower the prospects of significant profits for the 2024 crop year. Proposed disaster payments will be greatly needed to reduce potential losses in the West Texas region.
Very difficult year for our producers. Increased input costs, lower than break-even prices and weak moisture have caused significant net losses in some cases. Producers that had their crop insured earlier in the cycle performed much better than producers that took a crop to harvest. Moreover, our gins are in bad shape. Some local gins are going on the third year of no bales ginned. The situation has put many in a dire financial situation.
Low commodity prices on crops coupled with continued drought in our area have reduced farm income significantly and payout projections for the 2024 crop year. Because of those reasons, equipment values have plummeted. Farm loan renewals are going to be challenging without help of some type.
The cattle market continues to be the bright spot. September and November rains helped the pastures, filled the stock ponds and led fall-seeded crops to be above average. Very little cotton was harvested with most shredded because production won't cover harvest cost with the low yield and price compared to taking the insurance adjusted yield and seed rebate.
We experienced a poor cotton crop this growing season due to the hot and dry conditions throughout much of the region. However, we have had significant rain of late and are hopeful for a decent wheat crop. The cattle market has been holding strong, helping to build equity margins for our customers involved in the cattle industry.
Loan requests have increased with the drop in interest rates and the completed presidential election. Stocker and feeder cattle operators are requesting additional funds with the rise in the cattle complex.
We have seen a reduction in new farm operating requests in comparison to the fourth quarter of 2023 due to weak commodity pricing and tighter cash flow budgets based on futures. Loan volume is currently composed of renewals or extensions of current year operating loans due to decreased farm income. Overall, I see a weakened agriculture farm sector based on the commodity price dynamics and the lack of a new farm bill to offer safety net assurance to growers. Cattle prices remain strong and stable, but lingering drought conditions along the Texas Gulf Coast region may force a sell-off as we approach cooler temperatures and forage stores diminish. A sell-off would weaken the local cattle market even though overall breeding stock numbers remain below historical supply. Knowing the weaknesses in the market, credit underwriting has tightened, and we are reviewing financials and budgets more closely and moving borrowers to the Farm Service Agency’s guaranty programs when necessary.
Cattle-calf prices are excellent. Commodity feed and forage prices are very soft, leading farmers to hold on to inventory hoping for better dollars. Drought continues to be an issue for the entire area, but some improvements are noted.
Since the presidential election customers have hope again.
Historical data
Historical data can be downloaded dating back to first quarter 2000.
Charts
Farm lending trends
What changes occurred in non-real-estate farm loans at your bank in the past three months compared with a year earlier?
| Index | Percent reporting, Q4 | ||||
| 2024:Q3 | 2024:Q4 | Greater | Same | Less | |
Demand for loans* | –15.3 | –0.7 | 15.3 | 68.7 | 16.0 |
Availability of funds* | –4.7 | –1.1 | 7.7 | 83.5 | 8.8 |
Rate of loan repayment | –17.1 | –19.7 | 0.0 | 80.3 | 19.7 |
Loan renewals or extensions | 13.0 | 15.5 | 15.5 | 84.5 | 0.0 |
| *Seasonally adjusted. | |||||

What changes occurred in the volume of farm loans made by your bank in the past three months compared with a year earlier?
| Index | Percent reporting, Q4 | ||||
| 2024:Q3 | 2024:Q4 | Greater | Same | Less | |
Non–real–estate farm loans | –11.6 | –1.4 | 12.7 | 73.2 | 14.1 |
Feeder cattle loans* | –7.4 | 6.3 | 16.7 | 72.9 | 10.4 |
Dairy loans* | –6.5 | –6.3 | 0.2 | 93.3 | 6.5 |
Crop storage loans* | –12.1 | –15.7 | 0.0 | 84.3 | 15.7 |
Operating loans | 5.8 | 5.8 | 20.3 | 65.2 | 14.5 |
Farm machinery loans* | –18.4 | –18.0 | 6.2 | 69.6 | 24.2 |
Farm real estate loans* | –20.3 | –7.9 | 7.4 | 77.3 | 15.3 |
| *Seasonally adjusted. NOTES: Survey responses are used to calculate an index for each item by subtracting the percentage of bankers reporting less from the percentage reporting greater. Positive index readings generally indicate an increase, while negative index readings generally indicate a decrease. |
|||||
Real land values

Real cash rents

Anticipated farmland values and credit standards
What trend in farmland values do you expect in your area in the next three months?
| Index | Percent reporting, Q4 | ||||
| 2024:Q3 | 2024:Q4 | Up | Same | Down | |
| Anticipated trend in farmland values* | –5.3 | 2.9 | 9.1 | 84.7 | 6.2 |
| *Seasonally adjusted. | |||||
What change occurred in credit standards for agricultural loans at your bank in the past three months compared with a year earlier?
| 2024:Q3 | 2024:Q4 | Up | Same | Down | |
| Credit standards | 19.7 | 22.1 | 22.1 | 77.9 | 0.0 |

Tables
Rural real estate values—fourth quarter 2024
| Banks1 | Average value2 | Percent change in value from previous year3 | ||
Cropland–Dryland | ||||
District* | 50 | 3,545 | 11.1 | |
Texas* | 42 | 3,648 | 11.4 | |
1 | Northern High Plains | 5 | 1,240 | –1.9 |
2 | Southern High Plains | 6 | 1,442 | 17.2 |
3 | Northern Low Plains* | n.a. | n.a. | n.a. |
4 | Southern Low Plains* | 3 | 2,124 | 3.4 |
5 | Cross Timbers | n.a. | n.a. | n.a. |
6 | North Central Texas | 5 | 6,950 | 41.7 |
7 | East Texas* | n.a. | n.a. | n.a. |
8 | Central Texas | 8 | 8,725 | 11.4 |
9 | Coastal Texas | 4 | 3,375 | 7.1 |
10 | South Texas | 3 | 3,067 | –6.3 |
11 | Trans–Pecos and Edwards Plateau | n.a. | n.a. | n.a. |
12 | Southern New Mexico | 3 | 583 | 0.0 |
13 | Northern Louisiana | 5 | 3,800 | 6.7 |
Cropland–Irrigated | ||||
District* | 42 | 4,189 | 3.7 | |
Texas* | 33 | 3,500 | 0.6 | |
1 | Northern High Plains | 5 | 3,380 | –0.8 |
2 | Southern High Plains | 6 | 2,625 | 8.5 |
3 | Northern Low Plains* | n.a. | n.a. | n.a. |
4 | Southern Low Plains | 3 | 2,667 | 0.0 |
5 | Cross Timbers | n.a. | n.a. | n.a. |
6 | North Central Texas | n.a. | n.a. | n.a. |
7 | East Texas | 3 | 6,233 | –11.0 |
8 | Central Texas | 3 | 5,667 | –3.6 |
9 | Coastal Texas | n.a. | n.a. | n.a. |
10 | South Texas | 3 | 4,367 | 0.0 |
11 | Trans–Pecos and Edwards Plateau | n.a. | n.a. | n.a. |
12 | Southern New Mexico | 4 | 9,315 | 10.4 |
13 | Northern Louisiana | 5 | 5,700 | 10.7 |
Ranchland | ||||
District* | 54 | 4,048 | 5.8 | |
Texas* | 45 | 4,832 | 6.0 | |
1 | Northern High Plains | 5 | 1,320 | 10.6 |
2 | Southern High Plains | 4 | 1,388 | 11.0 |
3 | Northern Low Plains | n.a. | n.a. | n.a. |
4 | Southern Low Plains* | 3 | 2,573 | 4.2 |
5 | Cross Timbers | n.a. | n.a. | n.a. |
6 | North Central Texas | 5 | 7,650 | 35.7 |
7 | East Texas | 7 | 5,671 | –4.3 |
8 | Central Texas | 8 | 11,625 | 9.6 |
9 | Coastal Texas | 3 | 4,583 | 9.4 |
10 | South Texas | 3 | 3,233 | 0.0 |
11 | Trans–Pecos and Edwards Plateau | 4 | 5,750 | 7.1 |
12 | Southern New Mexico | 4 | 663 | 1.1 |
13 | Northern Louisiana | 5 | 3,150 | 7.9 |
| *Seasonally adjusted. 1 Number of banks reporting land values. 2 Prices are dollars per acre, not adjusted for inflation. 3 Not adjusted for inflation and calculated using responses only from those banks reporting in both the past and current quarter. n.a.—Not published due to insufficient responses but included in totals for Texas and district. |
||||
Interest rates by loan type—fourth quarter 2024
| Feeder cattle | Other farm operating | Intermediate term | Long-term farm real estate | Fixed (average rate, percent) |
2023:Q4 | 9.43 | 9.35 | 9.23 | 8.76 |
2024:Q1 | 9.31 | 9.32 | 9.07 | 8.69 |
2024:Q2 | 9.19 | 9.23 | 8.93 | 8.58 |
2024:Q3 | 9.19 | 9.19 | 8.92 | 8.63 |
2024:Q4 | 8.72 | 8.77 | 8.54 | 8.18 | Fixed (average rate, percent) |
2023:Q4 | 9.53 | 9.48 | 9.32 | 8.89 |
2024:Q1 | 9.51 | 9.49 | 9.27 | 8.88 |
2024:Q2 | 9.30 | 9.31 | 9.06 | 8.71 |
2024:Q3 | 9.40 | 9.37 | 9.07 | 8.71 |
2024:Q4 | 8.82 | 8.82 | 8.59 | 8.20 |
For More Information
Questions regarding the Agricultural Survey can be addressed to Mariam Yousuf at Mariam.Yousuf@dal.frb.org.