Agricultural Survey

Survey highlights
Bankers responding to the second-quarter survey reported stable but depressed conditions across most of the Eleventh District. Parts of the region received much needed rain, but other parts did not. Generally, commodity prices remained low while cattle prices remained high. Concerns about profitability persist as input prices increased further because of the conflict in the Middle East. The outlook for the next growing season improved, as weather is anticipated to bring much needed rain to most of the District.
Profitability concerns were noted by several participants. One commented, “[D]epressed commodity prices combined with inflated input costs are going to make margins extremely tight.” While another noted, “Farming is not projected to be profitable based on today’s prices.” For ranchers, selling prices are not the main issue, as one survey respondent stated, “The cattle market is still historically high.” The bigger concern for ranchers is the spread of the New World screwworm: “The threat of New World screwworm crossing the border is on people's minds.” The forecasted rain is improving outlook across the District: “The promise of a super El Niño weather pattern is also welcomed across the board.”
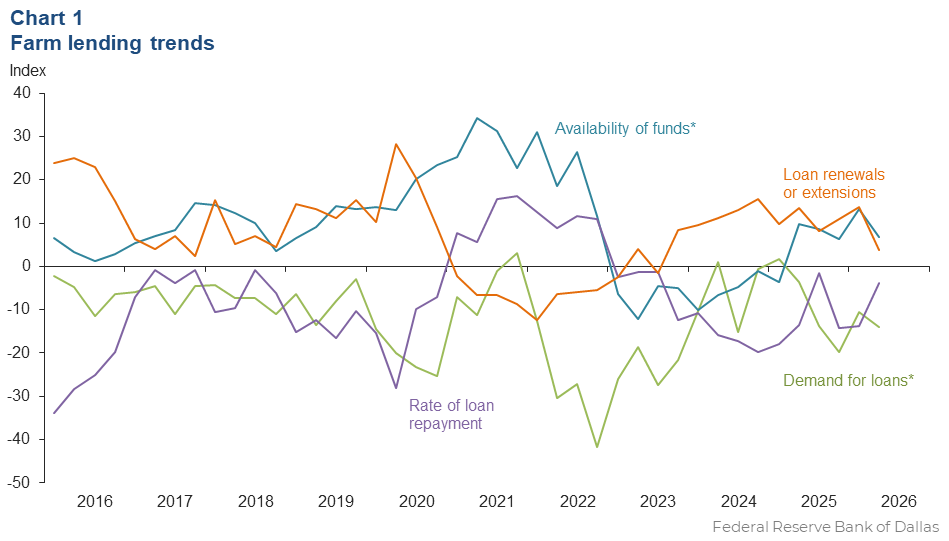
Demand for agricultural loans continued to decline while availability of funds continued to increase in the first quarter. The rate of loan repayment decreased, but at a significantly slower pace than the prior quarter. Loan renewals or extensions continued to rise. Loan volume declined compared to a year ago for all loan categories (Chart 1).
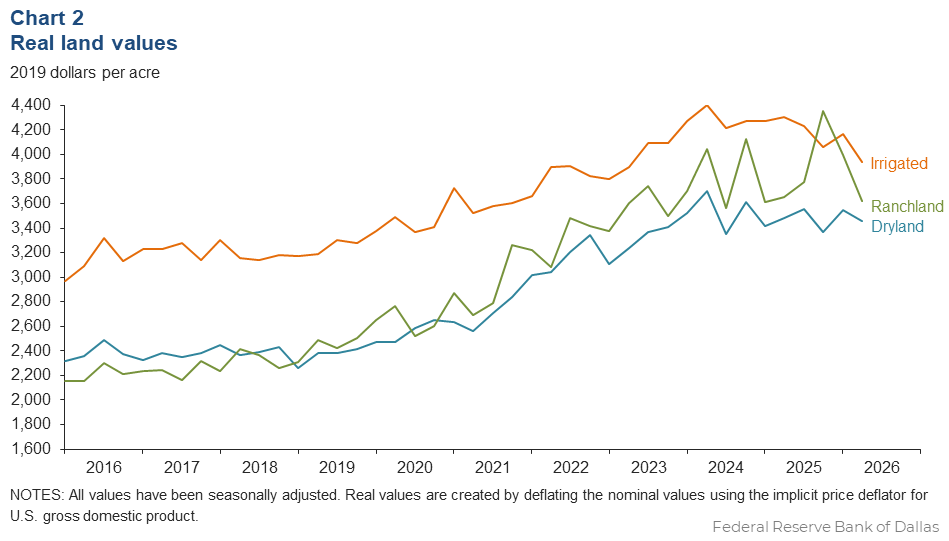
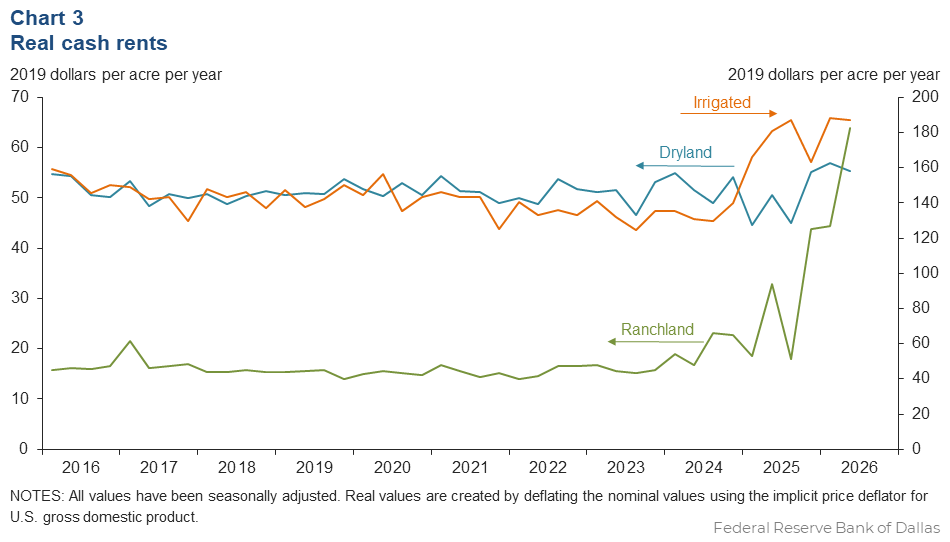
Real land values for dryland, irrigated land and ranchland declined this quarter (Chart 2). However, dryland and ranchland values grew at 3 and 8 percent, respectively, compared to last year, while irrigated land values were flat in the District (Table 1). In the second quarter of 2026, real cash rents rose for ranchland and were slightly down for irrigated and dryland (Chart 3).
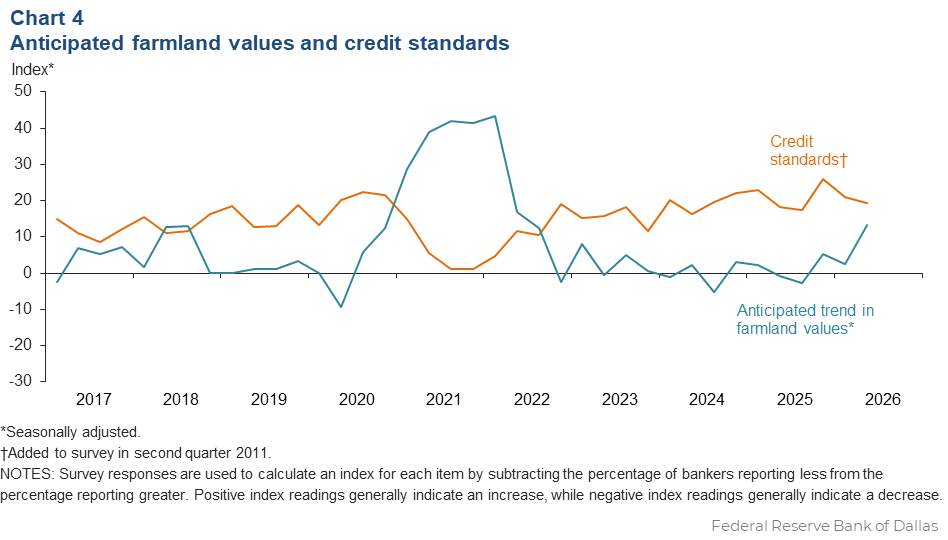
The anticipated trend in farmland values index jumped in the second quarter. This implies respondents expect farmland values to increase. Competition from non-ag uses was cited as a reason for increased land values. The credit standards index showed an increase in credit tightening (Chart 4); however, interest rates declined for all types in the current quarter (Table 2).
Next release: September 21, 2026
Agricultural Survey is compiled from a survey of Eleventh District agricultural bankers, and data have been seasonally adjusted as necessary. Data were collected June 1–10, and 53 bankers responded to the survey.
Tables
Rural real estate values—second quarter 2026
| Banks1 | Average value2 | Percent change in value from previous year3 | ||
Cropland–Dryland | ||||
District* | 39 | 3,569 | 7.5 | |
Texas* | 34 | 3,642 | 7.7 | |
1 | Northern High Plains | 7 | 1,293 | 6.7 |
2 | Southern High Plains | 3 | 1,633 | 23.4 |
3 | Northern Low Plains* | n.a. | n.a. | n.a. |
4 | Southern Low Plains* | 3 | 2,360 | 20.0 |
5 | Cross Timbers | n.a. | n.a. | n.a. |
6 | North Central Texas | 4 | 7,750 | 6.0 |
7 | East Texas* | n.a. | n.a. | n.a. |
8 | Central Texas | 6 | 7,617 | 14.9 |
9 | Coastal Texas | n.a. | n.a. | n.a. |
10 | South Texas | n.a. | n.a. | n.a. |
11 | Trans–Pecos and Edwards Plateau | n.a. | n.a. | n.a. |
12 | Southern New Mexico | 3 | 733 | 29.3 |
13 | Northern Louisiana | n.a. | n.a. | n.a. |
Cropland–Irrigated | ||||
District* | 37 | 4,062 | –0.2 | |
Texas* | 31 | 3,366 | –2.5 | |
1 | Northern High Plains | 7 | 2,857 | –5.7 |
2 | Southern High Plains | 3 | 2,667 | –2.2 |
3 | Northern Low Plains* | n.a. | n.a. | n.a. |
4 | Southern Low Plains | 3 | 3,917 | 16.7 |
5 | Cross Timbers | n.a. | n.a. | n.a. |
6 | North Central Texas | 3 | 8,167 | –2.0 |
7 | East Texas | n.a. | n.a. | n.a. |
8 | Central Texas | 5 | 6,800 | –1.1 |
9 | Coastal Texas | n.a. | n.a. | n.a. |
10 | South Texas | n.a. | n.a. | n.a. |
11 | Trans–Pecos and Edwards Plateau | n.a. | n.a. | n.a. |
12 | Southern New Mexico | 4 | 8,875 | 6.0 |
13 | Northern Louisiana | n.a. | n.a. | n.a. |
Ranchland | ||||
District* | 47 | 3,733 | 3.0 | |
Texas* | 41 | 4,467 | 3.6 | |
1 | Northern High Plains | 7 | 1,143 | –14.1 |
2 | Southern High Plains | 3 | 1,517 | 22.2 |
3 | Northern Low Plains | n.a. | n.a. | n.a. |
4 | Southern Low Plains* | 3 | 2,595 | 15.9 |
5 | Cross Timbers | n.a. | n.a. | n.a. |
6 | North Central Texas | 4 | 8,000 | 4.1 |
7 | East Texas | 5 | 4,500 | 18.2 |
8 | Central Texas | 8 | 11,313 | 13.6 |
9 | Coastal Texas | n.a. | n.a. | n.a. |
10 | South Texas | 3 | 4,100 | –6.4 |
11 | Trans–Pecos and Edwards Plateau | 3 | 4,833 | 0.0 |
12 | Southern New Mexico | 4 | 563 | –15.1 |
13 | Northern Louisiana | n.a. | n.a. | n.a. |
| *Seasonally adjusted. 1 Number of banks reporting land values. 2 Prices are dollars per acre, not adjusted for inflation. 3 Not adjusted for inflation and calculated using responses only from those banks reporting in both the past and current quarter. n.a.—Not published due to insufficient responses but included in totals for Texas and district. |
||||
Interest rates by loan type—second quarter 2026
| Feeder cattle | Other farm operating | Intermediate term | Long-term farm real estate | Fixed (average rate, percent) |
2025:Q2 | 8.51 | 8.53 | 8.20 | 7.88 |
2025:Q3 | 8.35 | 8.30 | 8.11 | 7.84 |
2025:Q4 | 8.06 | 8.06 | 7.87 | 7.38 |
2026:Q1 | 7.76 | 7.83 | 7.62 | 7.34 |
2026:Q2 | 7.41 | 7.38 | 7.24 | 7.00 | Variable (average rate, percent) |
2025:Q2 | 8.48 | 8.49 | 8.12 | 7.96 |
2025:Q3 | 8.45 | 8.38 | 8.09 | 7.76 |
2025:Q4 | 8.07 | 8.12 | 7.92 | 7.54 |
2026:Q1 | 7.85 | 7.89 | 7.76 | 7.42 |
2026:Q2 | 7.29 | 7.36 | 7.16 | 7.00 |
Charts
Farm lending trends
What changes occurred in non-real-estate farm loans at your bank in the past three months compared with a year earlier?
| Index | Percent reporting, Q2 | ||||
| 2026:Q1 | 2026:Q2 | Greater | Same | Less | |
Demand for loans* | –10.6 | –13.9 | 9.6 | 67.0 | 23.5 |
Availability of funds* | 13.2 | 6.8 | 11.8 | 83.2 | 5.0 |
Rate of loan repayment | –13.8 | –3.9 | 5.8 | 84.6 | 9.6 |
Loan renewals or extensions | 13.8 | 3.9 | 9.6 | 84.6 | 5.8 |
| *Seasonally adjusted. | |||||
What changes occurred in the volume of farm loans made by your bank in the past three months compared with a year earlier?
| Index | Percent reporting, Q2 | ||||
| 2026:Q1 | 2026:Q2 | Greater | Same | Less | |
Non–real–estate farm loans | –1.8 | –23.1 | 3.9 | 69.2 | 26.9 |
Feeder cattle loans* | –6.2 | –10.1 | 12.5 | 64.9 | 22.6 |
Dairy loans* | –3.7 | –11.0 | 0.0 | 89.0 | 11.0 |
Crop storage loans* | 8.9 | –12.7 | 3.7 | 79.9 | 16.4 |
Operating loans | 5.3 | –5.9 | 9.8 | 74.5 | 15.7 |
Farm machinery loans* | –27.4 | –25.8 | 0.0 | 74.2 | 25.8 |
Farm real estate loans* | –17.5 | –10.9 | 6.9 | 75.3 | 17.8 |
| *Seasonally adjusted. NOTES: Survey responses are used to calculate an index for each item by subtracting the percentage of bankers reporting less from the percentage reporting greater. Positive index readings generally indicate an increase, while negative index readings generally indicate a decrease. |
|||||
Real land values
Real cash rents
Anticipated farmland values and credit standards
What trend in farmland values do you expect in your area in the next three months?
| Index | Percent reporting, Q2 | ||||
| 2026:Q1 | 2026:Q2 | Up | Same | Down | |
| Anticipated trend in farmland values* | 2.6 | 13.2 | 18.7 | 75.8 | 5.5 |
| *Seasonally adjusted. | |||||
What change occurred in credit standards for agricultural loans at your bank in the past three months compared with a year earlier?
| 2026:Q1 | 2026:Q2 | Up | Same | Down | |
| Credit standards | 21.1 | 19.2 | 19.2 | 80.8 | 0.0 |
Quarterly comments

District bankers were asked for additional comments concerning agricultural land values and credit conditions. Some comments have been edited for grammar and clarity.
- It needs to rain.
- The cattle market is still historically high. Replacement feeder cattle are not projected to break even based on the futures board. Cows are still being sent to packers due to high market and drought conditions. Farming is not projected to be profitable based on today’s prices.
- The cost of fuel and fuel-related fertilizer and chemical products is greatly increased due to rising oil prices associated with the Iran conflict. Commodity prices decreased early in the year due to exports associated with embargos. December and March [2027] futures have improved, generating a more motivated market resulting in forward acre cotton contracts being available for local producers. Drought conditions continue in the West Texas area, but prospects of rain chances improving this week are critical for planting time.
- This has been one of the driest wheat-growing seasons on record and the impact shows: wheat harvested for grain has fallen to its lowest level in more than 50 years. Cow–calf producers are holding on, thanks to strong cattle prices, but even they are beginning to feel the strain as grass and water supplies continue to dwindle. We’ve finally received some much-needed rainfall over the past few weeks, and forecasts are pointing toward a wetter season ahead. For now, we hold onto hope and look forward to what the next growing season may bring.
- Wheat crop production potential and price improved in April and May. The rain and damp, cool days have resulted in many fields having sprouted wheat at harvest. Some fields may be destroyed and not harvested.
- With the wet spring in some of our markets, there's general concern about some of the wheat farmers being able to get their crop out without issue.
- Agricultural land in the area continues to be sold for commercial development. The number of farmers and ranchers continues to decline. For those that are left, depressed commodity prices combined with inflated input costs are going to make margins extremely tight.
- Recent rains have improved moods, and the country is greening up. The threat of New World screwworm crossing the border is on people's minds. Feeder cattle are priced very high and local yards are operating below their normal levels. There is not a big demand for feedlot loans at the moment.
- Agricultural land values in deep South Texas remain stable, with some modest appreciation driven by continued demand for rural properties, population growth and urban expansion. Notably, the premium between irrigated and non-irrigated land is narrowing, likely reflecting water scarcity and uncertainty around irrigation availability. South Texas experienced significant drought conditions through late May, marked by high temperatures and below-average rainfall. These conditions adversely affected crop potential, pasture and rangeland quality and water supplies. Recent rainfall has provided partial relief, improving both crop conditions and forage availability. Row crops had a challenging start due to limited initial moisture. While fields are now established and growing, crop maturity varies considerably, and pest pressure has been elevated. As a result, the harvest season is expected to be prolonged and potentially delayed. The onion harvest is complete with growers facing low prices and a tough growing season, making profits difficult. A bright spot this year is citrus. The 2025-26 citrus harvest is complete with overall production and quality better than last year.
- Depressed forage commodity prices continue to stress forecasted cash flow for farmers. Livestock commodity prices continue to hold strong. Rainfall received in mid-May and early June has been welcomed by farmers and ranchers alike. The promise of a super El Niño weather pattern is also welcomed across the board, with hopes that it will carry into the winter and provide much needed snowpack moisture to replenish springs, rivers and lakes.
- Construction is in full swing at the data center site. Land acquisition has severely disrupted land values in the area. The would-be sellers in the region all think that their land is now worth what the data center builder gave for the initial land purchases. There have been thousands of acres of farmland taken out of production for this data center site and thousands of acres put into some type of housing for the influx of workers from all across the nation. Nothing is as it was two years ago. With the expectation of millions of gallons of water needed to keep this facility operating, there are some legitimate concerns about the water table. Time will tell if the concerns are legitimate or just things people worry about.
Historical data
Historical data can be downloaded dating back to first quarter 2000.
For More Information
Questions regarding the Agricultural Survey can be addressed to Mariam Yousuf at Mariam.Yousuf@dal.frb.org.