Agricultural Survey


Survey highlights
Bankers responding to the third-quarter survey reported deteriorating conditions across most of the Eleventh District. The heat and lack of rain are negatively affecting yields. Ranchers are culling or considering culling cattle herds because of the dry grazing conditions. Despite increasing commodity prices, concerns about profitability endure as input prices remain elevated and yields weak. Many producers continue to rely on crop insurance. The outlook for the growing season depends on the arrival of rain and cooler temperatures.
The adverse weather and climate are heavily weighing on respondents. One noted, “Extreme drought and excessive heat have greatly hampered all crops and livestock production.” For ranchers, the conditions are drying out pastures and ponds to the extent that one participant said it’s “forcing producers to make difficult decisions about their operations…reduce their herds substantially or, in some cases, exit the cattle business altogether.” In addition, ag bankers are concerned about the disappearance of ag land due to increased competition from other commercial developments. One banker summarized the trend: “Ag is slowing down with significant acreage being converted to data [centers] and alternative energy sources.”
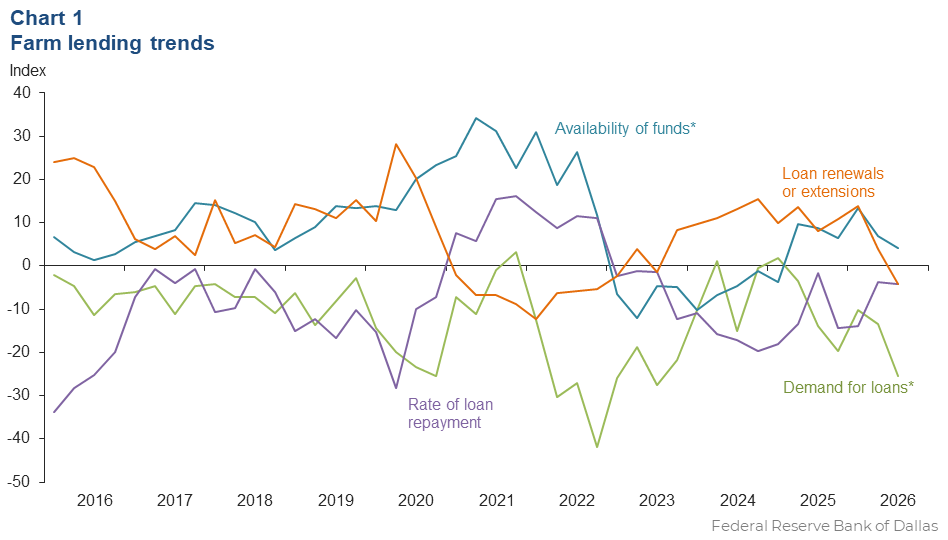
Demand for agricultural loans continued to decline while availability of funds continued to increase in the third quarter. The rate of loan repayment decreased at a similar pace to the prior quarter. Loan renewals or extensions dropped for the first time since 2023. Loan volume declined compared to a year ago for all loan categories (Chart 1).
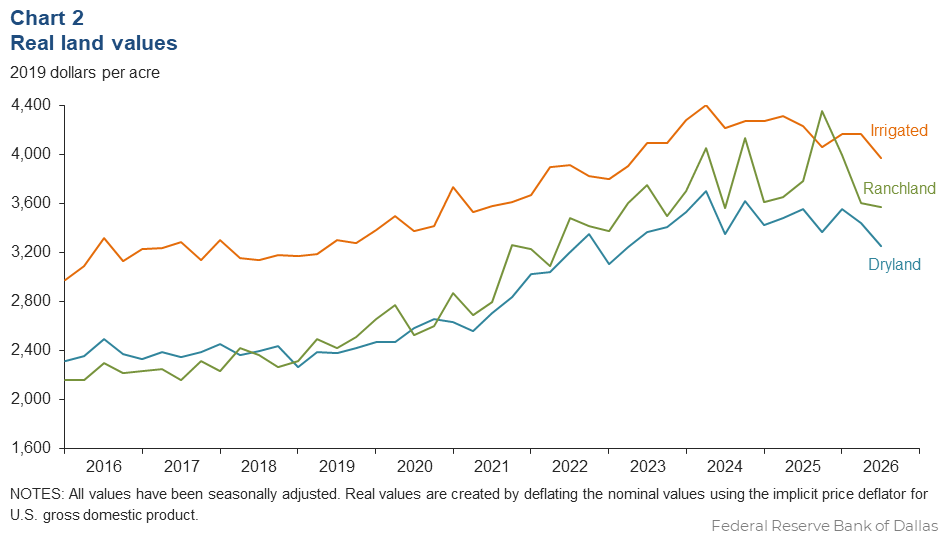
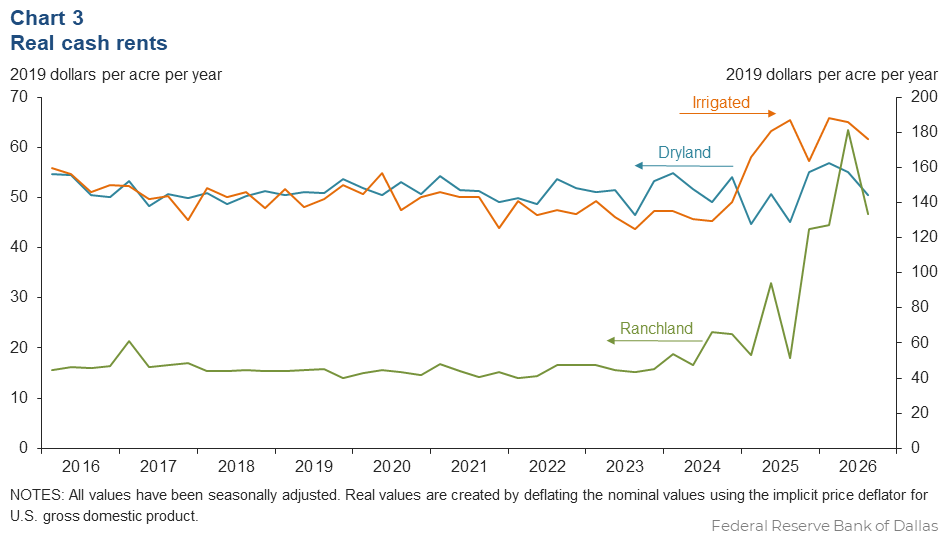
Real land values for dryland, irrigated land and ranchland declined in the third quarter (Chart 2). However, values in the District are still up year over year for dryland and ranchland while down for irrigated land (Table 1). Real cash rents pulled back for dryland, irrigated land and ranchland in this quarter (Chart 3).
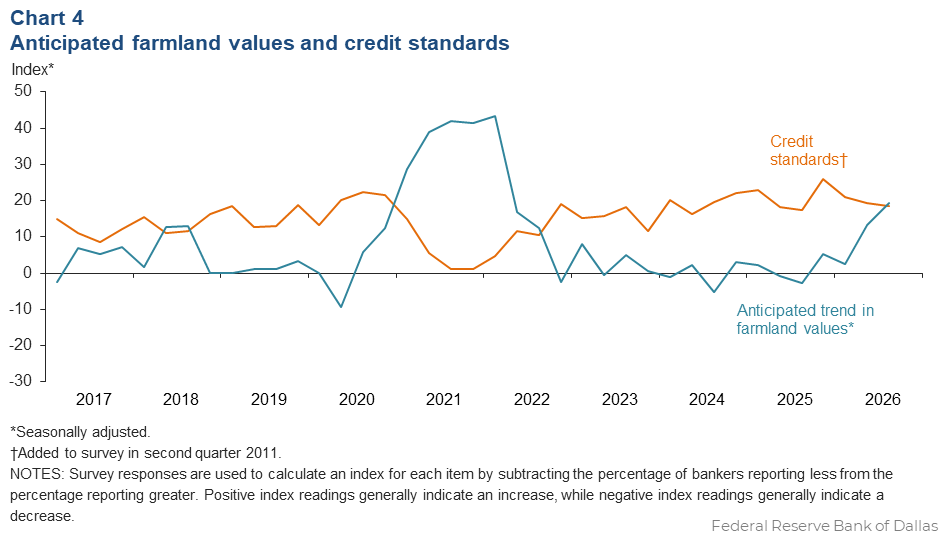
The anticipated trend in farmland values index jumped again in the third quarter. This implies respondents expect farmland values to rise. The credit standards index showed an increase in credit tightening (Chart 4), and interest rates ticked up for all types in the current quarter (Table 2).
Next release: December 21, 2026
Agricultural Survey is compiled from a survey of Eleventh District agricultural bankers, and data have been seasonally adjusted as necessary. Data were collected September 1–9, and 50 bankers responded to the survey.
Tables
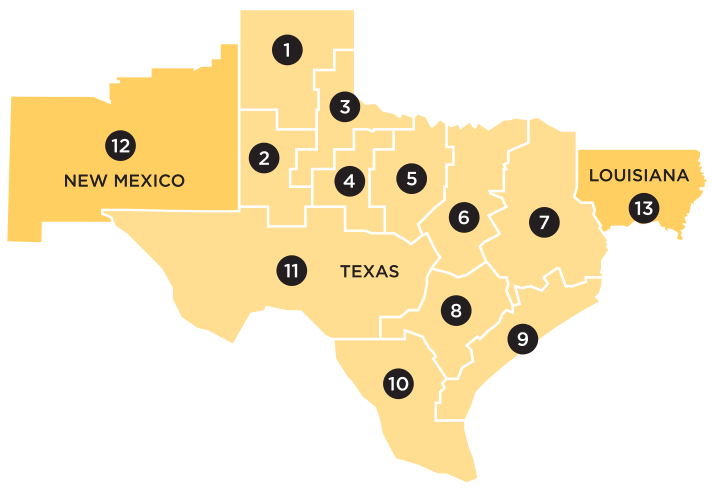
Rural real estate values—third quarter 2026
| Banks1 | Average value2 | Percent change in value from previous year3 | ||
Cropland–Dryland | ||||
| District* | 36 | 3,393 | 7.9 |
| Texas* | 32 | 3,455 | 8.2 |
1 | Northern High Plains | 6 | 1,225 | –1.6 |
2 | Southern High Plains | 4 | 1,438 | 15.4 |
3 | Northern Low Plains* | n.a. | n.a. | n.a. |
4 | Southern Low Plains* | 3 | 2,279 | 12.5 |
5 | Cross Timbers | n.a. | n.a. | n.a. |
6 | North Central Texas | 3 | 8,000 | 15.7 |
7 | East Texas* | n.a. | n.a. | n.a. |
8 | Central Texas | 5 | 7,000 | 19.2 |
9 | Coastal Texas | n.a. | n.a. | n.a. |
10 | South Texas | 3 | 3,133 | 0.0 |
11 | Trans–Pecos and Edwards Plateau | n.a. | n.a. | n.a. |
12 | Southern New Mexico | 3 | 667 | 14.4 |
13 | Northern Louisiana | n.a. | n.a. | n.a. |
Cropland–Irrigated | ||||
| District* | 31 | 4,144 | –2.2 |
| Texas* | 27 | 3,269 | –3.5 |
1 | Northern High Plains | 6 | 2,933 | –12.1 |
2 | Southern High Plains | 4 | 2,563 | 0.0 |
3 | Northern Low Plains* | n.a. | n.a. | n.a. |
4 | Southern Low Plains | 3 | 2,750 | 7.1 |
5 | Cross Timbers | n.a. | n.a. | n.a. |
6 | North Central Texas | n.a. | n.a. | n.a. |
7 | East Texas | n.a. | n.a. | n.a. |
8 | Central Texas | 3 | 6,250 | 1.9 |
9 | Coastal Texas | n.a. | n.a. | n.a. |
10 | South Texas | 3 | 4,500 | 0.0 |
11 | Trans–Pecos and Edwards Plateau | n.a. | n.a. | n.a. |
12 | Southern New Mexico | 3 | 10,000 | 0.0 |
13 | Northern Louisiana | n.a. | n.a. | n.a. |
Ranchland | ||||
| District* | 42 | 3,723 | 11.1 |
| Texas* | 38 | 4,446 | 11.1 |
1 | Northern High Plains | 6 | 1,100 | –16.5 |
2 | Southern High Plains | 4 | 1,350 | 22.2 |
3 | Northern Low Plains | n.a. | n.a. | n.a. |
4 | Southern Low Plains* | 3 | 2,589 | –8.5 |
5 | Cross Timbers | n.a. | n.a. | n.a. |
6 | North Central Texas | 3 | 8,167 | 10.1 |
7 | East Texas | 4 | 5,125 | 40.9 |
8 | Central Texas | 6 | 11,333 | 16.3 |
9 | Coastal Texas | n.a. | n.a. | n.a. |
10 | South Texas | 4 | 3,700 | 0.0 |
11 | Trans–Pecos and Edwards Plateau | 3 | 4,883 | 19.6 |
12 | Southern New Mexico | 3 | 583 | 9.4 |
13 | Northern Louisiana | n.a. | n.a. | n.a. |
| *Seasonally adjusted. 1 Number of banks reporting land values. 2 Prices are dollars per acre, not adjusted for inflation. 3 Not adjusted for inflation and calculated using responses only from those banks reporting in both the past and current quarter. n.a.—Not published due to insufficient responses but included in totals for Texas and district. |
||||
Interest rates by loan type—third quarter 2026
| Feeder cattle | Other farm operating | Intermediate term | Long-term farm real estate | Fixed (average rate, percent) |
2025:Q3 | 8.35 | 8.30 | 8.11 | 7.84 |
2025:Q4 | 8.06 | 8.06 | 7.87 | 7.38 |
2026:Q1 | 7.76 | 7.83 | 7.62 | 7.34 |
2026:Q2 | 7.78 | 7.78 | 7.66 | 7.41 |
2026:Q3 | 7.96 | 8.05 | 7.81 | 7.46 | Variable (average rate, percent) |
2025:Q3 | 8.45 | 8.38 | 8.09 | 7.76 |
2025:Q4 | 8.07 | 8.12 | 7.92 | 7.54 |
2026:Q1 | 7.85 | 7.89 | 7.76 | 7.42 |
2026:Q2 | 7.84 | 7.90 | 7.67 | 7.43 |
2026:Q3 | 8.03 | 8.12 | 7.93 | 7.54 |
Charts
Farm lending trends
What changes occurred in non-real-estate farm loans at your bank in the past three months compared with a year earlier?
| Index | Percent reporting, Q3 | ||||
| 2026:Q2 | 2026:Q3 | Greater | Same | Less | |
Demand for loans* | –13.5 | –25.4 | 2.9 | 68.8 | 28.3 |
Availability of funds* | 6.9 | 4.2 | 6.7 | 90.8 | 2.5 |
Rate of loan repayment | –3.9 | –4.2 | 0.0 | 95.8 | 4.2 |
Loan renewals or extensions | 3.9 | –4.2 | 2.1 | 91.7 | 6.3 |
| *Seasonally adjusted. | |||||

What changes occurred in the volume of farm loans made by your bank in the past three months compared with a year earlier?
| Index | Percent reporting, Q3 | ||||
| 2026:Q2 | 2026:Q3 | Greater | Same | Less | |
Non–real–estate farm loans | –23.1 | –14.9 | 8.5 | 68.1 | 23.4 |
Feeder cattle loans* | –10.6 | –20.1 | 6.0 | 67.9 | 26.1 |
Dairy loans* | –11.0 | –4.0 | 0.1 | 95.8 | 4.1 |
Crop storage loans* | –12.5 | –11.5 | 0.4 | 87.7 | 11.9 |
Operating loans | –5.9 | –10.4 | 12.5 | 64.6 | 22.9 |
Farm machinery loans* | –25.7 | –25.6 | 4.5 | 65.4 | 30.1 |
Farm real estate loans* | –10.8 | –8.4 | 8.3 | 75.0 | 16.7 |
| *Seasonally adjusted. NOTES: Survey responses are used to calculate an index for each item by subtracting the percentage of bankers reporting less from the percentage reporting greater. Positive index readings generally indicate an increase, while negative index readings generally indicate a decrease. |
|||||
Real land values

Real cash rents

Anticipated farmland values and credit standards
What trend in farmland values do you expect in your area in the next three months?
| Index | Percent reporting, Q3 | ||||
| 2026:Q2 | 2026:Q3 | Up | Same | Down | |
| Anticipated trend in farmland values* | 13.2 | 19.4 | 26.2 | 67.0 | 6.8 |
| *Seasonally adjusted. | |||||
What change occurred in credit standards for agricultural loans at your bank in the past three months compared with a year earlier?
| 2026:Q2 | 2026:Q3 | Up | Same | Down | |
| Credit standards | 19.2 | 18.4 | 18.4 | 81.6 | 0.0 |

Quarterly comments
District bankers were asked for additional comments concerning agricultural land values and credit conditions. Some comments have been edited for grammar and clarity.
- Drought conditions will cause a reduction of wheat pasture cattle loans. Also, [we are] seeing a culling of cow herds due to dry conditions. Silage yields are down also.
- Input costs remain high. December and March futures show large upside with potential prices above $0.90 on cotton. Due to changes in government programs, [we are] very hopeful that projected government payments will remain in place. Without this payment, it will be hard for producers to pay out. Drought conditions continue affecting crops daily. At present, most, if not all, dry-land crops have been abandoned and reported to insurance, and irrigated crops are all marginal. Future data center [construction] will greatly affect farmland prices in the West Texas area.
- Extreme drought and excessive heat have greatly hampered all crops and livestock production.
- Our lending area is facing a challenging year as persistent drought and high temperatures continue to place significant pressure on wheat, hay and grazing conditions, while input costs remain elevated and commodity prices remain generally weak. Although cattle prices remain historically strong, they have declined from their recent highs, while drought and limited forage are making it increasingly expensive and difficult for producers to maintain their herds. Many stock ponds are now dry or nearly dry, forcing producers to make difficult decisions about their operations, and we are seeing some producers reduce their herds substantially or, in some cases, exit the cattle business altogether.
- The weather pattern throughout much of the current cotton crops growing season has been extremely hot and dry. The majority of the cotton crop will be taken out by the federal crop insurance. The uncertainty of future government payments and crop income have caused most of our customers to pull back on buying additional equipment and any other purchases outside of the necessary operating expenses.
- Overall demand for ag real estate loans has remained steady to decreasing as higher interest rates deter investment. Ag real estate for sale has increased inventory and been on the market longer, with the exception of good pasture land. Increased commodity prices for row crop are anticipated to increase farm incomes into the last quarter of the year. Cattle prices have remained strong, although they are off from highs set in the second quarter. Replacement female demand is strong. Overall credit conditions are stable, but we are monitoring borrowers more closely and remain cautious in underwriting. A persistent drought during the summer growing season may result in lower-than-expected yields for row crops, and pasture conditions have deteriorated. Hay demand may see a sizable increase going into fall.
- Same comment as always: Agriculture land is being commercially developed as fast as it possibly can be. Soon there will be no agriculture land left 75–100 miles from Houston.
- Grain sorghum and corn harvest are mostly complete. Yields were light, as was the bushel weight. Sesame and sunflowers along with cotton are wrapping up. Both sesame and sunflowers yield and quality did better than expected but still below average. Cotton crops are good, especially the irrigated cotton. Improved commodity prices late in season are helping a little. Hot and dry weather is taking its toll on the range and pastureland. It is also impacting vegetables and citrus as water reliability is still a challenge for producers despite improved reservoir conditions. Vegetable planting is in full swing. Citrus harvest is right around the corner, and the fruit set for this season looks promising, maybe 15 to 20 percent more than last year.
- Ag is slowing down with significant acreage being converted to data [centers] and alternative energy sources.
- Drought continues to worsen across the southern plains and desert. High mountain areas are getting good moisture, but very isolated. Cattle prices continue to hold but have slipped some over the summer. Drought is causing area farmers to hold on hay prices and even increase in some cases. We expect to see continued slight decline in cattle prices through the fall shipping period, but drought may force the sale of heifers and deeper cull rates on base heard. With drought so widespread, there are some that think cattle prices could strengthen further if slaughter rates on heifers go back up.
Historical data
Historical data can be downloaded dating back to first quarter 2000.
For More Information
Questions regarding the Agricultural Survey can be addressed to Mariam Yousuf at Mariam.Yousuf@dal.frb.org.