Banking Conditions Survey

June 2020
June 2020
What’s New
For this survey, respondents were asked supplemental questions on the impacts of the coronavirus (COVID-19). Read the special questions results.
Many financial institutions are participating in the Small Business Administration’s Paycheck Protection Program (PPP), launched on April 3, 2020. For this survey, respondents were asked to answer the questions excluding PPP loans.
Results Tables
Historical data are available from March 2017.
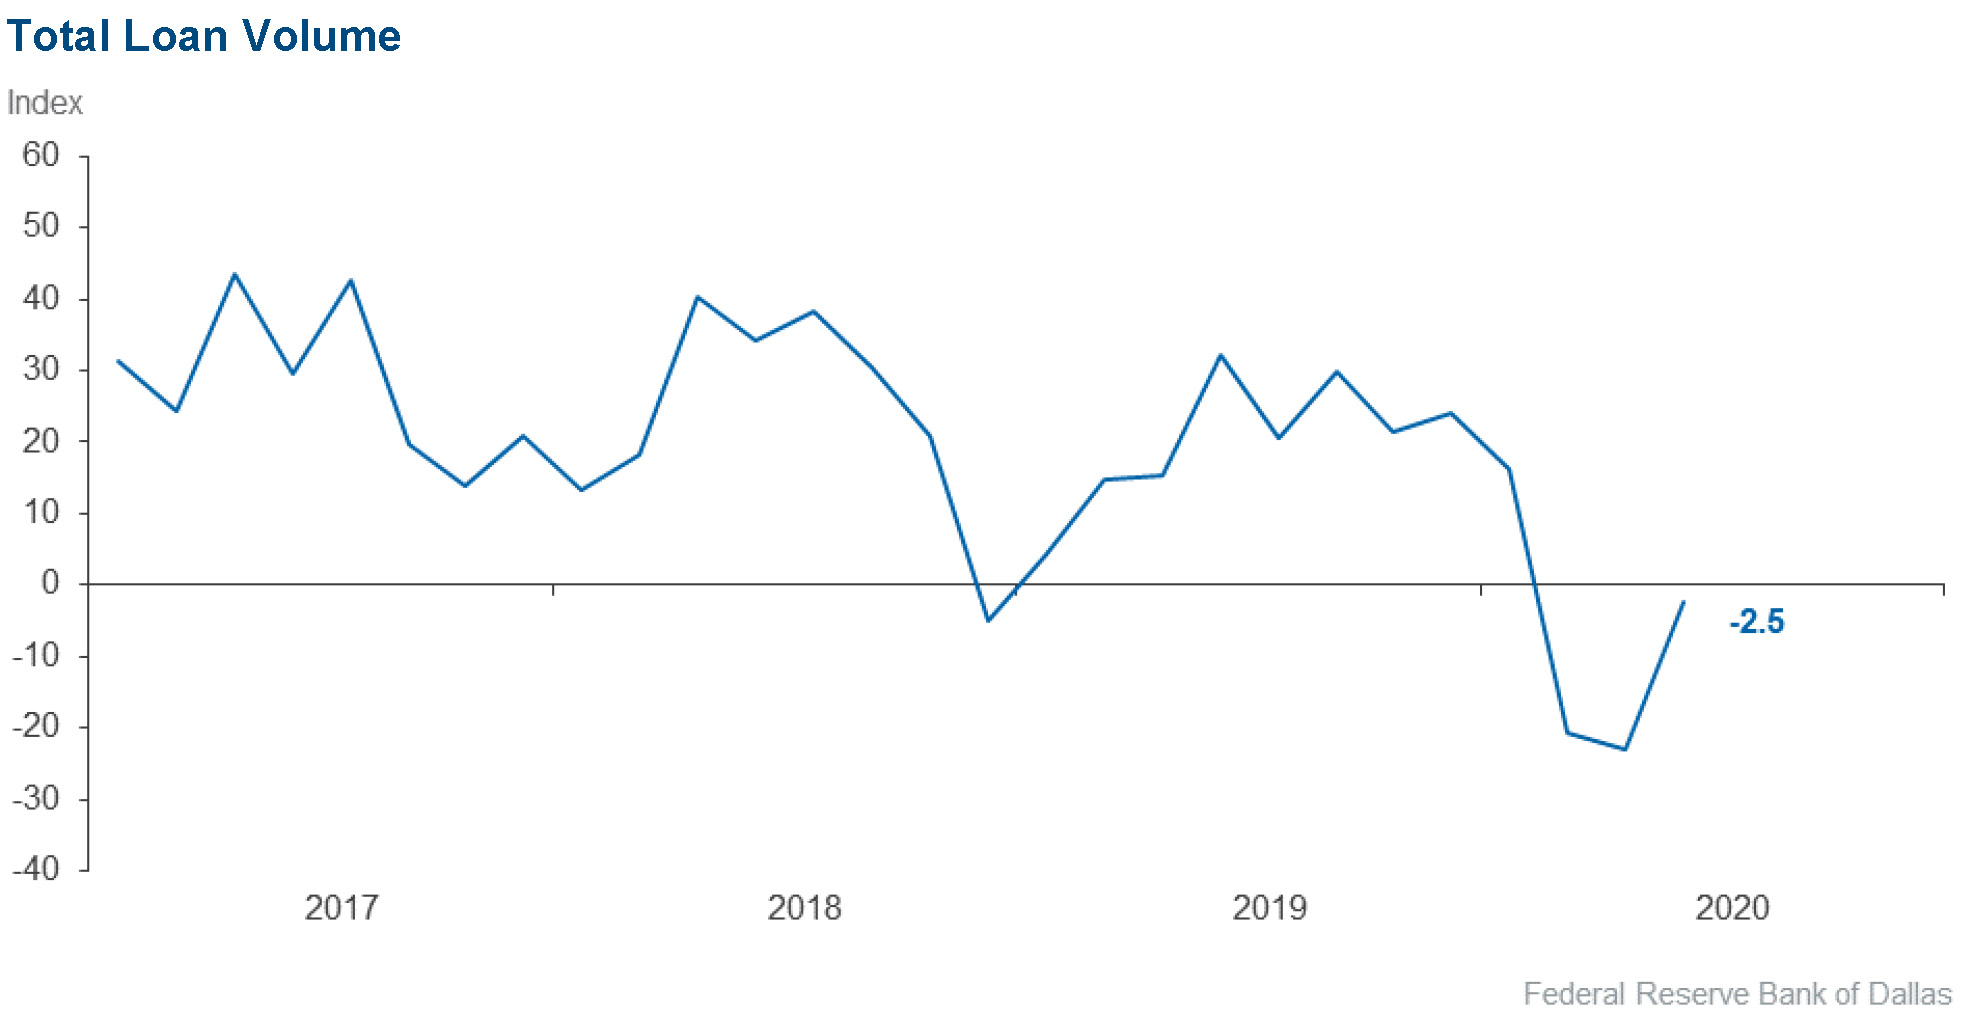
| Total Loans: Over the past six weeks, how have the following changed? | |||||
| Indicator | Current Index | Previous Index | % Reporting Increase | % Reporting No Change | % Reporting Decrease |
Loan volume | –2.5 | –22.9 | 38.0 | 21.5 | 40.5 |
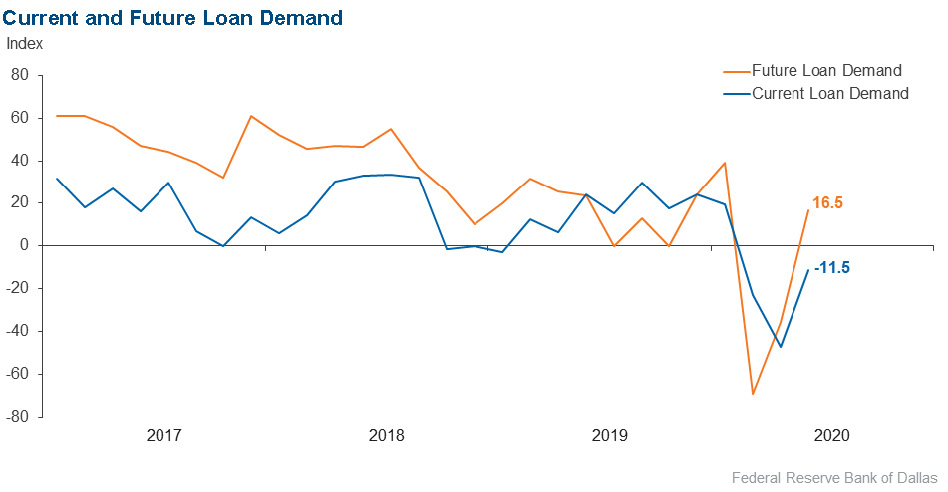
Loan demand | –11.5 | –47.2 | 32.1 | 24.4 | 43.6 |
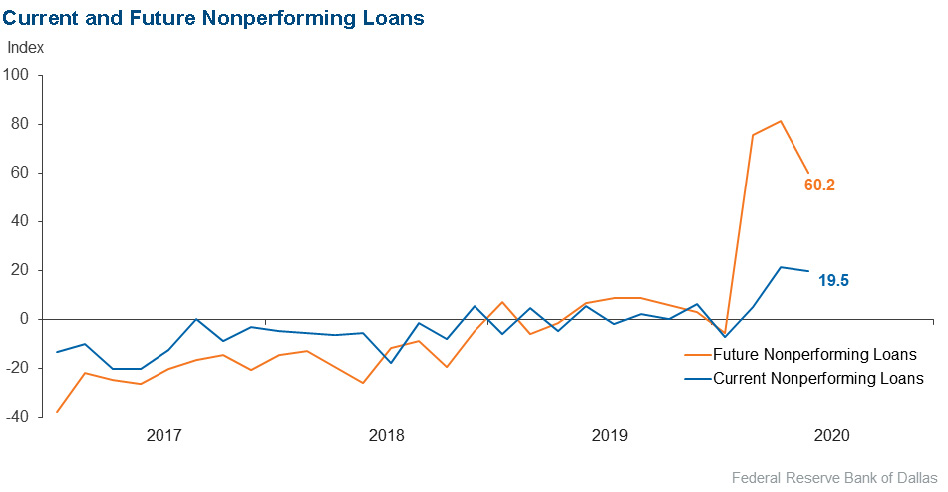
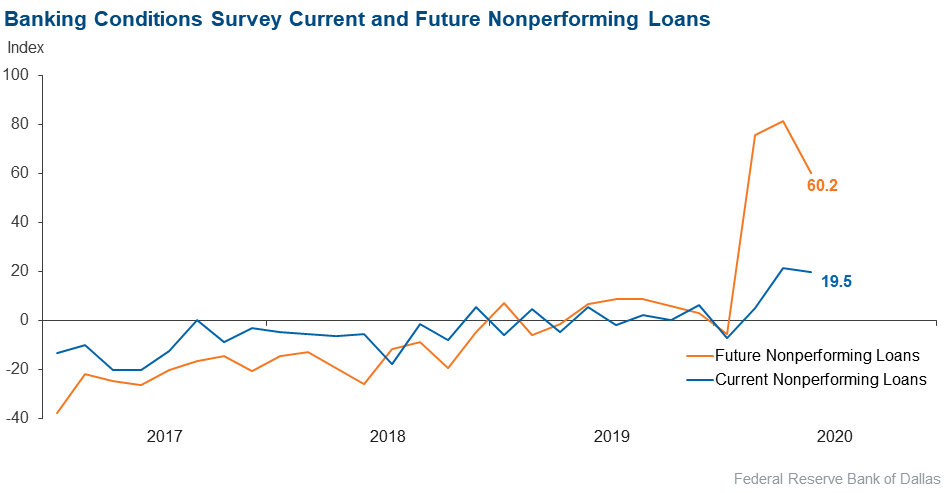
Nonperforming loans | 19.5 | 21.4 | 27.3 | 64.9 | 7.8 |
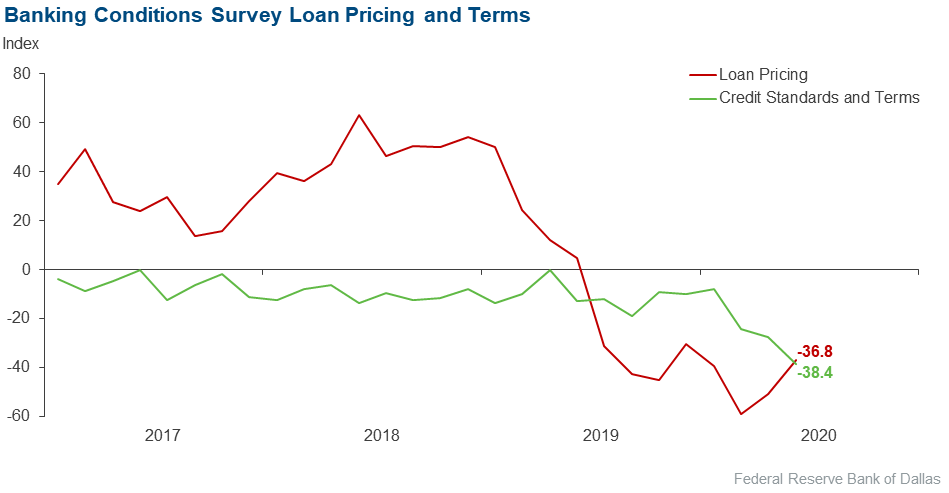
Loan pricing | –36.8 | –50.8 | 5.3 | 52.6 | 42.1 |
| Indicator | Current Index | Previous Index | % Reporting Eased | % Reporting No Change | % Reporting Tightened |
Credit standards and terms | –38.4 | –27.6 | 2.6 | 56.4 | 41.0 |
| Commercial and Industrial Loans: Over the past six weeks, how have the following changed? | |||||
| Indicator | Current Index | Previous Index | % Reporting Increase | % Reporting No Change | % Reporting Decrease |
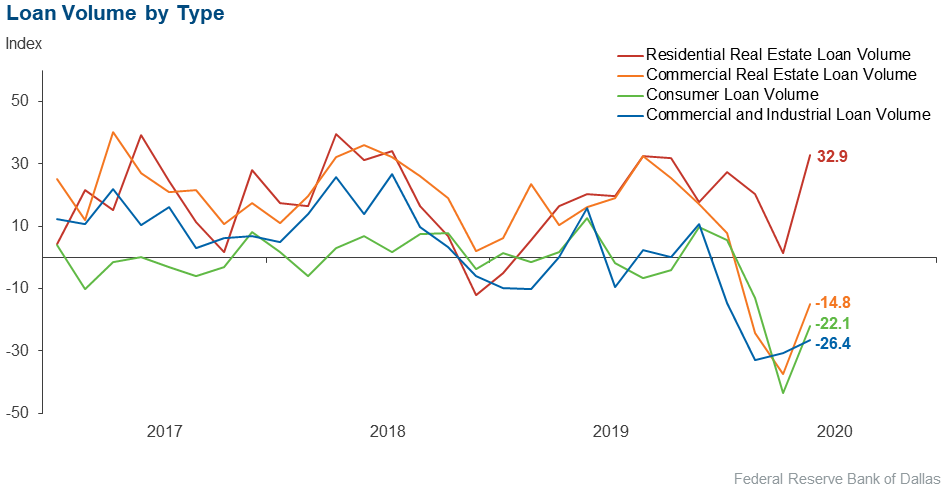
Loan volume | –26.4 | –30.7 | 12.5 | 48.6 | 38.9 |
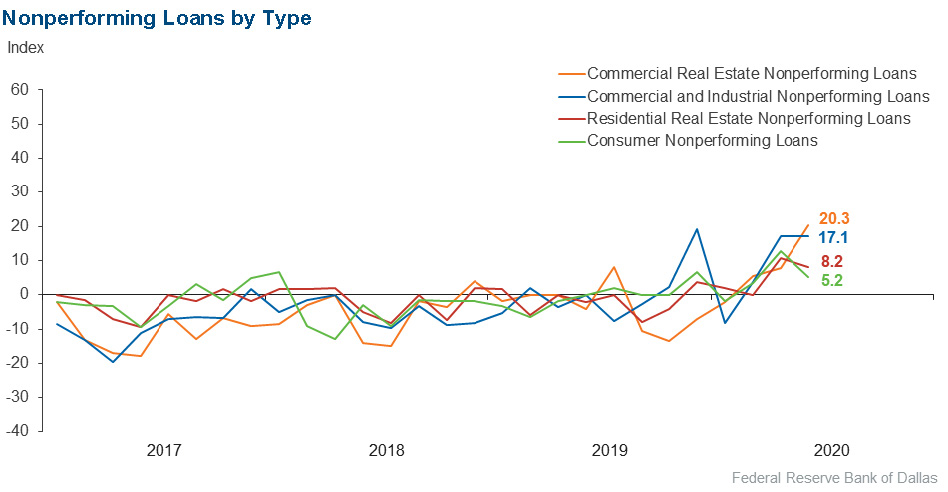
Nonperforming loans | 17.1 | 17.2 | 20.0 | 77.1 | 2.9 |
| Indicator | Current Index | Previous Index | % Reporting Eased | % Reporting No Change | % Reporting Tightened |
Credit standards and terms | –42.6 | –33.3 | 0.0 | 57.4 | 42.6 |
| Commercial Real Estate Loans: Over the past six weeks, how have the following changed? | |||||
| Indicator | Current Index | Previous Index | % Reporting Increase | % Reporting No Change | % Reporting Decrease |
Loan volume | –14.8 | –37.3 | 25.7 | 33.8 | 40.5 |
Nonperforming loans | 20.3 | 7.7 | 23.0 | 74.3 | 2.7 |
| Indicator | Current Index | Previous Index | % Reporting Eased | % Reporting No Change | % Reporting Tightened |
Credit standards and terms | –40.3 | –24.3 | 0.0 | 59.7 | 40.3 |
| Residential Real Estate Loans: Over the past six weeks, how have the following changed? | |||||
| Indicator | Current Index | Previous Index | % Reporting Increase | % Reporting No Change | % Reporting Decrease |
Loan volume | 32.9 | 1.5 | 46.6 | 39.7 | 13.7 |
Nonperforming loans | 8.2 | 10.6 | 9.6 | 89.0 | 1.4 |
| Indicator | Current Index | Previous Index | % Reporting Eased | % Reporting No Change | % Reporting Tightened |
Credit standards and terms | –14.1 | –13.8 | 1.4 | 83.1 | 15.5 |
| Consumer Loans: Over the past six weeks, how have the following changed? | |||||
| Indicator | Current Index | Previous Index | % Reporting Increase | % Reporting No Change | % Reporting Decrease |
Loan volume | –22.1 | –43.5 | 11.7 | 54.5 | 33.8 |
Nonperforming loans | 5.2 | 12.8 | 10.4 | 84.4 | 5.2 |
| Indicator | Current Index | Previous Index | % Reporting Eased | % Reporting No Change | % Reporting Tightened |
Credit standards and terms | –12.0 | –4.3 | 1.3 | 85.3 | 13.3 |
| Banking Outlook: What is your expectation for the following items six months from now? | |||||
| Indicator | Current Index | Previous Index | % Reporting Increase | % Reporting No Change | % Reporting Decrease |
Total loan demand | 16.5 | –35.7 | 45.6 | 25.3 | 29.1 |
Nonperforming loans | 60.2 | 81.5 | 62.8 | 34.6 | 2.6 |
| General Business Activity: What is your evaluation of the level of activity? | |||||
| Indicator | Current Index | Previous Index | % Reporting Better | % Reporting No Change | % Reporting Worse |
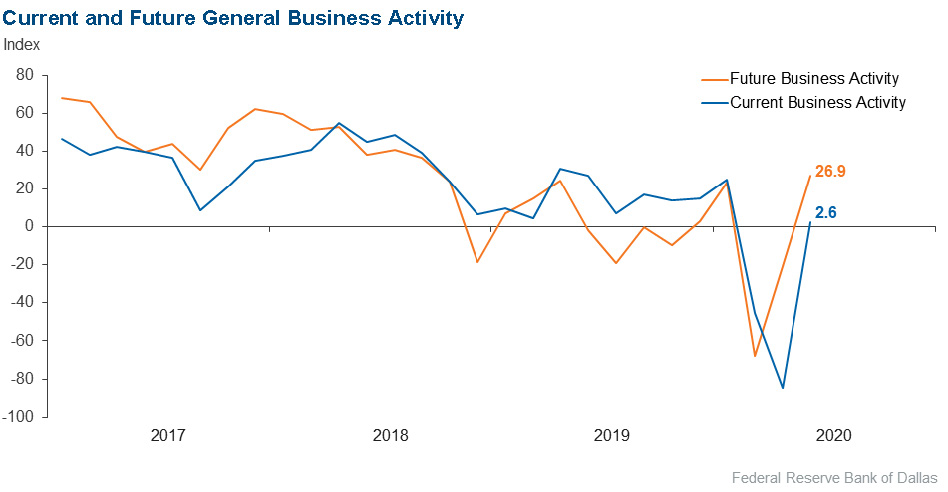
Over the past six weeks | 2.6 | –84.7 | 43.6 | 15.4 | 41.0 |
Six months from now | 26.9 | –20.9 | 55.1 | 16.7 | 28.2 |
Next release: August 17
|
Data were collected June 16–24, and 79 financial institutions responded to the survey. The Federal Reserve Bank of Dallas conducts the Banking Conditions Survey twice each quarter to obtain a timely assessment of activity at banks and credit unions headquartered in the Eleventh Federal Reserve District. CEOs or senior loan officers of financial institutions report on how conditions have changed for indicators such as loan volume, nonperforming loans and loan pricing. Respondents are also asked to report on their banking outlook and their evaluation of general business activity. Survey responses are used to calculate an index for each indicator. Each index is calculated by subtracting the percentage of respondents reporting a decrease (or tightening) from the percentage reporting an increase (or easing). When the share of respondents reporting an increase exceeds the share reporting a decrease, the index will be greater than zero, suggesting the indicator has increased over the prior reporting period. If the share of respondents reporting a decrease exceeds the share reporting an increase, the index will be below zero, suggesting the indicator has decreased over the prior reporting period. An index will be zero when the number of respondents reporting an increase is equal to the number reporting a decrease. |
June 2020

June 2020
Respondents were given an opportunity to comment on any issues that may be affecting their business.
These comments are from respondents’ completed surveys and have been edited for publication.
Economic Disruption
- Although the indirect business channel has slightly improved, consumer buying behavior is very sporadic.
- Unprecedented increases in ad valorem taxes on agricultural value ranchland are negatively affecting ranching along with drought. Tourism being down is affecting local merchants negatively. Retail seems to be picking up a bit the last two weeks.
- It is good to see some stabilization in markets. There is some concern from businesses in our area about opening back up. Also, some of our larger clients are worried about a second wave of COVID showing up in the fall and winter and do not know if they could make it through another economic shutdown.
- Government programs have helped the overall economic situation to date. We will need to see what the next six weeks bring.
- It’s far too early to estimate the COVID impact overall, but we anticipate that commercial issues will begin to materialize within a couple of months.
- The number of new COVID-19 cases in Texas is rising, which could depress the banking outlook and business activities.
Lending and Banking
- There is extreme pressure amongst lenders to capture a reasonable amount of market share without accepting layers of risk that could be detrimental to future portfolio performance.
- General loan demand is slightly up.
- The bank has approved a significant amount of loan deferrals/modifications as a result of COVID-19, which has kept loans current at the moment. However, if businesses are not allowed to open/rehire and are further restricted in the coming months, it could have a detrimental effect. Also, the uncertainty and changes related to PPP [Paycheck Protection Program] causes us concern as the program continually changes in ways that are not beneficial to financial institutions.
- PPP is taking a tremendous amount of time. I am also very concerned about margin compression.
- It’s surprising to me how our deposits have maintained a somewhat consistent level after funding PPP loans. It could be the stimulus checks deposited into our accounts. We expected those to slowly diminish, but they have not.
- Uncertainty continues to be an issue for stable banking.
- Uncertainty with respect to when suitable mitigation of COVID-19 (i.e., vaccine, treatments) exists is driving challenges with respect to pricing and forecasting. Real estate demand is largely driven by refinancing. Consumer lending is volatile. Share inflows continue to pressure capital metrics until funds can be appropriately deployed.
- I am curious to see how many loans that received COVID-19 payment deferrals will end up in nonperforming loan status. The results will determine whether or not I can reverse the large portion of bad debt expense I set aside for these loans or if I need to increase that amount because my initial estimates were too low.
- Demand for quality agriculture loans has increased slightly.
- A large bank branch closing and another reportedly not approving commercial loans have spurred marginal increase in demand.
- We are seeing some increase in consumer loan demand, but commercial activity seems to be lagging due to the uncertainty of what will happen after all the government stimulus is no longer in play.
- Loan volume is down 12 percent in the last six weeks and 20 percent in the last six months. Noninterest income is down 15 percent in the last six weeks and 21 percent in the last six months. Deposits are up 11 percent in the last six weeks and 13 percent in the last six months.
- We are starting to get notices that some of our clients are filing for bankruptcy, so I expect the level of bankruptcies to go up quite a bit, especially in September, after loan extensions granted to many of our members expire.
Historical Data
Historical data can be downloaded dating back to March 2017. For the definitions, see data definitions.
NOTE: The following series were discontinued in May 2020: volume of core deposits, cost of funds, non-interest income and net interest margin.
Questions regarding the Banking Conditions Survey can be addressed to Emily Kerr at emily.kerr@dal.frb.org.
Sign up for our email alert to be automatically notified as soon as the latest Banking Conditions Survey is released on the web.