Banking Conditions Survey

November 2020
November 2020
Results Tables
Historical data are available from March 2017.
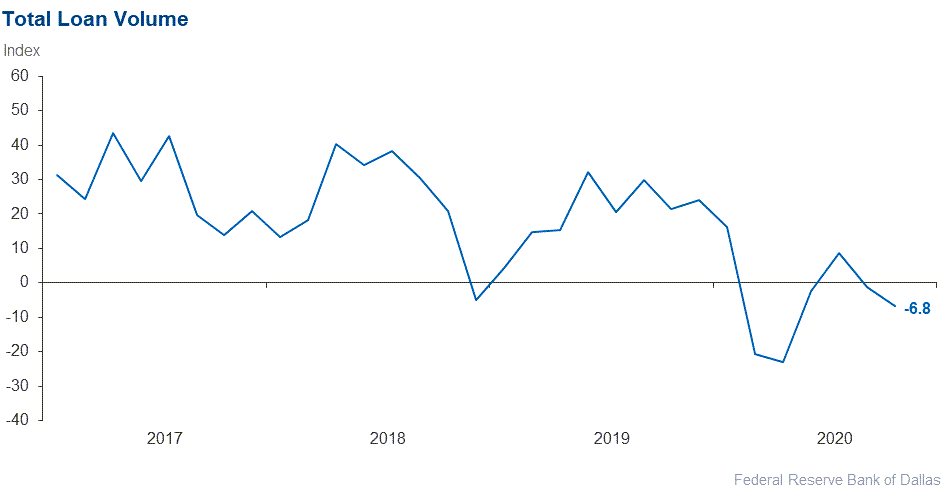
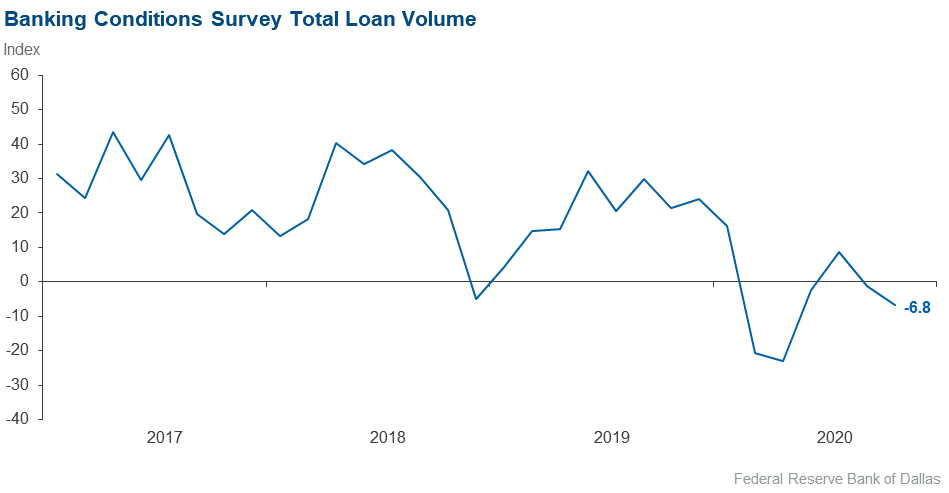
| Total Loans: Over the past six weeks, how have the following changed? | |||||
| Indicator | Current Index | Previous Index | % Reporting Increase | % Reporting No Change | % Reporting Decrease |
Loan volume | –6.8 | –1.2 | 32.9 | 27.4 | 39.7 |
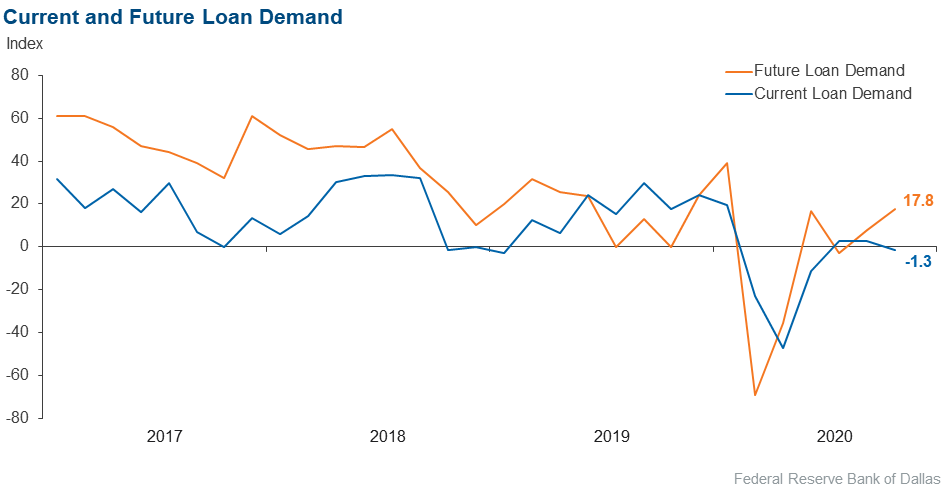
Loan demand | –1.3 | 2.5 | 32.9 | 32.9 | 34.2 |
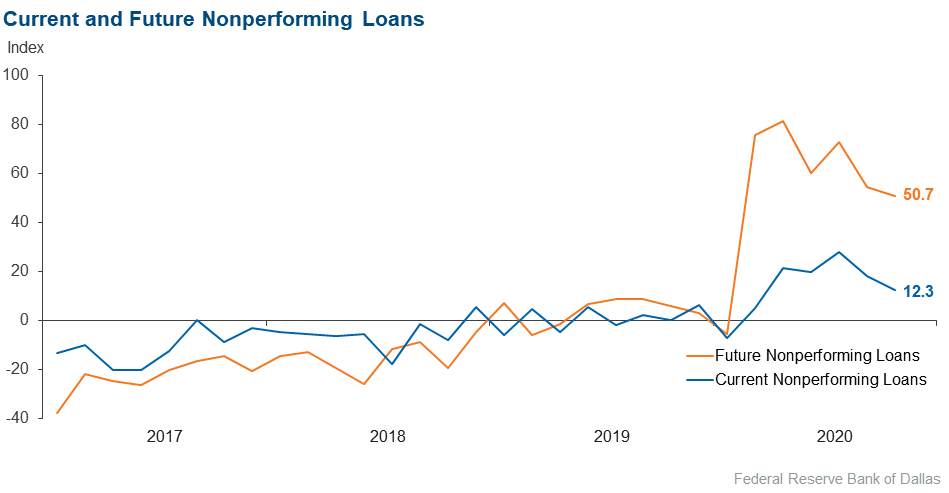
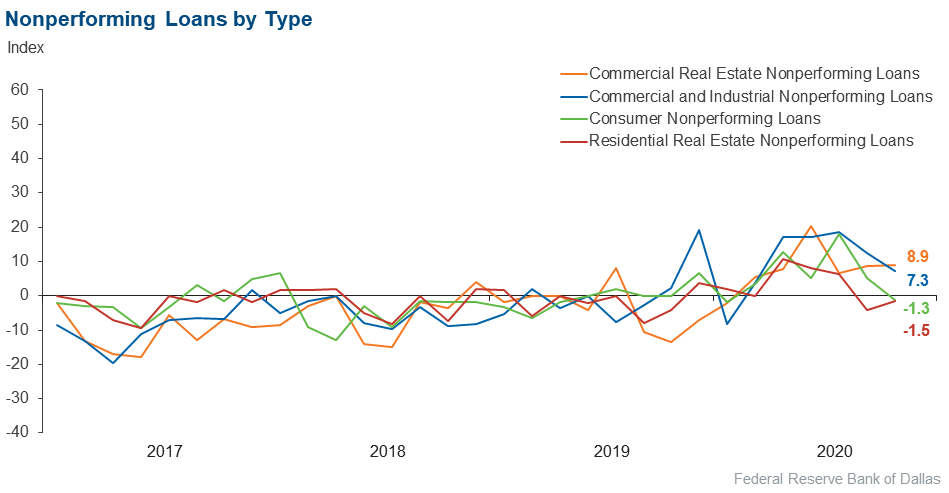
Nonperforming loans | 12.3 | 17.9 | 23.3 | 65.8 | 11.0 |
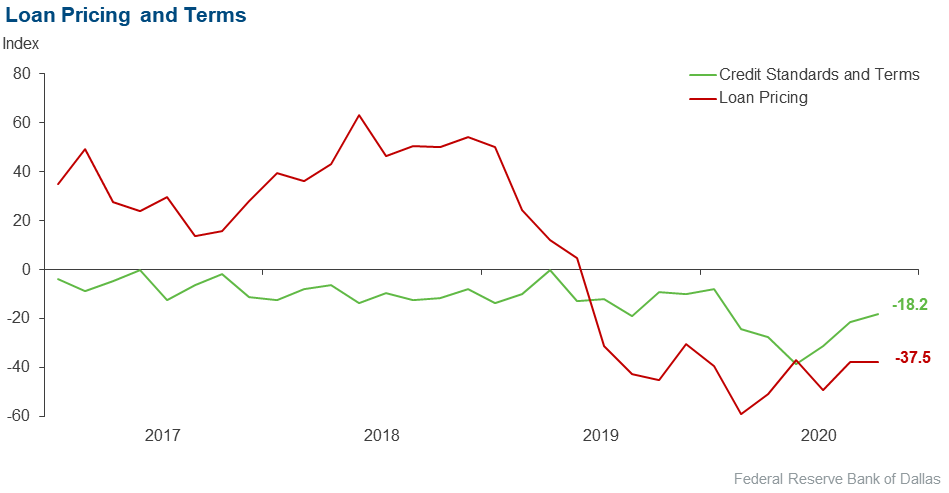
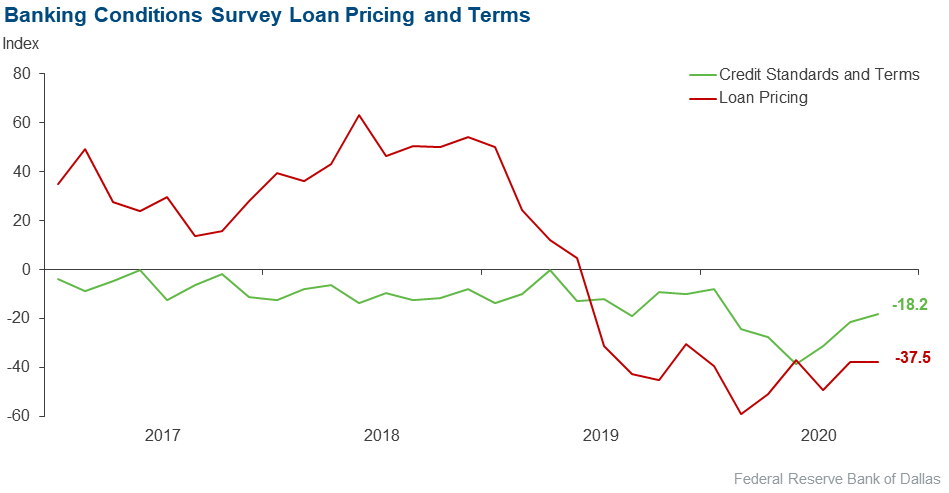
Loan pricing | –37.5 | –37.7 | 4.2 | 54.2 | 41.7 |
| Indicator | Current Index | Previous Index | % Reporting Eased | % Reporting No Change | % Reporting Tightened |
Credit standards and terms | –18.2 | –21.4 | 3.0 | 75.8 | 21.2 |
| Commercial and Industrial Loans: Over the past six weeks, how have the following changed? | |||||
| Indicator | Current Index | Previous Index | % Reporting Increase | % Reporting No Change | % Reporting Decrease |
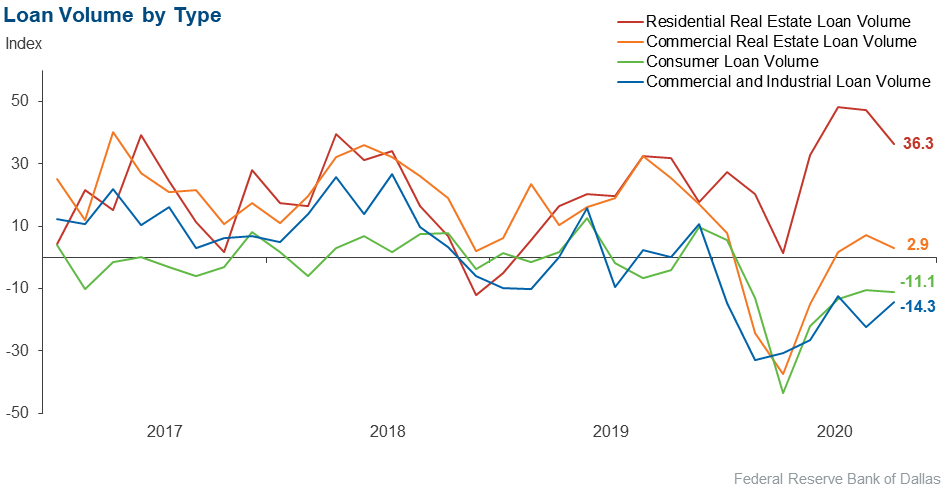
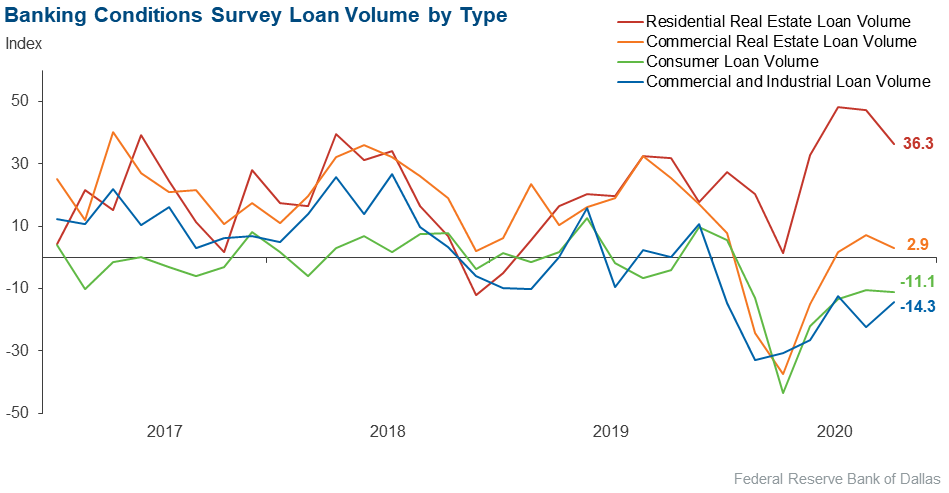
Loan volume | –14.3 | –22.2 | 11.4 | 62.9 | 25.7 |
Nonperforming loans | 7.3 | 12.5 | 11.6 | 84.1 | 4.3 |
| Indicator | Current Index | Previous Index | % Reporting Eased | % Reporting No Change | % Reporting Tightened |
Credit standards and terms | –15.9 | –22.5 | 0.0 | 84.1 | 15.9 |
| Commercial Real Estate Loans: Over the past six weeks, how have the following changed? | |||||
| Indicator | Current Index | Previous Index | % Reporting Increase | % Reporting No Change | % Reporting Decrease |
Loan volume | 2.9 | 7.1 | 31.3 | 40.3 | 28.4 |
Nonperforming loans | 8.9 | 8.6 | 13.4 | 82.1 | 4.5 |
| Indicator | Current Index | Previous Index | % Reporting Eased | % Reporting No Change | % Reporting Tightened |
Credit standards and terms | –13.4 | –23.9 | 4.5 | 77.6 | 17.9 |
| Residential Real Estate Loans: Over the past six weeks, how have the following changed? | |||||
| Indicator | Current Index | Previous Index | % Reporting Increase | % Reporting No Change | % Reporting Decrease |
Loan volume | 36.3 | 47.2 | 49.3 | 37.7 | 13.0 |
Nonperforming loans | –1.5 | –4.1 | 1.4 | 95.7 | 2.9 |
| Indicator | Current Index | Previous Index | % Reporting Eased | % Reporting No Change | % Reporting Tightened |
Credit standards and terms | –5.8 | –9.7 | 0.0 | 94.2 | 5.8 |
| Consumer Loans: Over the past six weeks, how have the following changed? | |||||
| Indicator | Current Index | Previous Index | % Reporting Increase | % Reporting No Change | % Reporting Decrease |
Loan volume | –11.1 | –10.3 | 16.7 | 55.6 | 27.8 |
Nonperforming loans | –1.3 | 5.1 | 5.6 | 87.5 | 6.9 |
| Indicator | Current Index | Previous Index | % Reporting Eased | % Reporting No Change | % Reporting Tightened |
Credit standards and terms | –2.8 | –9.1 | 2.9 | 91.4 | 5.7 |
| Banking Outlook: What is your expectation for the following items six months from now? | |||||
| Indicator | Current Index | Previous Index | % Reporting Increase | % Reporting No Change | % Reporting Decrease |
Total loan demand | 17.8 | 7.7 | 41.1 | 35.6 | 23.3 |
Nonperforming loans | 50.7 | 54.5 | 54.8 | 41.1 | 4.1 |
| General Business Activity: What is your evaluation of the level of activity? | |||||
| Indicator | Current Index | Previous Index | % Reporting Better | % Reporting No Change | % Reporting Worse |
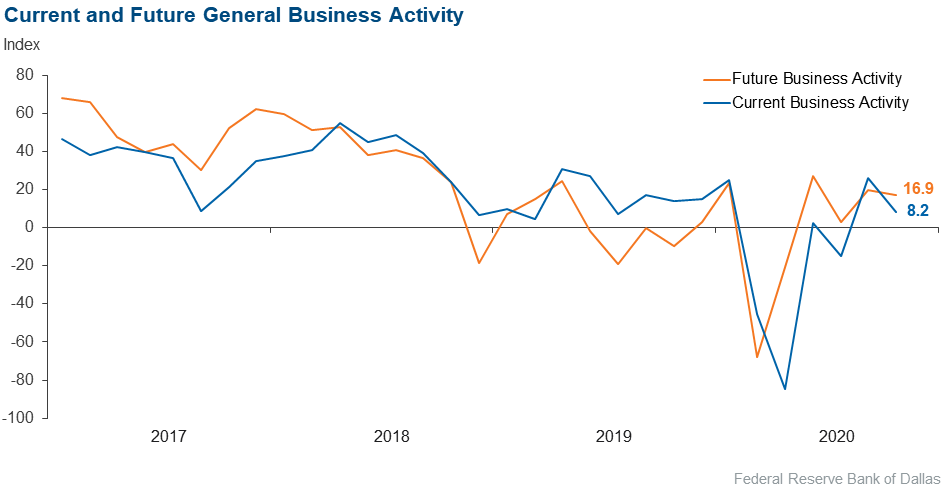
Over the past six weeks | 8.2 | 26.3 | 32.9 | 42.5 | 24.7 |
Six months from now | 16.9 | 20.0 | 42.3 | 32.4 | 25.4 |
Next release: December 28
|
Data were collected November 3–10, and 73 financial institutions responded to the survey. The Federal Reserve Bank of Dallas conducts the Banking Conditions Survey twice each quarter to obtain a timely assessment of activity at banks and credit unions headquartered in the Eleventh Federal Reserve District. CEOs or senior loan officers of financial institutions report on how conditions have changed for indicators such as loan volume, nonperforming loans and loan pricing. Respondents are also asked to report on their banking outlook and their evaluation of general business activity. Survey responses are used to calculate an index for each indicator. Each index is calculated by subtracting the percentage of respondents reporting a decrease (or tightening) from the percentage reporting an increase (or easing). When the share of respondents reporting an increase exceeds the share reporting a decrease, the index will be greater than zero, suggesting the indicator has increased over the prior reporting period. If the share of respondents reporting a decrease exceeds the share reporting an increase, the index will be below zero, suggesting the indicator has decreased over the prior reporting period. An index will be zero when the number of respondents reporting an increase is equal to the number reporting a decrease. |
November 2020
November 2020
Respondents were given an opportunity to comment on any issues that may be affecting their business.
These comments are from respondents’ completed surveys and have been edited for publication.
- There are macroeconomic and political risks.
- Commercial and industrial line-of-credit usage is down, well below long-term historical averages. This has been offset by continued borrowing in the commercial real estate portfolio as construction loans fund to complete projects.
- We feel the government stimulus has created excess liquidity and thereby an extended lag in loan production because companies can use their own sources—private or nonbank sources—to fund the initial loan-demand needs independent from the traditional financial system.
- We are starting to see margin compression as loans renew at lower rates and securities start to mature. Our bank is in a very liquid position with difficulty deploying funds to keep margins up. The loan portfolio has seen some softness in recent weeks, which we suspect is due to the uncertainty of the elections. Businesses seem to be waiting to make major business decisions until there is more clarity on a COVID-19 vaccine timeline or until the elections are decided.
- The recovery remains K-shaped, which describes the divergent fortunes of industries, companies and groups of Americans resulting from the pandemic.
- Getting the PPP [Paycheck Protection Program] loans off our books and forgiven has become much more of a burden than originally thought. The Main Street lending program is disappointing; I probably would have more success trying to build an Atlas rocket to land on Mars. The concept of the Main Street program is great, but the launch is a disaster. After the experience with PPP loans, I'm not sure just how much we will trust any more government programs.
- It’s incredibly difficult working through 2021 forecasting due to uncertainty regarding the outlook on health, political and economic fronts. Lending/payment trends improved during the third quarter, with rates of improvement slowing heading into the fourth quarter. We are cautiously optimistic regarding the second quarter of 2021 and beyond at this time.
- The Federal Reserve has reduced interest rates to the point that loans are not economically feasible.
- The government transition after the election [is an issue of concern].
- There is significant uncertainty around the following: the political landscape, a second wave of COVID outbreaks, a second wave of an economic turndown, federal spending.
- My banking outlook and general business outlook are dependent upon the election results and how the government handles the ongoing COVID-19 pandemic.
- The potential for losses due to COVID is ongoing.
Historical Data
Historical data can be downloaded dating back to March 2017. For the definitions, see data definitions.
NOTE: The following series were discontinued in May 2020: volume of core deposits, cost of funds, non-interest income and net interest margin.
Questions regarding the Banking Conditions Survey can be addressed to Emily Kerr at emily.kerr@dal.frb.org.
Sign up for our email alert to be automatically notified as soon as the latest Banking Conditions Survey is released on the web.