Banking Conditions Survey

December 2020
December 2020
What’s New
For this survey, respondents were asked supplemental questions on the impacts of the coronavirus (COVID-19). Read the special questions results.
Results Tables
Historical data are available from March 2017.
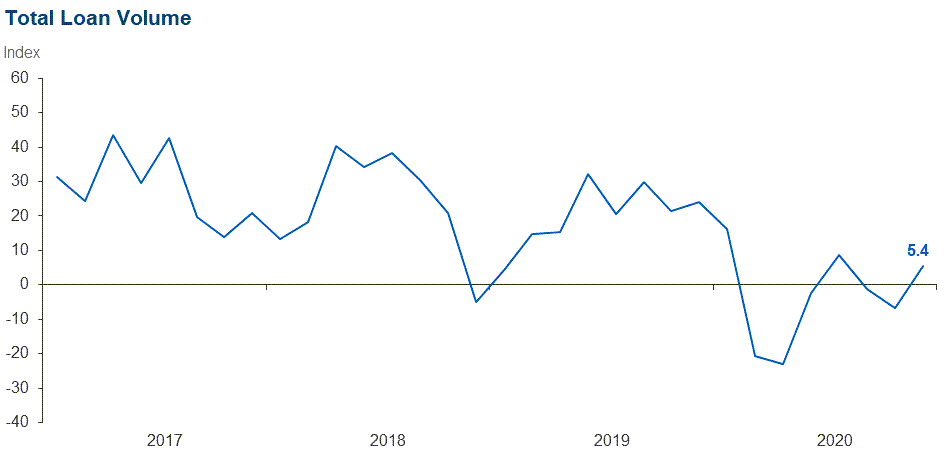
| Total Loans: Over the past six weeks, how have the following changed? | |||||
| Indicator | Current Index | Previous Index | % Reporting Increase | % Reporting No Change | % Reporting Decrease |
Loan volume | 5.4 | –6.8 | 34.2 | 37.0 | 28.8 |
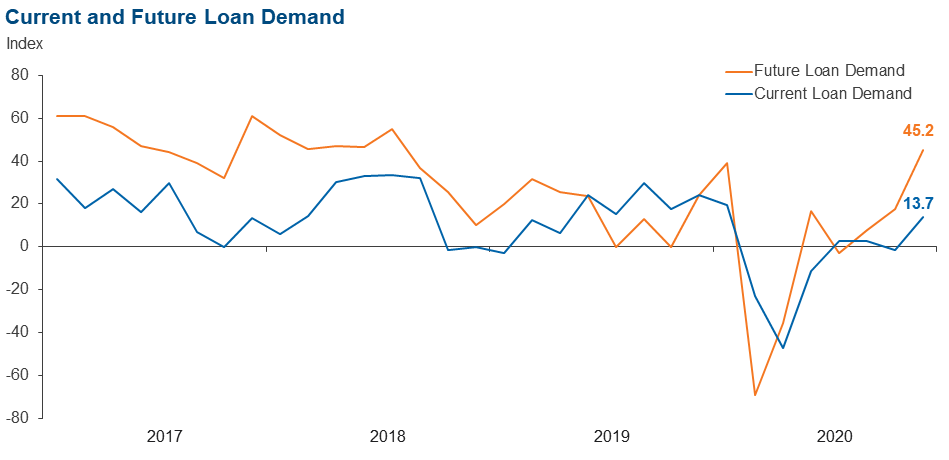
Loan demand | 13.7 | –1.3 | 35.6 | 42.5 | 21.9 |
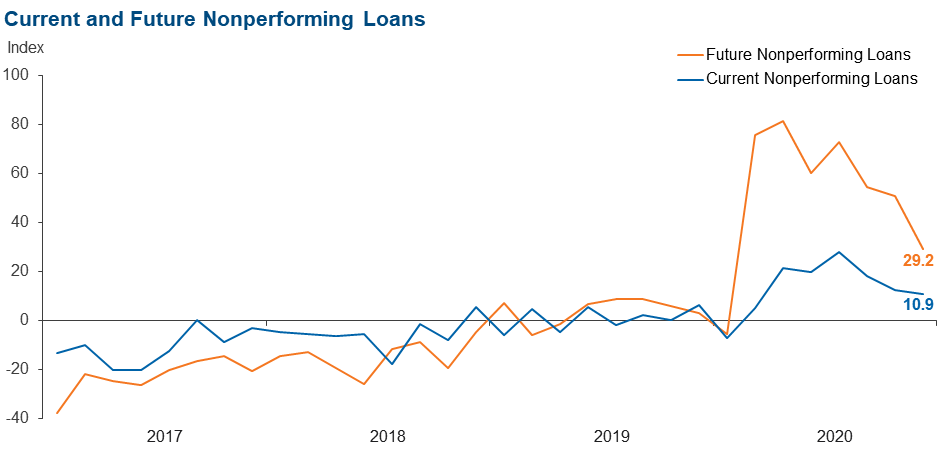
Nonperforming loans | 10.9 | 12.3 | 21.9 | 67.1 | 11.0 |
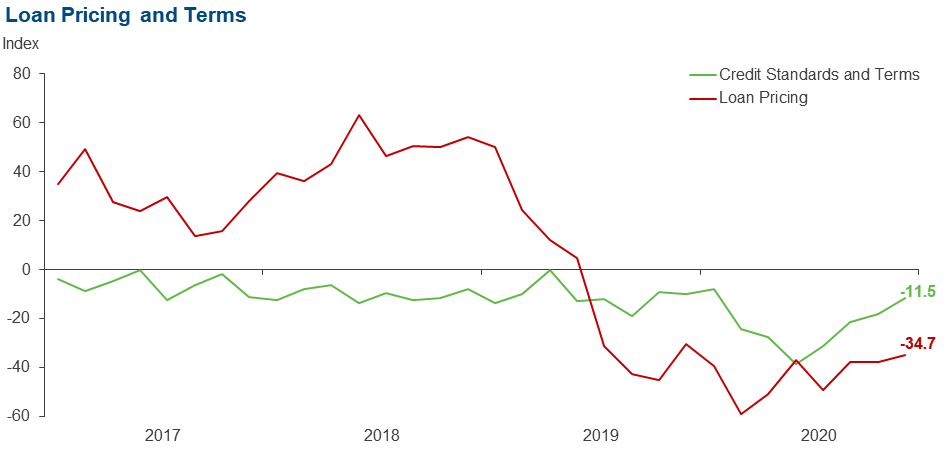
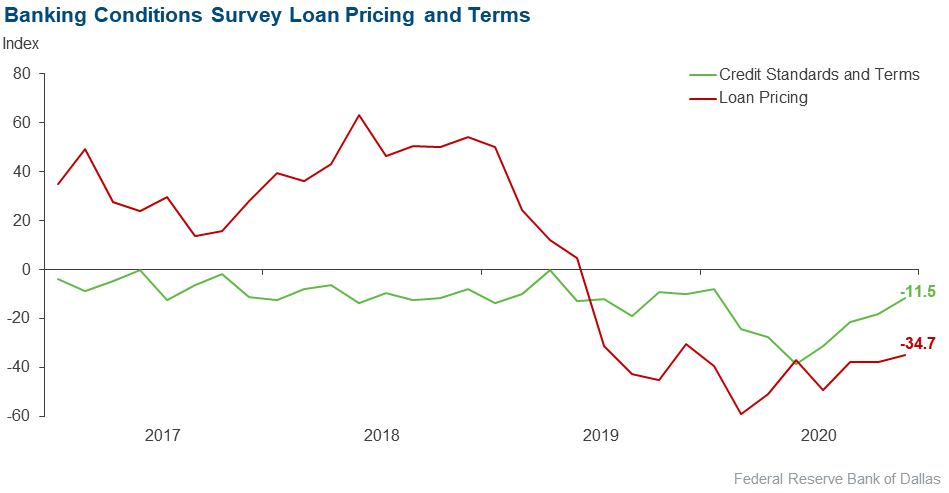
Loan pricing | –34.7 | –37.5 | 2.8 | 59.7 | 37.5 |
| Indicator | Current Index | Previous Index | % Reporting Eased | % Reporting No Change | % Reporting Tightened |
Credit standards and terms | –11.5 | –18.2 | 1.4 | 85.7 | 12.9 |
| Commercial and Industrial Loans: Over the past six weeks, how have the following changed? | |||||
| Indicator | Current Index | Previous Index | % Reporting Increase | % Reporting No Change | % Reporting Decrease |
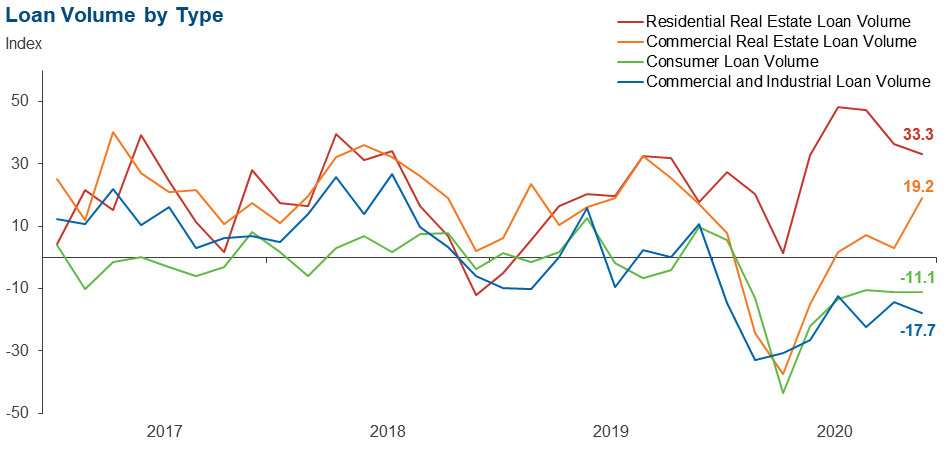
Loan volume | –17.7 | –14.3 | 13.2 | 55.9 | 30.9 |
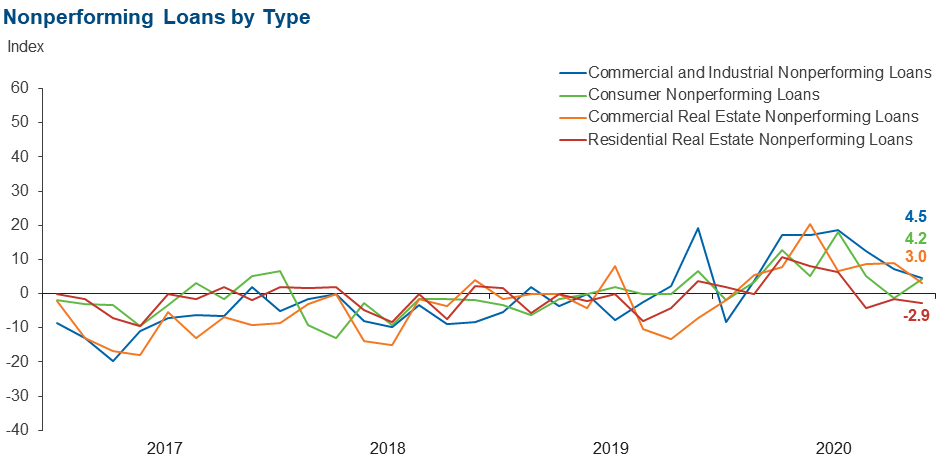
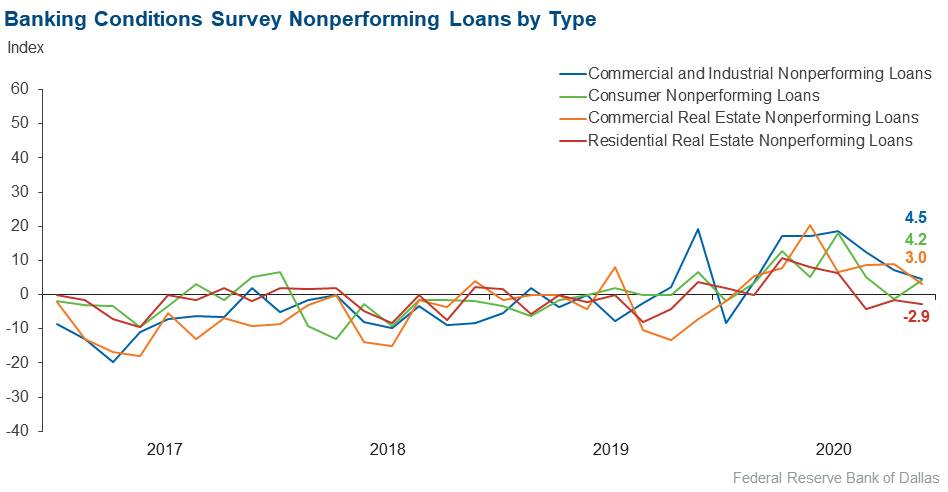
Nonperforming loans | 4.5 | 7.3 | 9.0 | 86.6 | 4.5 |
| Indicator | Current Index | Previous Index | % Reporting Eased | % Reporting No Change | % Reporting Tightened |
Credit standards and terms | –11.9 | –15.9 | 0.0 | 88.1 | 11.9 |
| Commercial Real Estate Loans: Over the past six weeks, how have the following changed? | |||||
| Indicator | Current Index | Previous Index | % Reporting Increase | % Reporting No Change | % Reporting Decrease |
Loan volume | 19.2 | 2.9 | 32.4 | 54.4 | 13.2 |
Nonperforming loans | 3.0 | 8.9 | 5.9 | 91.2 | 2.9 |
| Indicator | Current Index | Previous Index | % Reporting Eased | % Reporting No Change | % Reporting Tightened |
Credit standards and terms | –8.9 | –13.4 | 1.5 | 88.1 | 10.4 |
| Residential Real Estate Loans: Over the past six weeks, how have the following changed? | |||||
| Indicator | Current Index | Previous Index | % Reporting Increase | % Reporting No Change | % Reporting Decrease |
Loan volume | 33.3 | 36.3 | 42.0 | 49.3 | 8.7 |
Nonperforming loans | –2.9 | –1.5 | 5.8 | 85.5 | 8.7 |
| Indicator | Current Index | Previous Index | % Reporting Eased | % Reporting No Change | % Reporting Tightened |
Credit standards and terms | –2.9 | –5.8 | 0.0 | 97.1 | 2.9 |
| Consumer Loans: Over the past six weeks, how have the following changed? | |||||
| Indicator | Current Index | Previous Index | % Reporting Increase | % Reporting No Change | % Reporting Decrease |
Loan volume | –11.1 | –11.1 | 12.5 | 63.9 | 23.6 |
Nonperforming loans | 4.2 | –1.3 | 7.0 | 90.1 | 2.8 |
| Indicator | Current Index | Previous Index | % Reporting Eased | % Reporting No Change | % Reporting Tightened |
Credit standards and terms | 0.0 | –2.8 | 1.4 | 97.1 | 1.4 |
| Banking Outlook: What is your expectation for the following items six months from now? | |||||
| Indicator | Current Index | Previous Index | % Reporting Increase | % Reporting No Change | % Reporting Decrease |
Total loan demand | 45.2 | 17.8 | 57.5 | 30.1 | 12.3 |
Nonperforming loans | 29.2 | 50.7 | 38.9 | 51.4 | 9.7 |
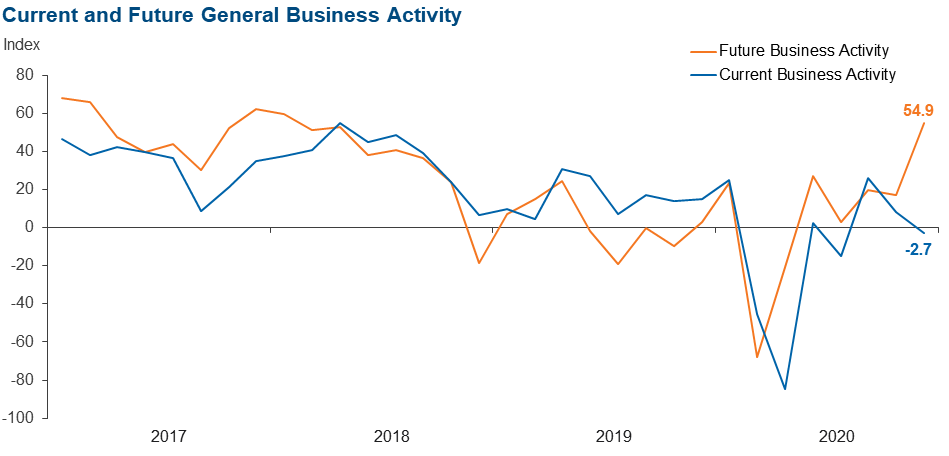
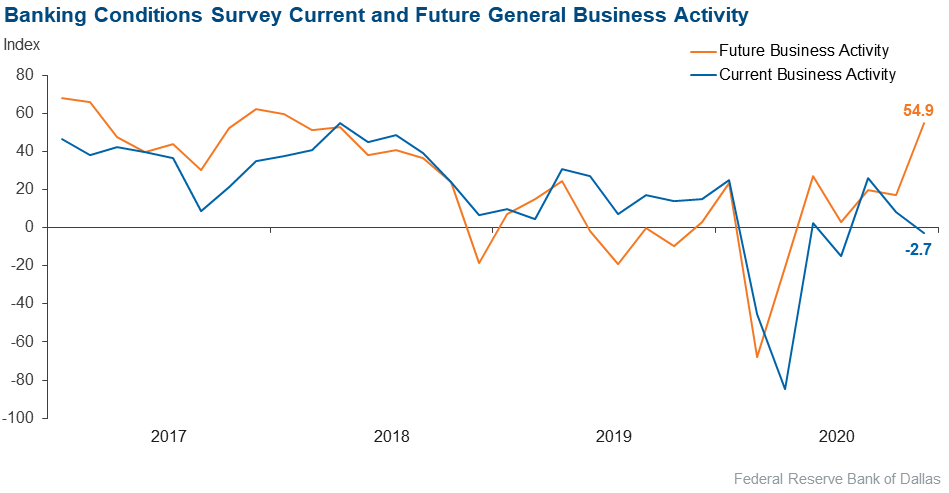
| General Business Activity: What is your evaluation of the level of activity? | |||||
| Indicator | Current Index | Previous Index | % Reporting Better | % Reporting No Change | % Reporting Worse |
Over the past six weeks | –2.7 | 8.2 | 19.2 | 58.9 | 21.9 |
Six months from now | 54.9 | 16.9 | 69.0 | 16.9 | 14.1 |
Next release: February 16
|
Data were collected Dec. 15–22, and 72 financial institutions responded to the survey. The Federal Reserve Bank of Dallas conducts the Banking Conditions Survey twice each quarter to obtain a timely assessment of activity at banks and credit unions headquartered in the Eleventh Federal Reserve District. CEOs or senior loan officers of financial institutions report on how conditions have changed for indicators such as loan volume, nonperforming loans and loan pricing. Respondents are also asked to report on their banking outlook and their evaluation of general business activity. Survey responses are used to calculate an index for each indicator. Each index is calculated by subtracting the percentage of respondents reporting a decrease (or tightening) from the percentage reporting an increase (or easing). When the share of respondents reporting an increase exceeds the share reporting a decrease, the index will be greater than zero, suggesting the indicator has increased over the prior reporting period. If the share of respondents reporting a decrease exceeds the share reporting an increase, the index will be below zero, suggesting the indicator has decreased over the prior reporting period. An index will be zero when the number of respondents reporting an increase is equal to the number reporting a decrease. |
December 2020
December 2020
Respondents were given an opportunity to comment on any issues that may be affecting their business.
These comments are from respondents’ completed surveys and have been edited for publication.
- Business activity seems steady in our area. Our margins are starting to become compressed due to the low-rate environment. It is becoming more difficult to deploy funds to keep margins up.
- Like many banks, we continue to struggle with excess deposits, falling commercial loan volume, shrinking margins, and limited options to invest the excess liquidity. Since the end of February, our deposit dollars have increased about 20 percent, with commercial deposits comprising about one-half of that increase. With most of our commercial customers holding more cash, combined with the second round of COVID-19 relief, it’s possible we may not see loan volume pick up in the first half of 2021.
- The business community seems resilient and ready for post-COVID days. Just the news of the vaccine has given many optimism and hope that sometime in the first quarter we will see some sort of normal return to business. Everyone is ready to slam the door on 2020 and move into the new year. Consumers seem to be hanging on and actually doing well. There is a demand for workers, and many jobs are left unfilled. All in all, the banking industry is bracing itself for regulatory whiplash with the new administration. The industry is hopeful for a moderate swing of the pendulum.
- The limitations placed on small businesses caused by the pandemic are going to be a real problem if they extend too far into 2021.
- PPP [Paycheck Protection Program] forgiveness applications are starting to be processed. This is allowing our small business customers to have some clarity on their debt situation. Now we have the potential of the government shutdown because of our political process. The strongest sector instantly becomes the weakest if this happens.
- Our deposits and assets have been increasing, and we are expecting the economy to improve or stay the same in 2021.
Historical Data
Historical data can be downloaded dating back to March 2017. For the definitions, see data definitions.
NOTE: The following series were discontinued in May 2020: volume of core deposits, cost of funds, non-interest income and net interest margin.
Questions regarding the Banking Conditions Survey can be addressed to Emily Kerr at emily.kerr@dal.frb.org.
Sign up for our email alert to be automatically notified as soon as the latest Banking Conditions Survey is released on the web.