Banking Conditions Survey

For this month’s survey, Eleventh District business executives were asked supplemental questions on the impacts of the COVID-19 pandemic. Read the special questions results.
Results Summary
Historical data are available from March 2017.
| Total Loans: Over the past six weeks, how have the following changed? | |||||
| Indicator | Current Index | Previous Index | % Reporting Increase | % Reporting No Change | % Reporting Decrease |
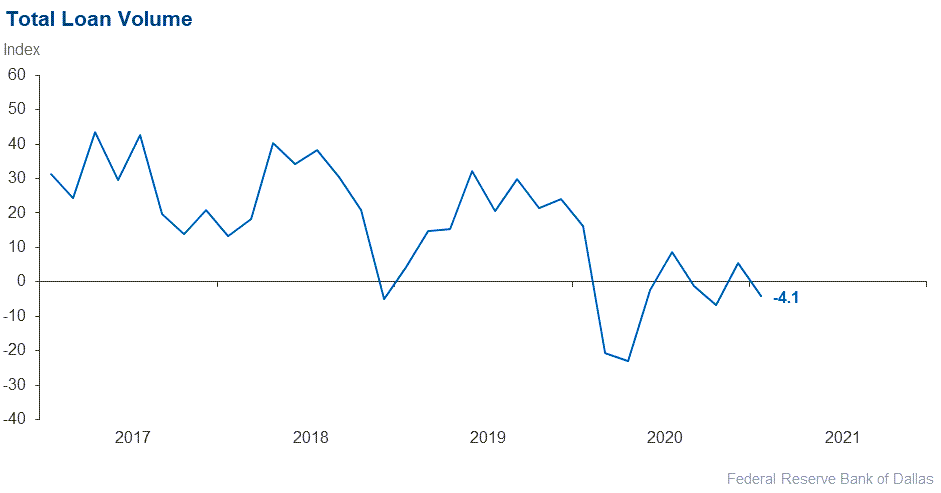
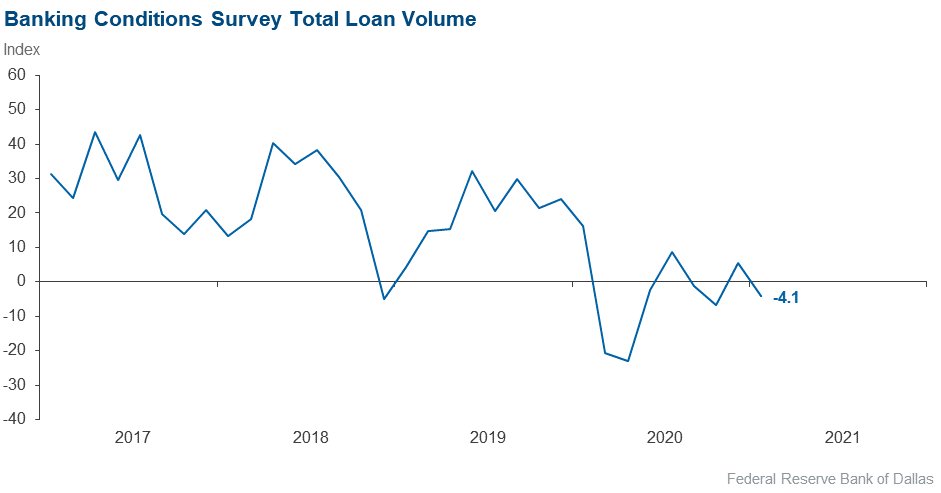
Loan volume | 14.9 | –4.1 | 33.8 | 47.3 | 18.9 |
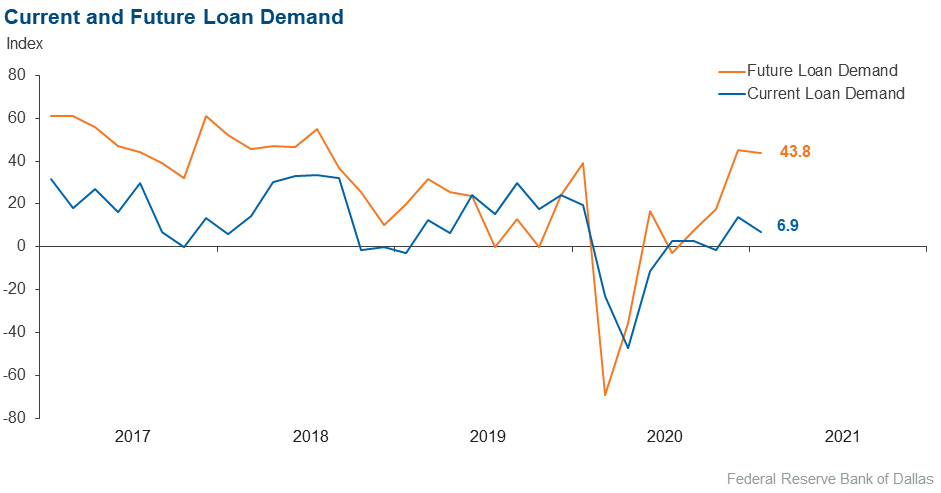
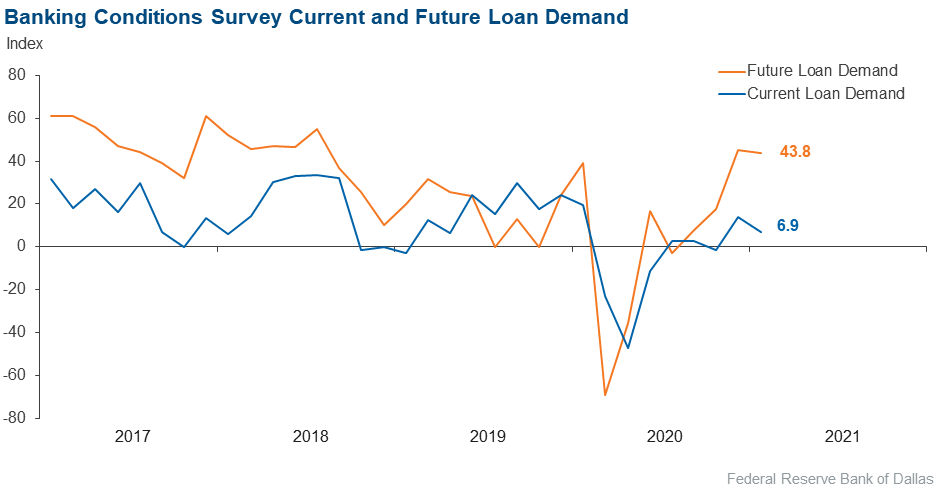
Loan demand | 16.7 | 6.9 | 36.1 | 44.4 | 19.4 |
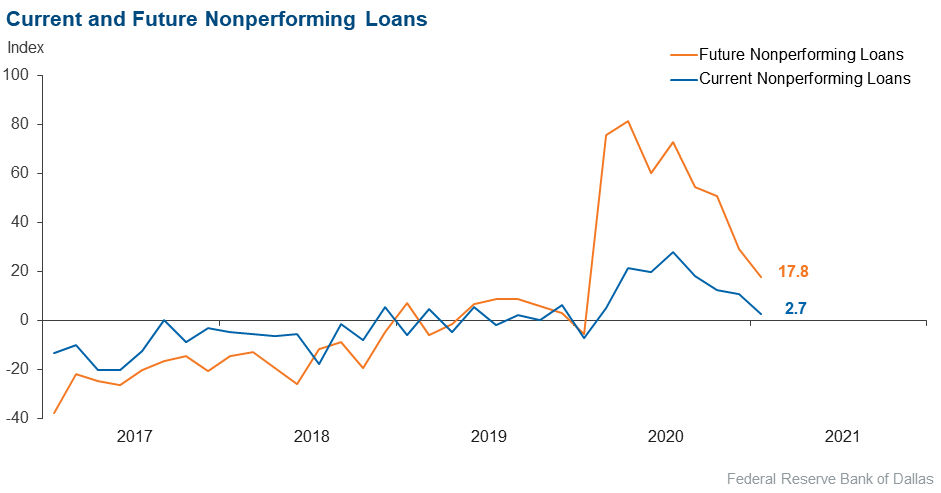
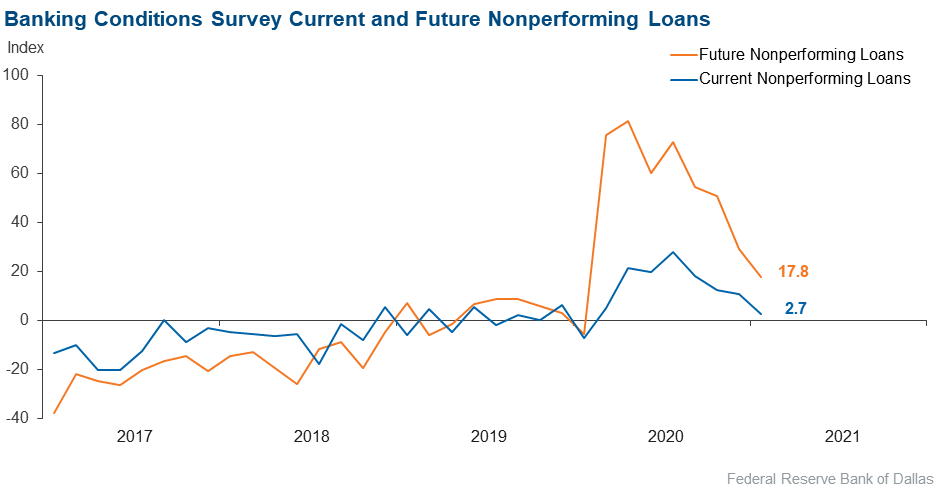
Nonperforming loans | –16.7 | 2.7 | 6.9 | 69.4 | 23.6 |
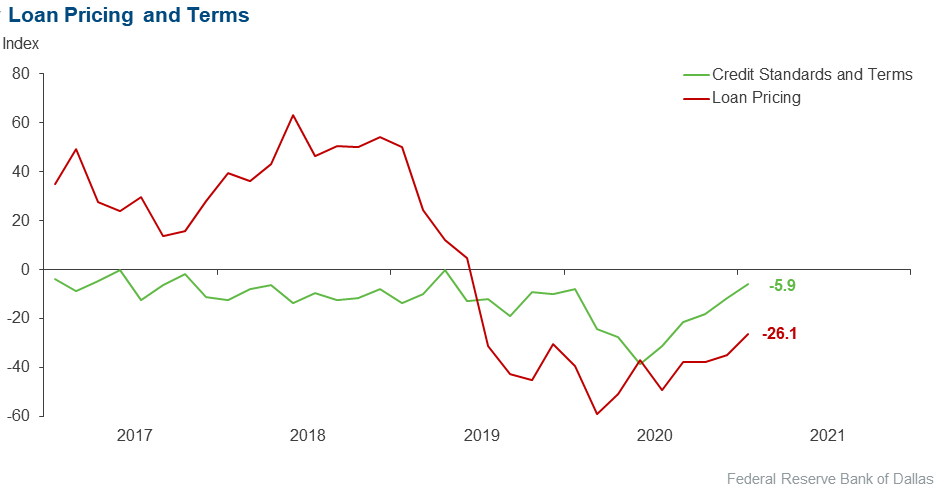
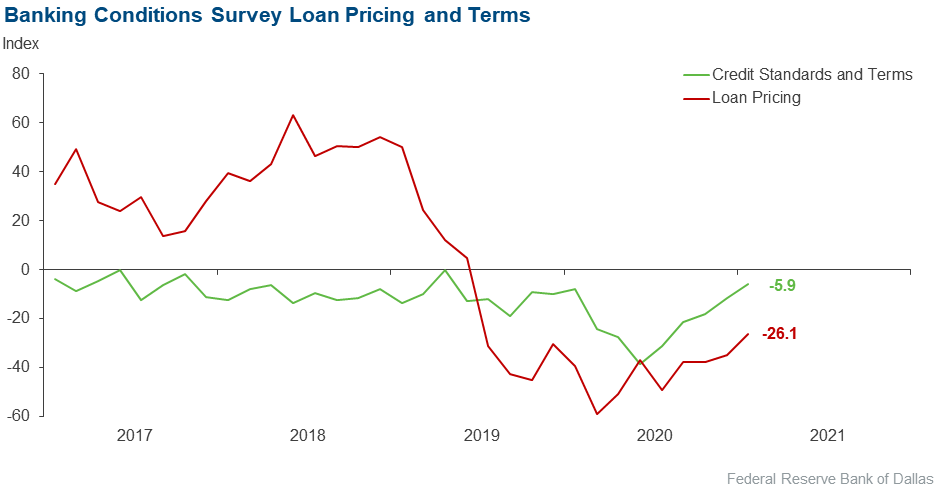
Loan pricing | –24.0 | –26.1 | 4.2 | 67.6 | 28.2 |
| Indicator | Current Index | Previous Index | % Reporting Eased | % Reporting No Change | % Reporting Tightened |
Credit standards and terms | –6.2 | –5.9 | 4.6 | 84.6 | 10.8 |
| Commercial and Industrial Loans: Over the past six weeks, how have the following changed? | |||||
| Indicator | Current Index | Previous Index | % Reporting Increase | % Reporting No Change | % Reporting Decrease |
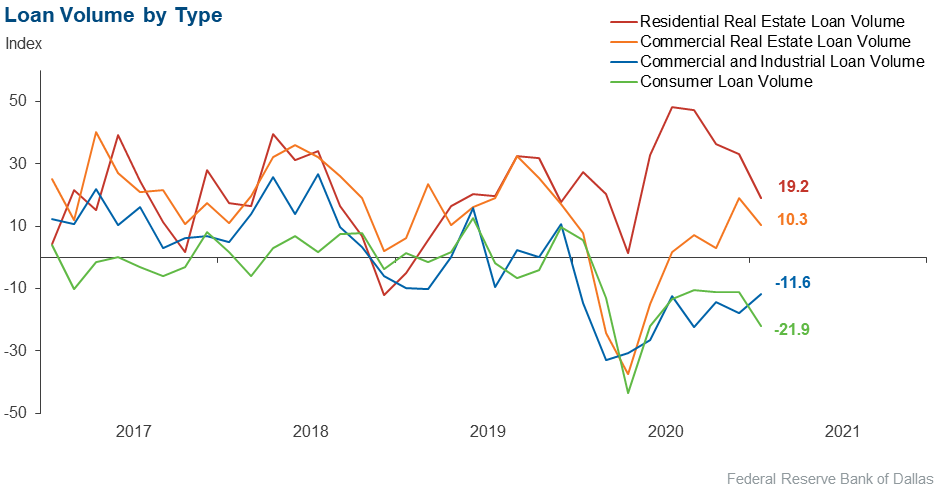
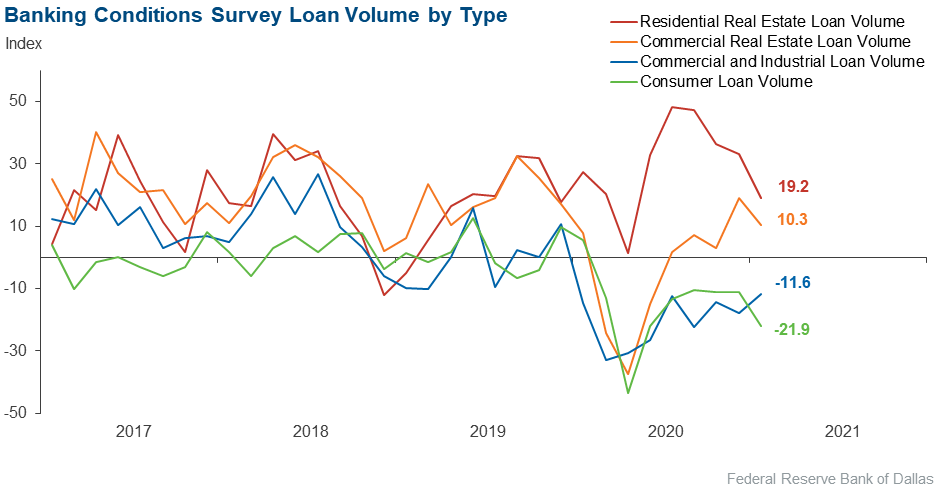
Loan volume | 0.0 | –11.6 | 19.4 | 61.1 | 19.4 |
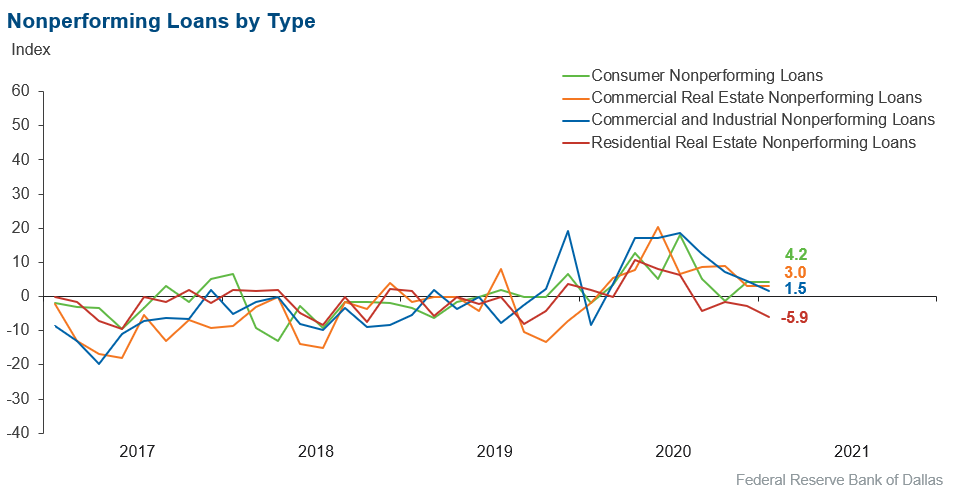
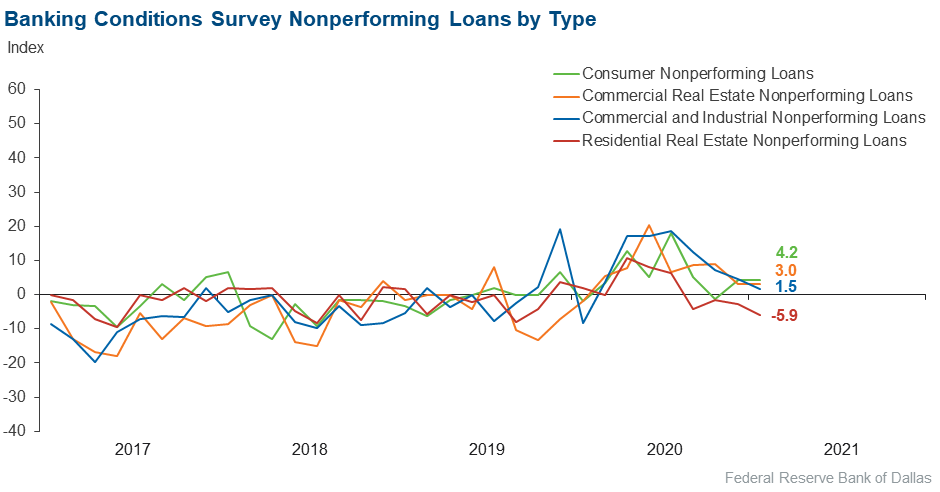
Nonperforming loans | –8.5 | 1.5 | 5.6 | 80.3 | 14.1 |
| Indicator | Current Index | Previous Index | % Reporting Eased | % Reporting No Change | % Reporting Tightened |
Credit standards and terms | –3.0 | –6.2 | 1.5 | 94.0 | 4.5 |
| Commercial Real Estate Loans: Over the past six weeks, how have the following changed? | |||||
| Indicator | Current Index | Previous Index | % Reporting Increase | % Reporting No Change | % Reporting Decrease |
Loan volume | 21.1 | 10.3 | 36.6 | 47.9 | 15.5 |
Nonperforming loans | –4.4 | 3.0 | 4.3 | 87.0 | 8.7 |
| Indicator | Current Index | Previous Index | % Reporting Eased | % Reporting No Change | % Reporting Tightened |
Credit standards and terms | –5.7 | –7.3 | 4.3 | 85.7 | 10.0 |
| Residential Real Estate Loans: Over the past six weeks, how have the following changed? | |||||
| Indicator | Current Index | Previous Index | % Reporting Increase | % Reporting No Change | % Reporting Decrease |
Loan volume | 23.6 | 19.2 | 37.5 | 48.6 | 13.9 |
Nonperforming loans | –8.5 | –5.9 | 2.8 | 85.9 | 11.3 |
| Indicator | Current Index | Previous Index | % Reporting Eased | % Reporting No Change | % Reporting Tightened |
Credit standards and terms | –1.4 | –2.9 | 0.0 | 98.6 | 1.4 |
| Consumer Loans: Over the past six weeks, how have the following changed? | |||||
| Indicator | Current Index | Previous Index | % Reporting Increase | % Reporting No Change | % Reporting Decrease |
Loan volume | –5.5 | –21.9 | 15.3 | 63.9 | 20.8 |
Nonperforming loans | –7.1 | 4.2 | 2.9 | 87.1 | 10.0 |
| Indicator | Current Index | Previous Index | % Reporting Eased | % Reporting No Change | % Reporting Tightened |
Credit standards and terms | –1.4 | 1.4 | 0.0 | 98.6 | 1.4 |
| Banking Outlook: What is your expectation for the following items six months from now? | |||||
| Indicator | Current Index | Previous Index | % Reporting Increase | % Reporting No Change | % Reporting Decrease |
Total loan demand | 54.1 | 43.8 | 67.6 | 18.9 | 13.5 |
Nonperforming loans | –5.4 | 17.8 | 15.1 | 64.4 | 20.5 |
| General Business Activity: What is your evaluation of the level of activity? | |||||
| Indicator | Current Index | Previous Index | % Reporting Better | % Reporting No Change | % Reporting Worse |
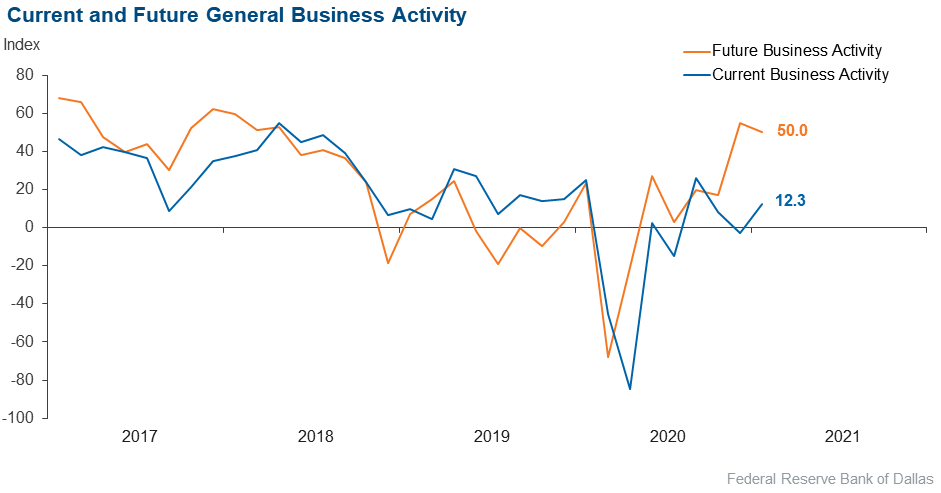
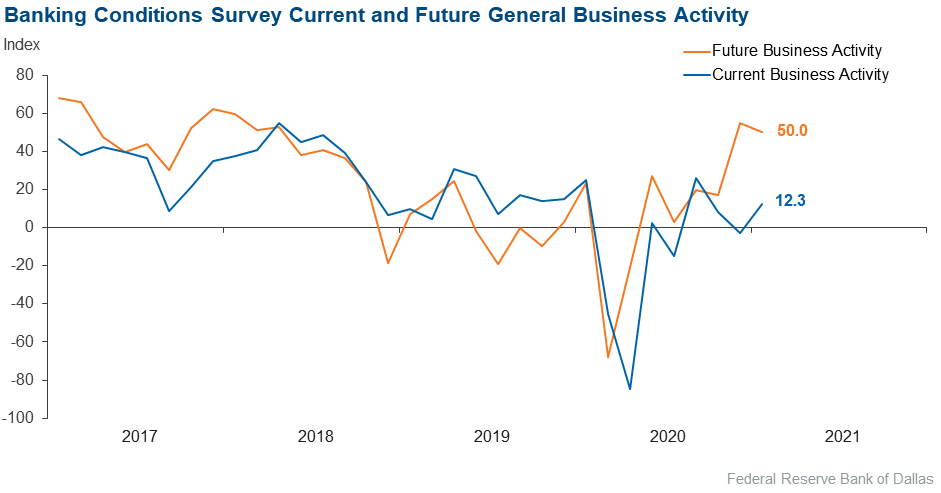
Over the past six weeks | 38.3 | 12.3 | 49.3 | 39.7 | 11.0 |
Six months from now | 76.4 | 50.0 | 79.2 | 18.1 | 2.8 |
Next release: May 17, 2021
Data were collected February 2–10, and 73 financial institutions responded to the survey. The Federal Reserve Bank of Dallas conducts the Banking Conditions Survey twice each quarter to obtain a timely assessment of activity at banks and credit unions headquartered in the Eleventh Federal Reserve District. CEOs or senior loan officers of financial institutions report on how conditions have changed for indicators such as loan volume, nonperforming loans and loan pricing. Respondents are also asked to report on their banking outlook and their evaluation of general business activity.
Survey responses are used to calculate an index for each indicator. Each index is calculated by subtracting the percentage of respondents reporting a decrease (or tightening) from the percentage reporting an increase (or easing). When the share of respondents reporting an increase exceeds the share reporting a decrease, the index will be greater than zero, suggesting the indicator has increased over the prior reporting period. If the share of respondents reporting a decrease exceeds the share reporting an increase, the index will be below zero, suggesting the indicator has decreased over the prior reporting period. An index will be zero when the number of respondents reporting an increase is equal to the number reporting a decrease.
Comments from Survey Respondents
Respondents were given an opportunity to comment on any issues that may be affecting their business.
These comments are from respondents’ completed surveys and have been edited for publication.
- We have seen an excess of funds from stimulus payments and have begun receiving SBA [Small Business Administration] funds to pay off PPP [Paycheck Protection Program] loans, which further increases our liquidity. It is difficult to deploy the excess funds at the current time with rates so low. We are also seeing margin compression. I believe many people and businesses are starting to believe the pandemic will start to subside by mid-to-late summer, and we should see increased economic metrics once the vaccine is more distributed. I believe we will see increased loan demand in the latter half of 2021.
- Loan demand has been minimal. We remain flush with liquidity, and investment options for community banks in this low-rate environment remain limited/challenging. Our margins and profitability measures for this year are hinged to loan volume growth, and at this time, a lot of uncertainty surrounds the health and expansion/growth appetite of our commercial customers.
- Widespread adoption of the vaccine in a timely manner is the only thing that matters now. People need hope that the end is near. All the stimulus money in the world can't get us there.
- Regulatory whiplash is of concern. Bankers like to play down the middle and limit the swings to the left and right.
- There is continued concern, with challenges in forecasting demand and broader economic trends due to uncertainty driven by the pandemic.
- There is some softening of loan demand, but loan quality continues to remain excellent with low charge-offs and delinquencies. We saw large loan demand in December but saw that loan demand shrink in January.
- The new administration is increasing the already-choking regulatory burden on banks.
- Right now the stimulus package is fueling the economy. What happens when that runs out?
- The new administration in Washington has taken detrimental executive actions, which will have an adverse impact on oil and gas exploration and production in southeast New Mexico. The uncertainty created will dampen business investment and reduce business activity in the near-to-mid term.
- The second round of PPP loans is helping most businesses that remain in trouble, and hopefully this will bridge the gap until they can get their businesses stabilized.
- We continue to position for the business environment to face further headwinds; however, it is undoubtedly difficult to forecast. Factors such as the velocity of the vaccine rollout, the percent of those taking the vaccine, government intervention and rate/attributes of variant COVID-19 strains will largely impact the macro direction.
Historical Data
Historical data can be downloaded dating back to March 2017. For the definitions, see data definitions.
NOTE: The following series were discontinued in May 2020: volume of core deposits, cost of funds, non-interest income and net interest margin.
Questions regarding the Banking Conditions Survey can be addressed to Emily Kerr at emily.kerr@dal.frb.org.
Sign up for our email alert to be automatically notified as soon as the latest Banking Conditions Survey is released on the web.