Banking Conditions Survey

Results Summary
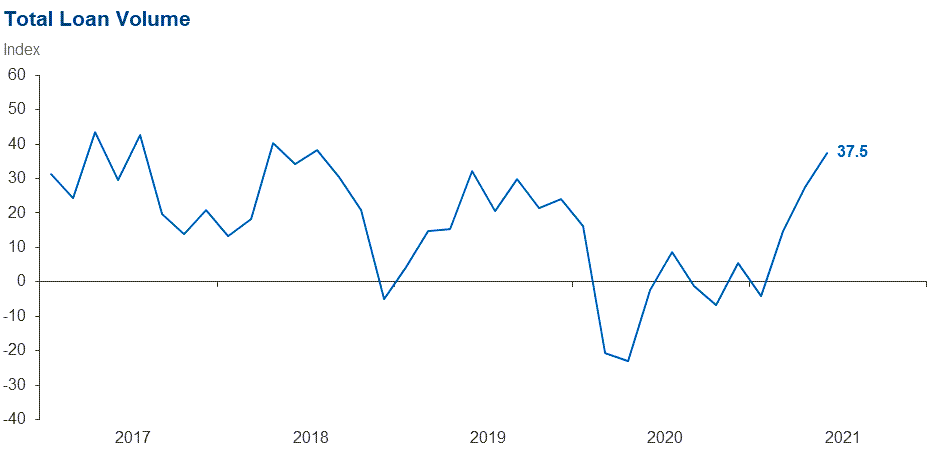
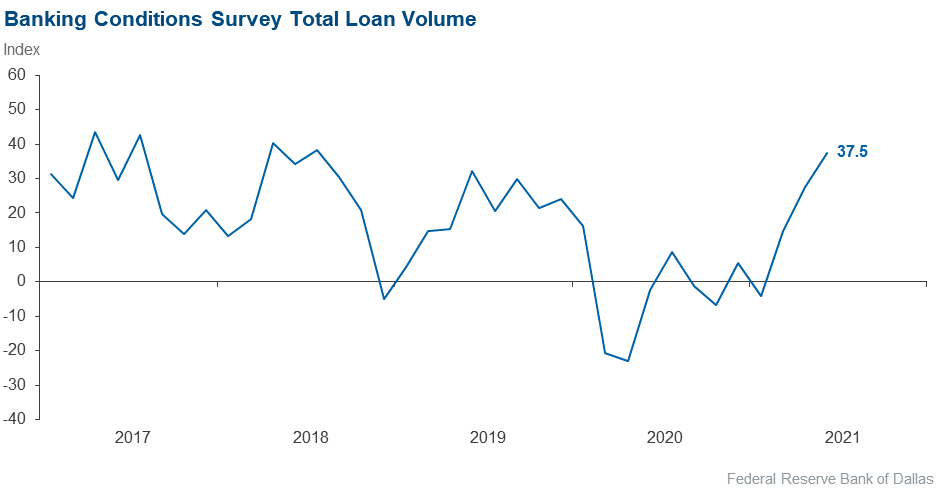
Historical data are available from March 2017.
| Total Loans: Over the past six weeks, how have the following changed? | |||||
| Indicator | Current Index | Previous Index | % Reporting Increase | % Reporting No Change | % Reporting Decrease |
Loan volume | 37.5 | 27.6 | 51.6 | 34.4 | 14.1 |
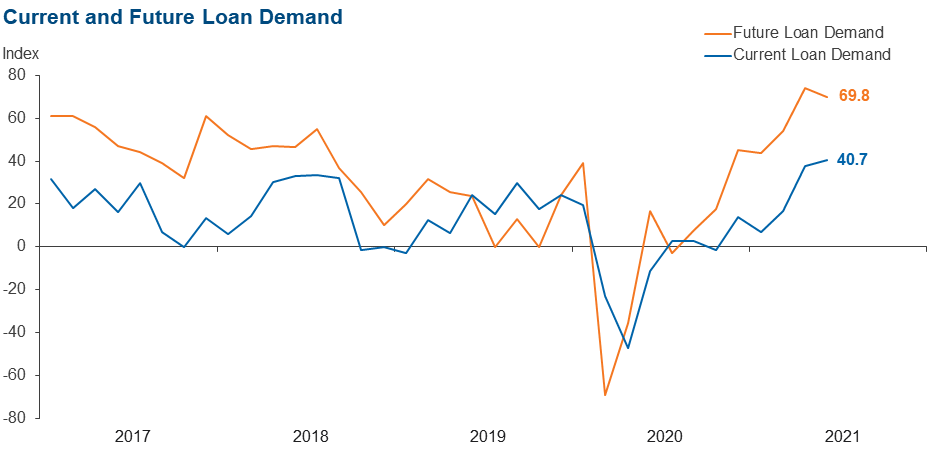
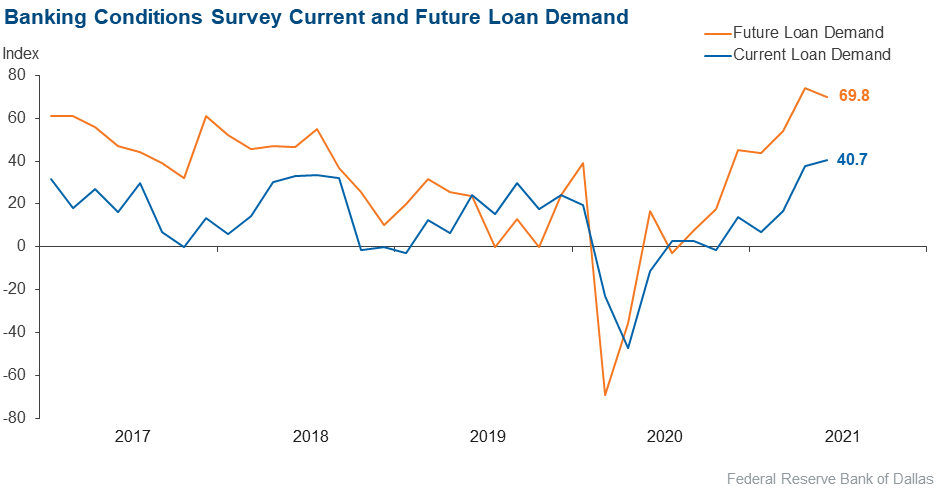
Loan demand | 40.7 | 37.7 | 51.6 | 37.5 | 10.9 |
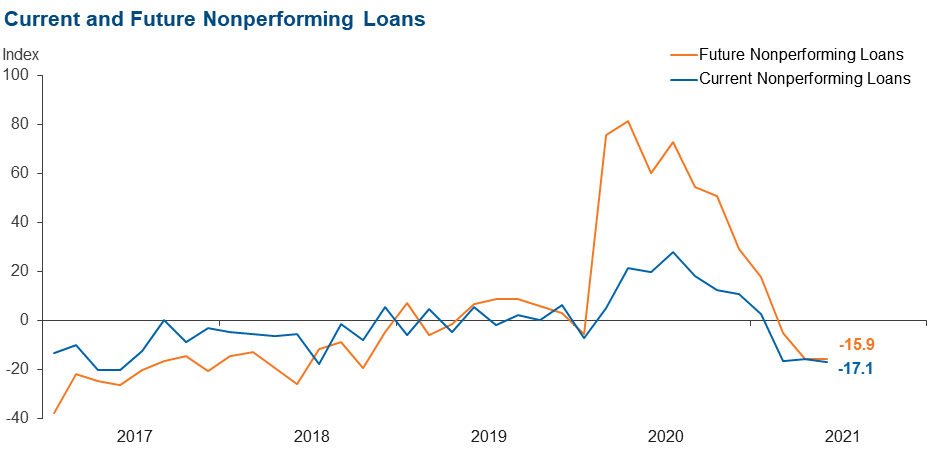
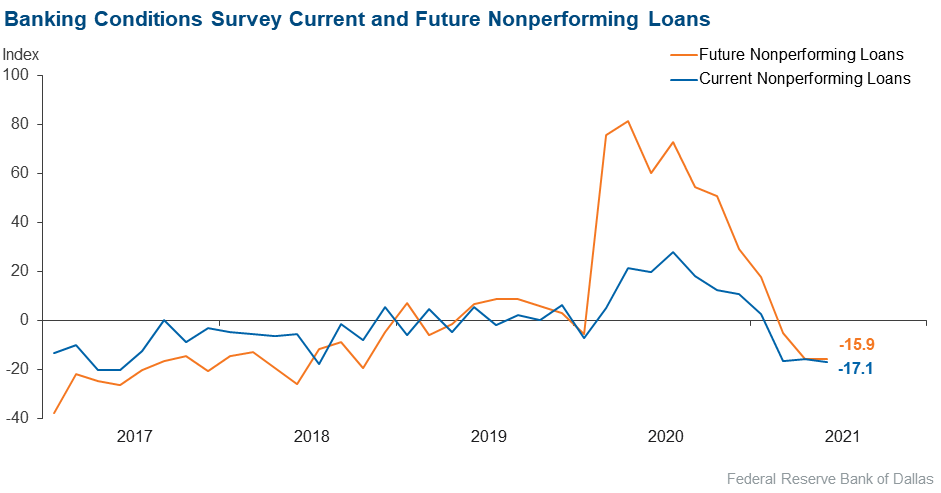
Nonperforming loans | –17.1 | –15.9 | 6.3 | 70.3 | 23.4 |
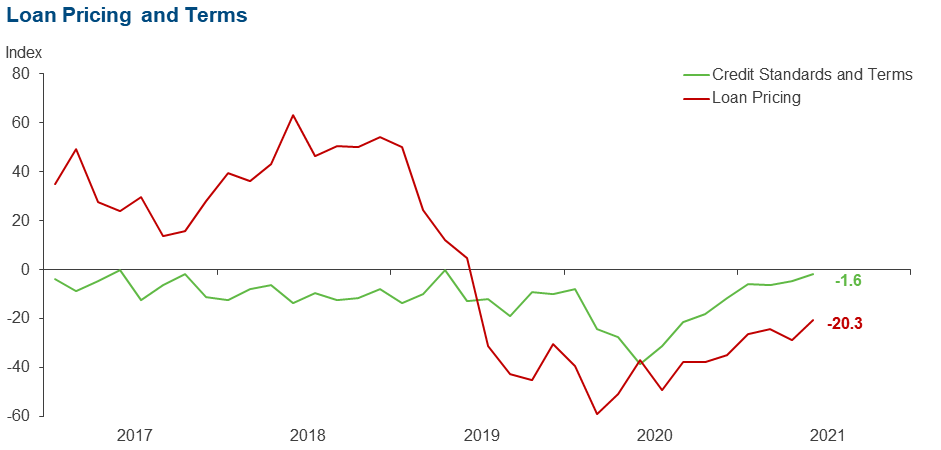
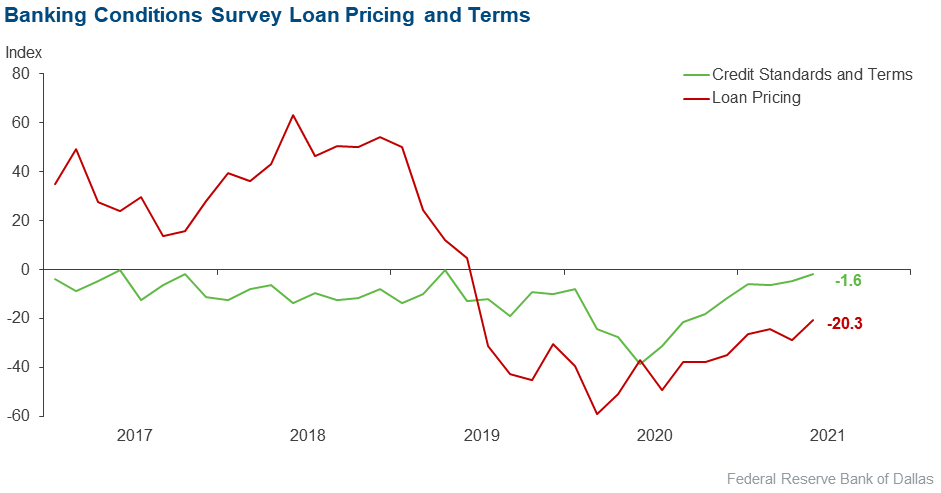
Loan pricing | –20.3 | –28.8 | 4.7 | 70.3 | 25.0 |
| Indicator | Current Index | Previous Index | % Reporting Eased | % Reporting No Change | % Reporting Tightened |
Credit standards and terms | –1.6 | –4.6 | 1.6 | 95.2 | 3.2 |
| Commercial and Industrial Loans: Over the past six weeks, how have the following changed? | |||||
| Indicator | Current Index | Previous Index | % Reporting Increase | % Reporting No Change | % Reporting Decrease |
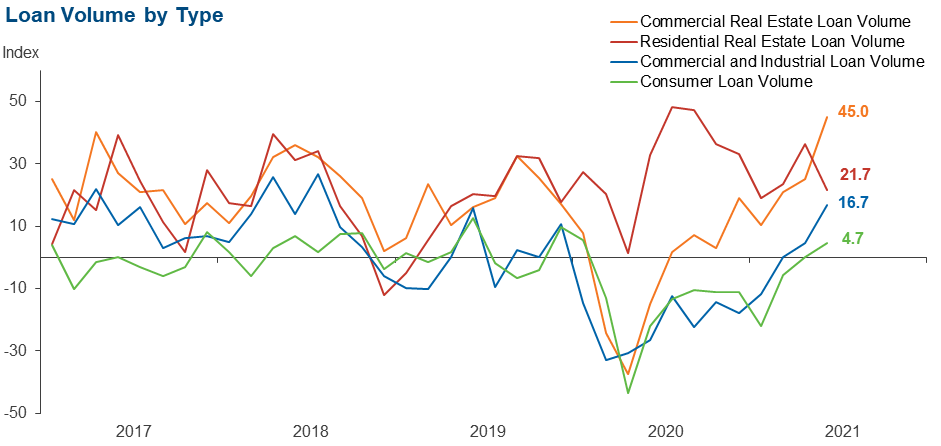
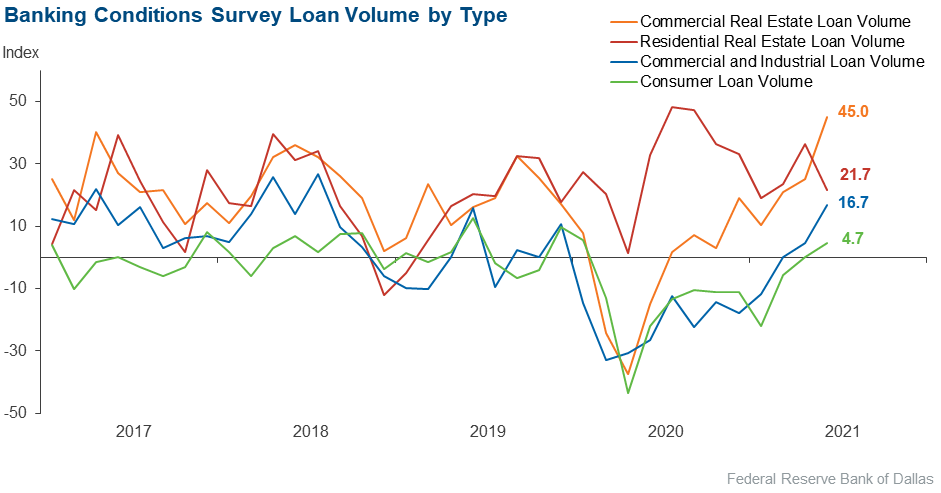
Loan volume | 16.7 | 4.5 | 30.0 | 56.7 | 13.3 |
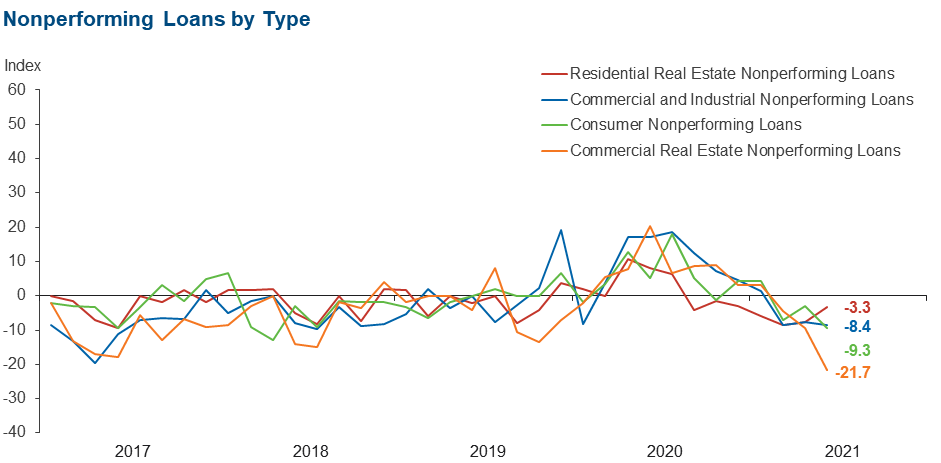
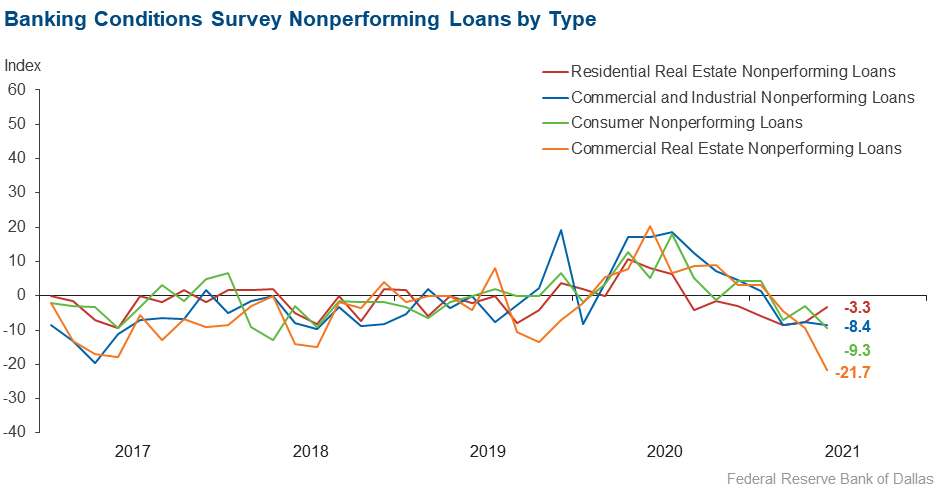
Nonperforming loans | –8.4 | –7.6 | 3.3 | 85.0 | 11.7 |
| Indicator | Current Index | Previous Index | % Reporting Eased | % Reporting No Change | % Reporting Tightened |
Credit standards and terms | –3.3 | –3.1 | 0.0 | 96.7 | 3.3 |
| Commercial Real Estate Loans: Over the past six weeks, how have the following changed? | |||||
| Indicator | Current Index | Previous Index | % Reporting Increase | % Reporting No Change | % Reporting Decrease |
Loan volume | 45.0 | 25.0 | 51.7 | 41.7 | 6.7 |
Nonperforming loans | –21.7 | –9.4 | 0.0 | 78.3 | 21.7 |
| Indicator | Current Index | Previous Index | % Reporting Eased | % Reporting No Change | % Reporting Tightened |
Credit standards and terms | –5.1 | 0.0 | 0.0 | 94.9 | 5.1 |
| Residential Real Estate Loans: Over the past six weeks, how have the following changed? | |||||
| Indicator | Current Index | Previous Index | % Reporting Increase | % Reporting No Change | % Reporting Decrease |
Loan volume | 21.7 | 36.4 | 35.0 | 51.7 | 13.3 |
Nonperforming loans | –3.3 | –7.6 | 1.7 | 93.3 | 5.0 |
| Indicator | Current Index | Previous Index | % Reporting Eased | % Reporting No Change | % Reporting Tightened |
Credit standards and terms | –3.4 | 1.5 | 0.0 | 96.6 | 3.4 |
| Consumer Loans: Over the past six weeks, how have the following changed? | |||||
| Indicator | Current Index | Previous Index | % Reporting Increase | % Reporting No Change | % Reporting Decrease |
Loan volume | 4.7 | 0.0 | 22.2 | 60.3 | 17.5 |
Nonperforming loans | –9.3 | –3.0 | 1.6 | 87.5 | 10.9 |
| Indicator | Current Index | Previous Index | % Reporting Eased | % Reporting No Change | % Reporting Tightened |
Credit standards and terms | 1.6 | 1.5 | 1.6 | 98.4 | 0.0 |
| Banking Outlook: What is your expectation for the following items six months from now? | |||||
| Indicator | Current Index | Previous Index | % Reporting Increase | % Reporting No Change | % Reporting Decrease |
Total loan demand | 69.8 | 74.0 | 74.6 | 20.6 | 4.8 |
Nonperforming loans | –15.9 | –15.9 | 9.5 | 65.1 | 25.4 |
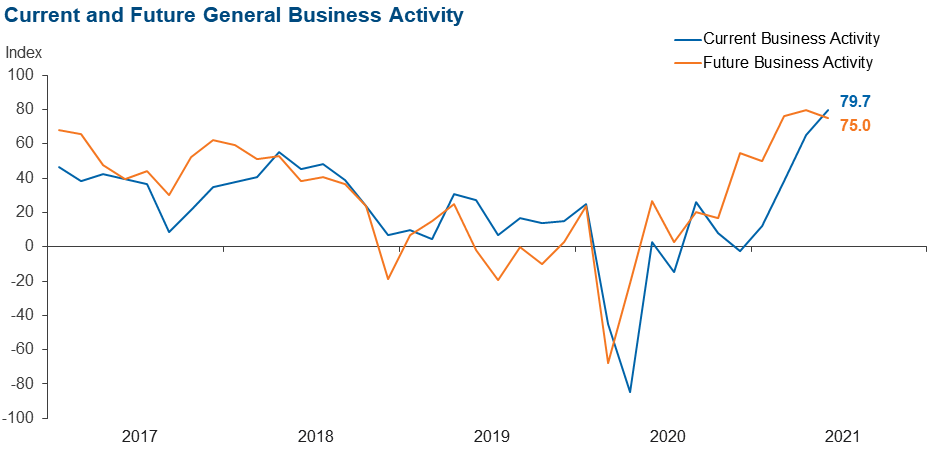
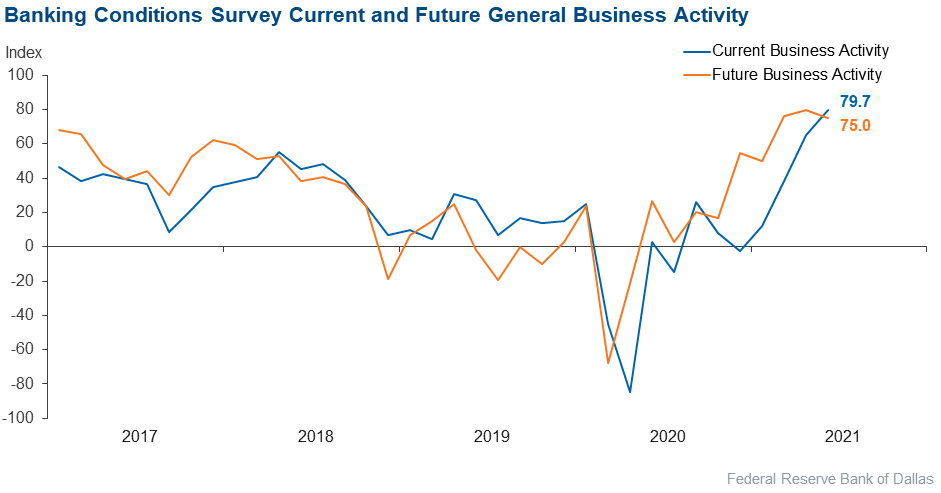
| General Business Activity: What is your evaluation of the level of activity? | |||||
| Indicator | Current Index | Previous Index | % Reporting Better | % Reporting No Change | % Reporting Worse |
Over the past six weeks | 79.7 | 65.2 | 81.3 | 17.2 | 1.6 |
Six months from now | 75.0 | 79.8 | 78.1 | 18.8 | 3.1 |
Next release: August 23, 2021
Data were collected June 15–23, and 64 financial institutions responded to the survey. The Federal Reserve Bank of Dallas conducts the Banking Conditions Survey twice each quarter to obtain a timely assessment of activity at banks and credit unions headquartered in the Eleventh Federal Reserve District. CEOs or senior loan officers of financial institutions report on how conditions have changed for indicators such as loan volume, nonperforming loans and loan pricing. Respondents are also asked to report on their banking outlook and their evaluation of general business activity.
Survey responses are used to calculate an index for each indicator. Each index is calculated by subtracting the percentage of respondents reporting a decrease (or tightening) from the percentage reporting an increase (or easing). When the share of respondents reporting an increase exceeds the share reporting a decrease, the index will be greater than zero, suggesting the indicator has increased over the prior reporting period. If the share of respondents reporting a decrease exceeds the share reporting an increase, the index will be below zero, suggesting the indicator has decreased over the prior reporting period. An index will be zero when the number of respondents reporting an increase is equal to the number reporting a decrease.
Comments from Survey Respondents
Respondents were given an opportunity to comment on any issues that may be affecting their business.
These comments are from respondents’ completed surveys and have been edited for publication.
- We are still hearing about issues with companies finding enough labor.
- Overall, customers and prospects appear ready, willing and able to get back to business. We continue to follow CDC [Centers for Disease Control] guidelines relative to social distancing and health protocols and remain grateful for the support and guidance received from our regulators pertaining to the pandemic. So far our employees, customers and prospects have responded in a very positive and favorable manner.
- Political uncertainty and higher rates.
- I am concerned about a more-aggressive regulatory posture of the CFPB [Consumer Financial Protection Bureau] and its impact on consumer lending.
- We are seeing margin pressure due to the low rate environment. However, this is being helped by increased loan demand. We are seeing improvement in the general business environment in the past six weeks and believe this trend will continue over the next six weeks.
- We are beginning to see commodity/input inflation (i.e., steel, resin, lumber, logistics) affecting credit quality through margin compression on borrowers unable to raise prices.
- Lots of talk about inflation and, as a community bank, we are trying to look over the horizon. There is a lot of liquidity in the system, and every bank seems to be chasing the same deal. Banks are offering lower and lower rates while extending liberal terms. All of this gives us concern about future asset liability for the industry. It’s tempting to jump on the bandwagon, but these seem like uncertain times.
- An area of concern is the supply/demand imbalance for residential real estate; borrowers are struggling to find a suitable home for sale in their price range due to low inventory and high demand resulting in challenging situations. Also of concern is significant levels of liquidity chasing after low-yielding investments resulting in challenges from a margin standpoint. While less specific at this time, the possibility of additional regulatory burdens on financial institutions versus lower/lack of regulation on FinTechs and other nontraditional market players create both strategic risk and reputation/regulatory risk.
- The Federal Reserve artificially holding interest rates low.
- Extremely low investment rates and excess stimulus in the market hurting profitability. Fee income continues to decline.
- Margins are beginning to slightly improve as refinancing activity has slowed.
- CECL [current expected credit losses] for small institutions; still not needed, but we prepare anyway. Also, inflation talk.
- As a residential mortgage lender that holds the paper, we are concerned about home values increasing in all of our markets. We are seeing appraisers having difficulty getting appraised values up to contracted sales prices. Is a housing bubble on the horizon?
- Increased tax rates, additional compliance issues, tight margins because of low interest rates, outlandish government regulation and inflation.
- New regulations.
Historical Data
Historical data can be downloaded dating back to March 2017. For the definitions, see data definitions.
NOTE: The following series were discontinued in May 2020: volume of core deposits, cost of funds, non-interest income and net interest margin.
Questions regarding the Banking Conditions Survey can be addressed to Emily Kerr at emily.kerr@dal.frb.org.
Sign up for our email alert to be automatically notified as soon as the latest Banking Conditions Survey is released on the web.