Banking Conditions Survey

For this month’s survey, Eleventh District banking executives were asked supplemental questions about their outlook, deposits and lending. Read the special questions results.
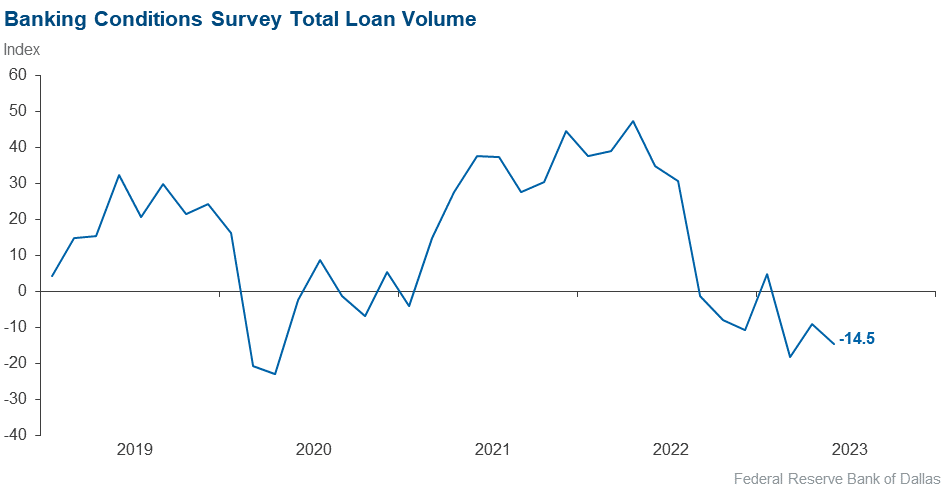
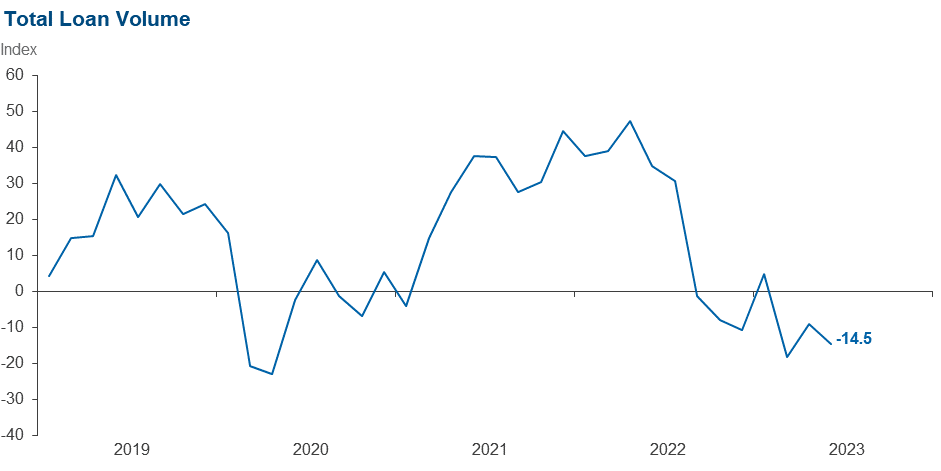
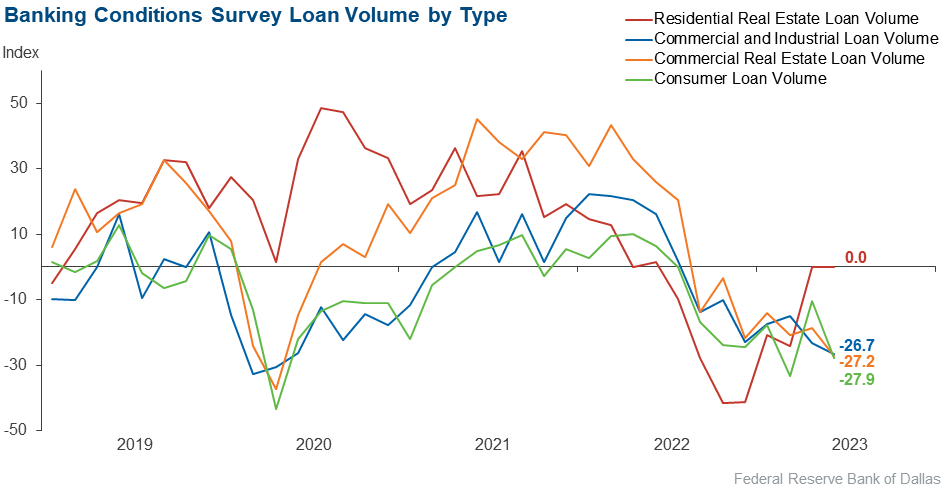
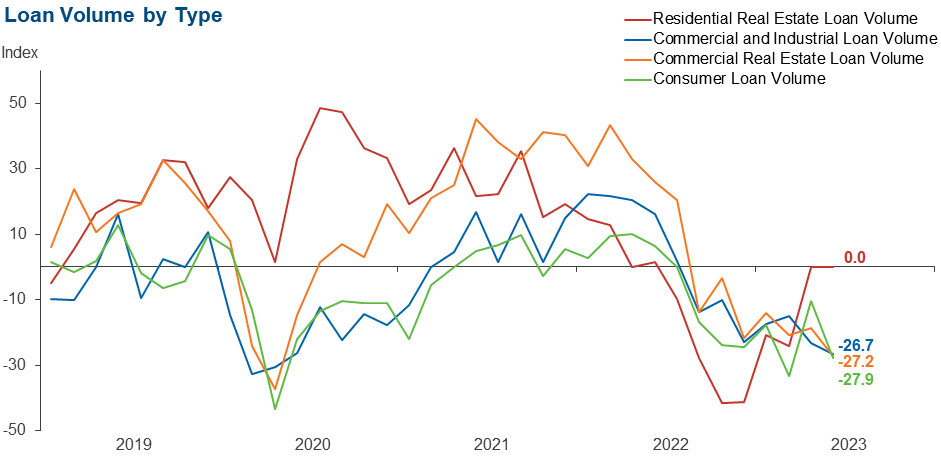
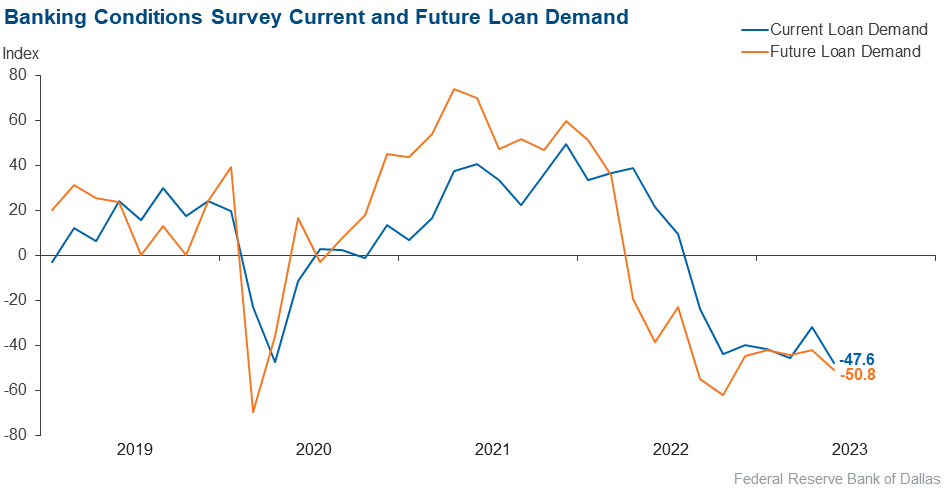
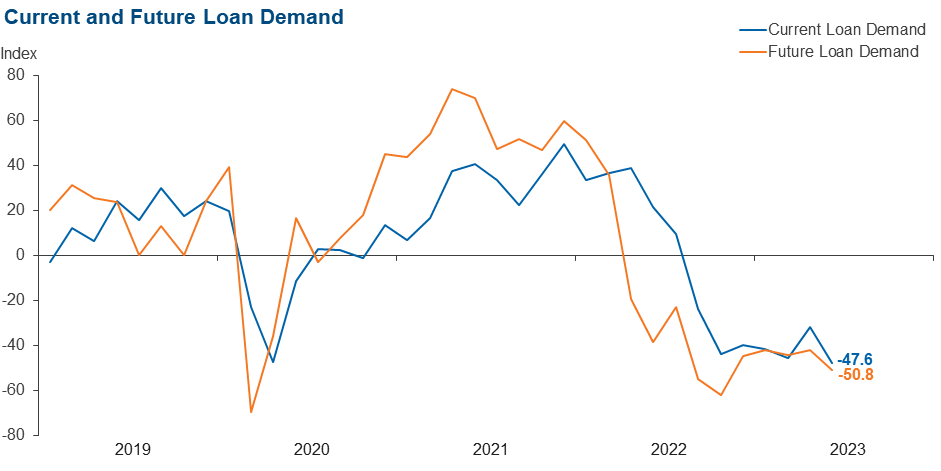
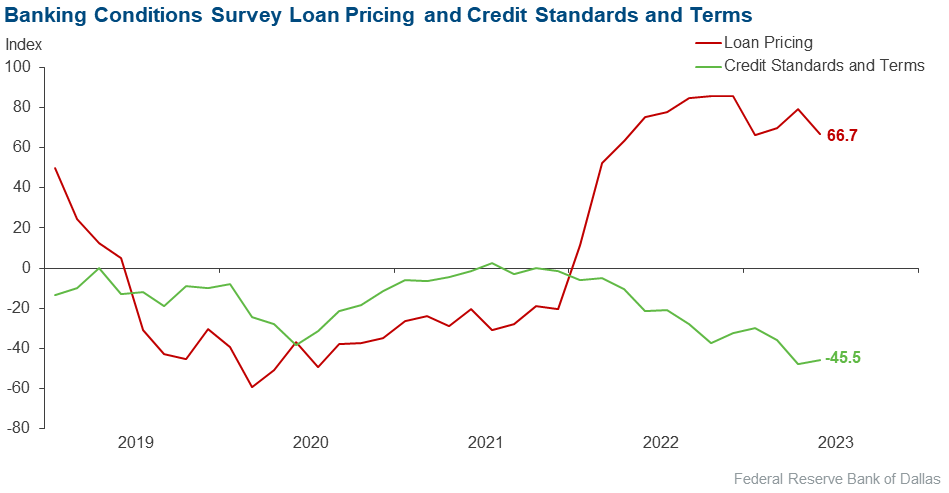
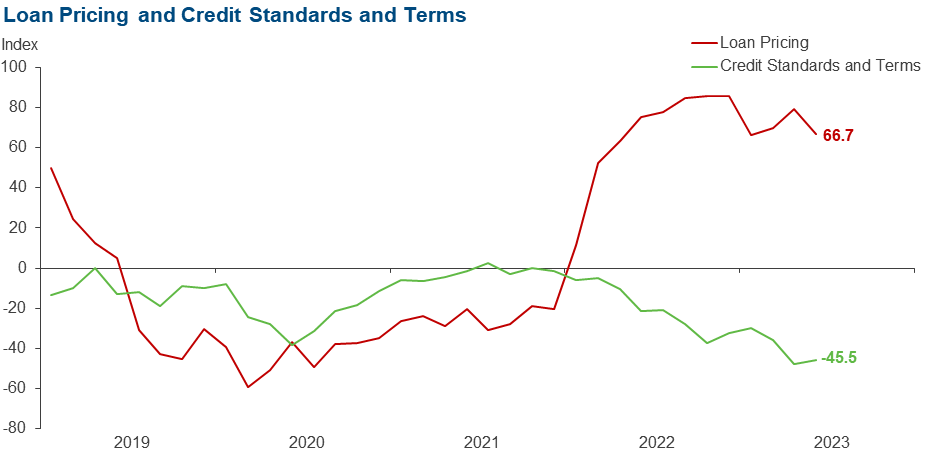
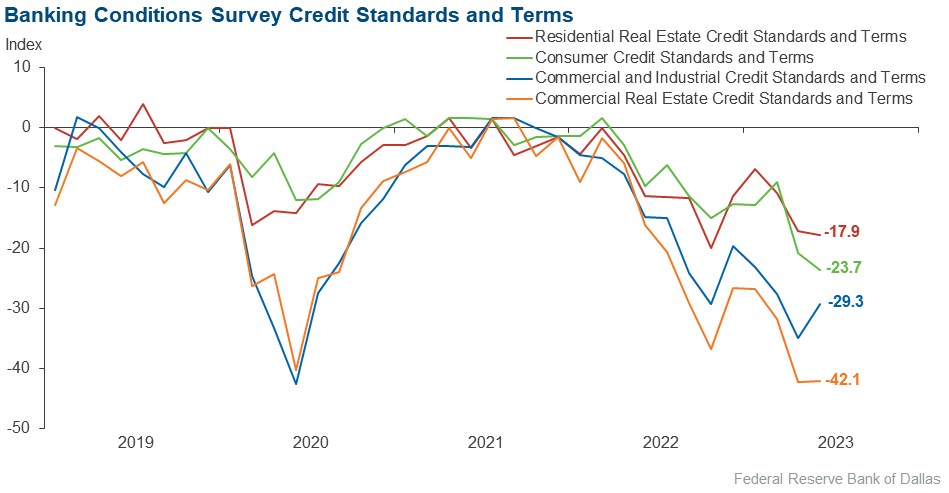
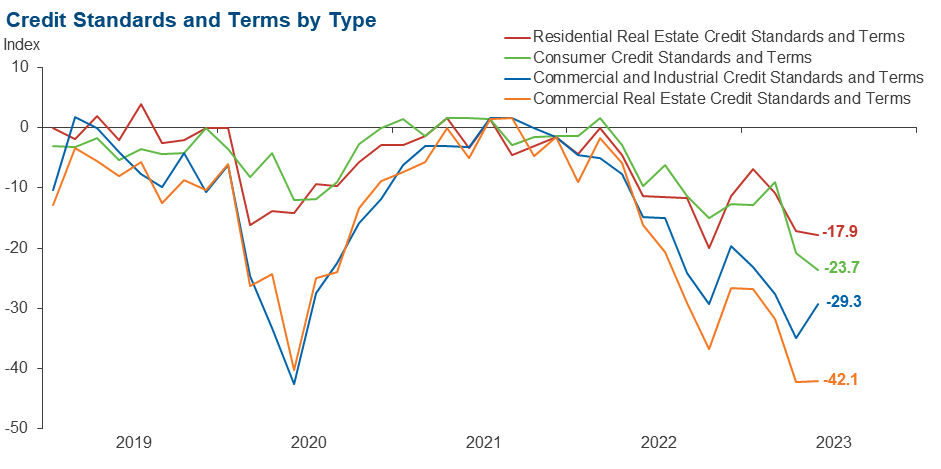
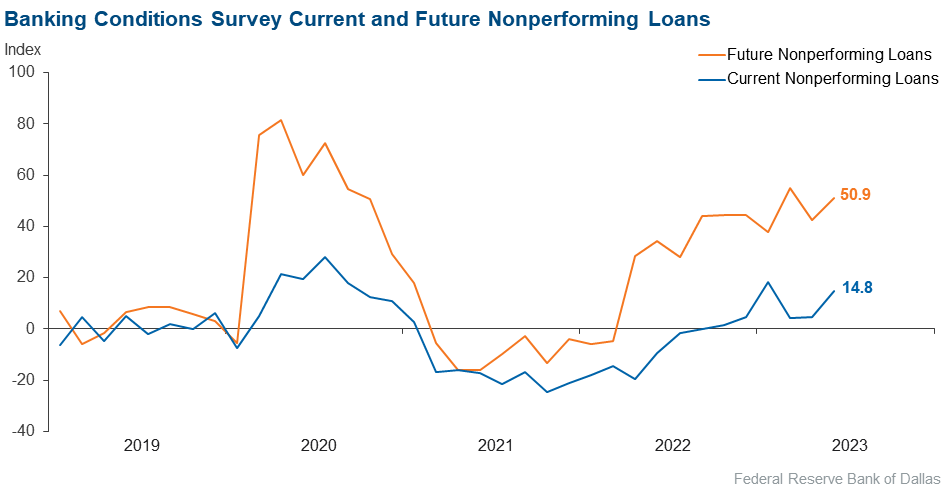
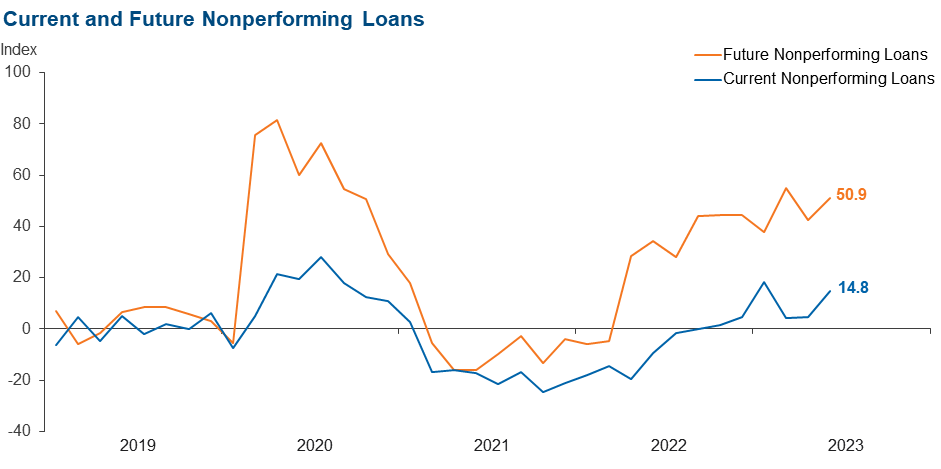
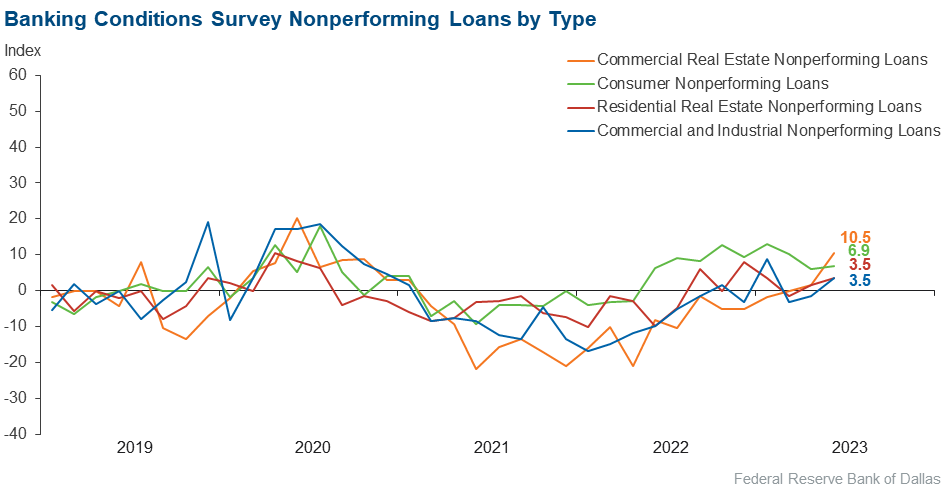
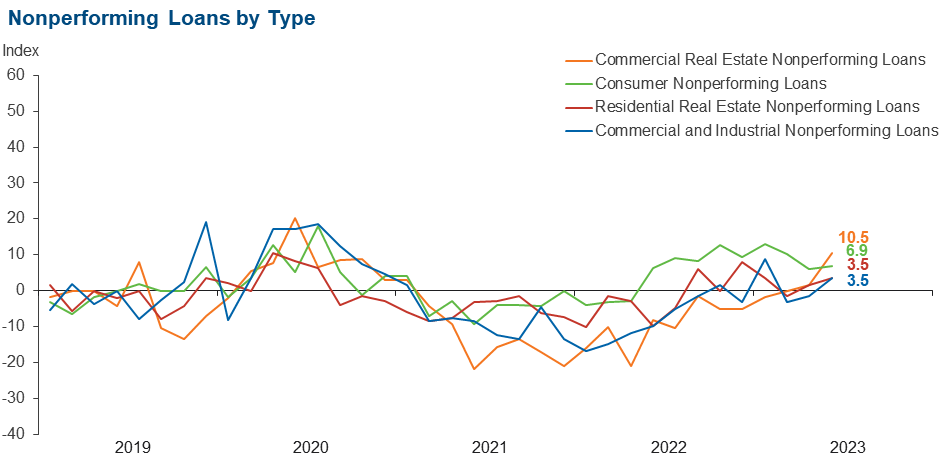
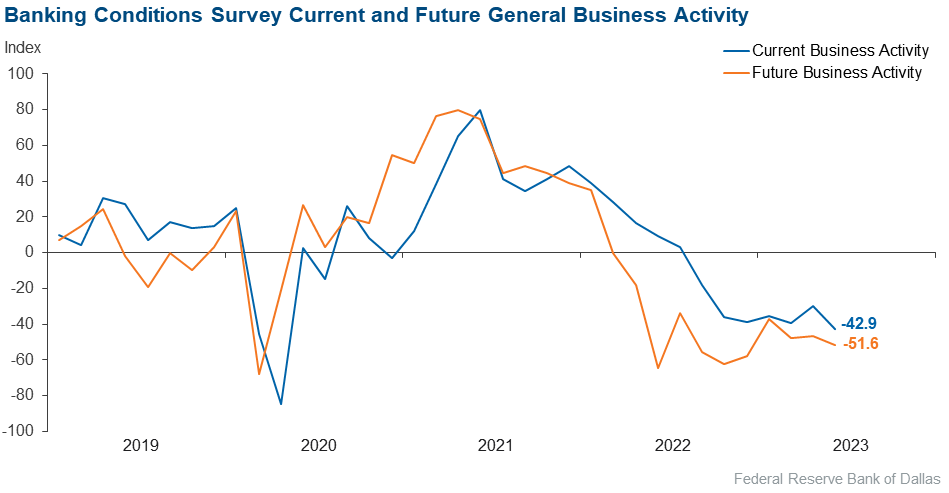
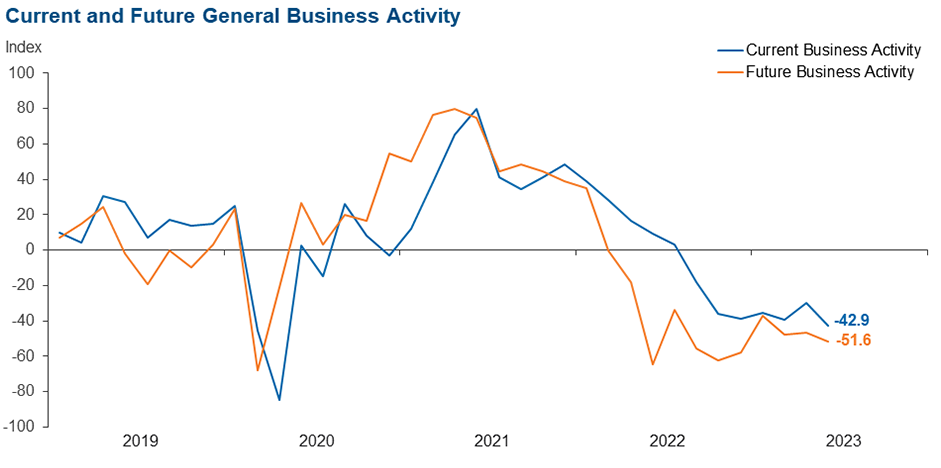
Loan demand declined for the seventh period in a row, and most bankers expect a further deterioration over the next six months. Overall loan volumes continued to fall, with particular weakness seen in consumer lending. While commercial real estate and commercial and industrial loan volumes continued to see marked volume declines, residential real estate lending remained stable. Loan nonperformance increased, with the rise led by commercial real estate loans. Credit standards and terms continued to tighten, and loan pricing continued to rise. Bankers’ outlooks remained pessimistic, with contacts expecting a further contraction in business activity and an increase in nonperforming loans over the next six months.
Next release: August 21, 2023
Data were collected June 13–21, and 63 financial institutions responded to the survey. The Federal Reserve Bank of Dallas conducts the Banking Conditions Survey twice each quarter to obtain a timely assessment of activity at banks and credit unions headquartered in the Eleventh Federal Reserve District. CEOs or senior loan officers of financial institutions report on how conditions have changed for indicators such as loan volume, nonperforming loans and loan pricing. Respondents are also asked to report on their banking outlook and their evaluation of general business activity.
Survey responses are used to calculate an index for each indicator. Each index is calculated by subtracting the percentage of respondents reporting a decrease (or tightening) from the percentage reporting an increase (or easing). When the share of respondents reporting an increase exceeds the share reporting a decrease, the index will be greater than zero, suggesting the indicator has increased over the prior reporting period. If the share of respondents reporting a decrease exceeds the share reporting an increase, the index will be below zero, suggesting the indicator has decreased over the prior reporting period. An index will be zero when the number of respondents reporting an increase is equal to the number reporting a decrease.
Results Summary
Historical data are available from March 2017.
| Total Loans: Over the past six weeks, how have the following changed? | |||||
| Indicator | Current Index | Previous Index | % Reporting Increase | % Reporting No Change | % Reporting Decrease |
Loan volume | –14.5 | –9.0 | 27.4 | 30.6 | 41.9 |
Loan demand | –47.6 | –31.8 | 9.8 | 32.8 | 57.4 |
Nonperforming loans | 14.8 | 4.5 | 23.0 | 68.9 | 8.2 |
Loan pricing | 66.7 | 79.1 | 66.7 | 33.3 | 0.0 |
| Indicator | Current Index | Previous Index | % Reporting Eased | % Reporting No Change | % Reporting Tightened |
Credit standards and terms | –45.5 | –47.5 | 0.0 | 54.5 | 45.5 |
| Commercial and Industrial Loans: Over the past six weeks, how have the following changed? | |||||
| Indicator | Current Index | Previous Index | % Reporting Increase | % Reporting No Change | % Reporting Decrease |
Loan volume | –26.7 | –23.1 | 10.0 | 53.3 | 36.7 |
Nonperforming loans | 3.5 | –1.5 | 6.9 | 89.7 | 3.4 |
| Indicator | Current Index | Previous Index | % Reporting Eased | % Reporting No Change | % Reporting Tightened |
Credit standards and terms | –29.3 | –34.9 | 0.0 | 70.7 | 29.3 |
| Commercial Real Estate Loans: Over the past six weeks, how have the following changed? | |||||
| Indicator | Current Index | Previous Index | % Reporting Increase | % Reporting No Change | % Reporting Decrease |
Loan volume | –27.2 | –18.8 | 16.9 | 39.0 | 44.1 |
Nonperforming loans | 10.5 | 1.5 | 12.3 | 86.0 | 1.8 |
| Indicator | Current Index | Previous Index | % Reporting Eased | % Reporting No Change | % Reporting Tightened |
Credit standards and terms | –42.1 | –42.2 | 0.0 | 57.9 | 42.1 |
| Residential Real Estate Loans: Over the past six weeks, how have the following changed? | |||||
| Indicator | Current Index | Previous Index | % Reporting Increase | % Reporting No Change | % Reporting Decrease |
Loan volume | 0.0 | 0.0 | 25.9 | 48.3 | 25.9 |
Nonperforming loans | 3.5 | 1.5 | 7.1 | 89.3 | 3.6 |
| Indicator | Current Index | Previous Index | % Reporting Eased | % Reporting No Change | % Reporting Tightened |
Credit standards and terms | –17.9 | –17.2 | 0.0 | 82.1 | 17.9 |
| Consumer Loans: Over the past six weeks, how have the following changed? | |||||
| Indicator | Current Index | Previous Index | % Reporting Increase | % Reporting No Change | % Reporting Decrease |
Loan volume | –27.9 | –10.5 | 8.2 | 55.7 | 36.1 |
Nonperforming loans | 6.9 | 6.1 | 15.5 | 75.9 | 8.6 |
| Indicator | Current Index | Previous Index | % Reporting Eased | % Reporting No Change | % Reporting Tightened |
Credit standards and terms | –23.7 | –20.9 | 0.0 | 76.3 | 23.7 |
| Banking Outlook: What is your expectation for the following items six months from now? | |||||
| Indicator | Current Index | Previous Index | % Reporting Increase | % Reporting No Change | % Reporting Decrease |
Total loan demand | –50.8 | –41.8 | 12.7 | 23.8 | 63.5 |
Nonperforming loans | 50.9 | 42.4 | 57.9 | 35.1 | 7.0 |
| General Business Activity: What is your evaluation of the level of activity? | |||||
| Indicator | Current Index | Previous Index | % Reporting Better | % Reporting No Change | % Reporting Worse |
Over the past six weeks | –42.9 | –29.8 | 6.3 | 44.4 | 49.2 |
Six months from now | –51.6 | –46.3 | 11.3 | 25.8 | 62.9 |
Respondents were given an opportunity to comment on any issues that may be affecting their business.
These comments are from respondents’ completed surveys and have been edited for publication.
- Net interest margin continues to be squeezed. Loan demand is soft. We are focusing on raising rates to hold deposits.
- Things are definitely slowing down. The phone is not ringing, and customers are in a wait-and-see mode. It seems as if consumers are accepting the higher mortgage interest rates, coming to the realization that the super-low rates were an anomaly and not the norm. While the higher rates are creating qualification problems, some seem to be managing.
- There is a combination of uncertainties resulting in a challenging market dynamic (interest rates, overall business environment, credit quality and demand). In addition, increasing regulatory burden from federal agencies and higher compensation costs are leading to tightening margins.
- Our concerns are increased government regulation, inflation, staffing and market uncertainty.
Historical data can be downloaded dating back to March 2017. For the definitions, see data definitions.
NOTE: The following series were discontinued in May 2020: volume of core deposits, cost of funds, non-interest income and net interest margin.
Questions regarding the Banking Conditions Survey can be addressed to Emily Kerr at emily.kerr@dal.frb.org.
Sign up for our email alert to be automatically notified as soon as the latest Banking Conditions Survey is released on the web.