Banking Conditions Survey

For this survey, Eleventh District banking executives were asked supplemental questions about their outlook concerns, deposits, commercial real estate lending, and lending standards. Read the special questions results.
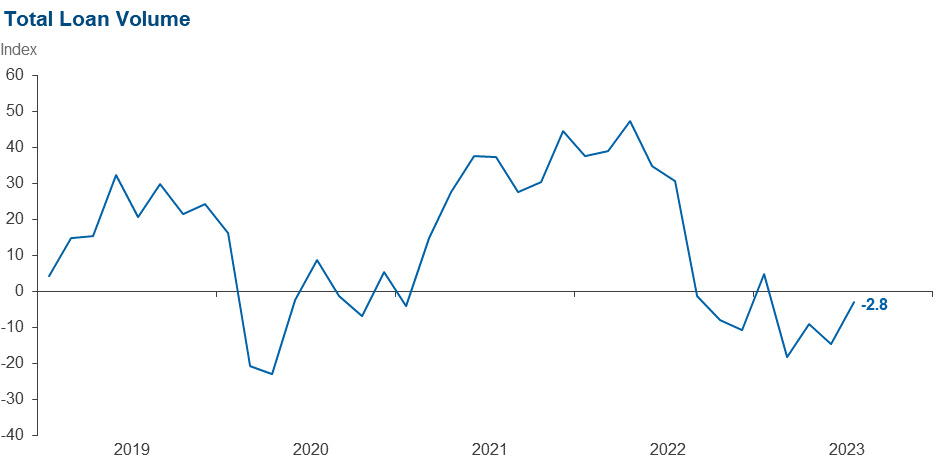
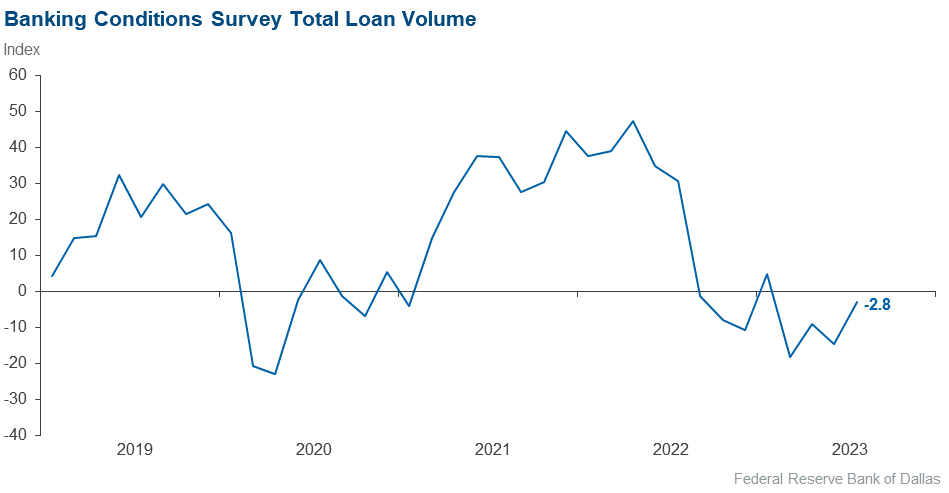
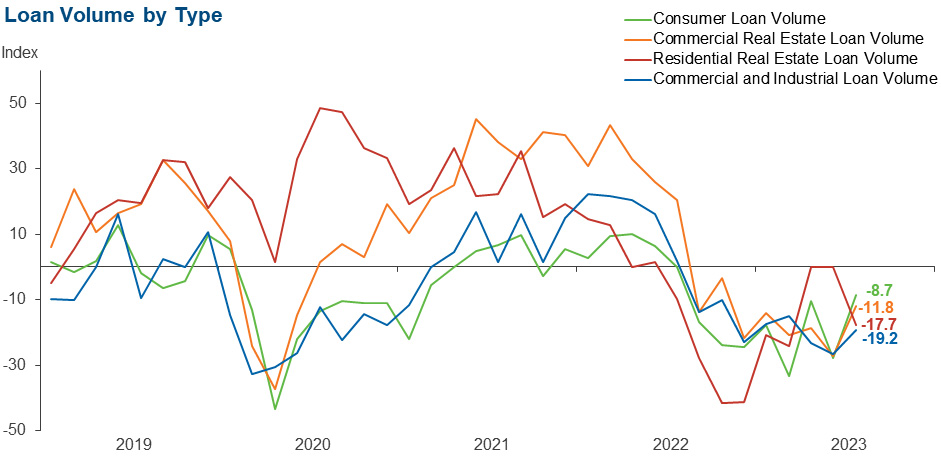
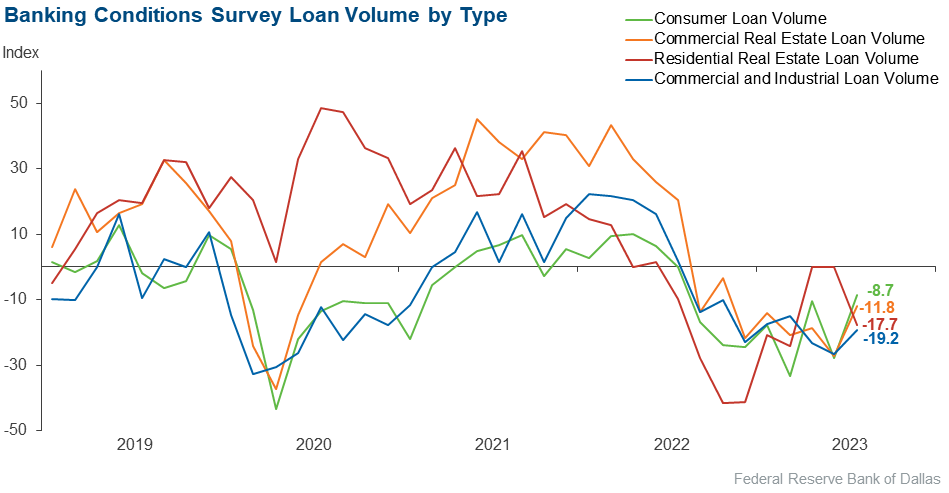
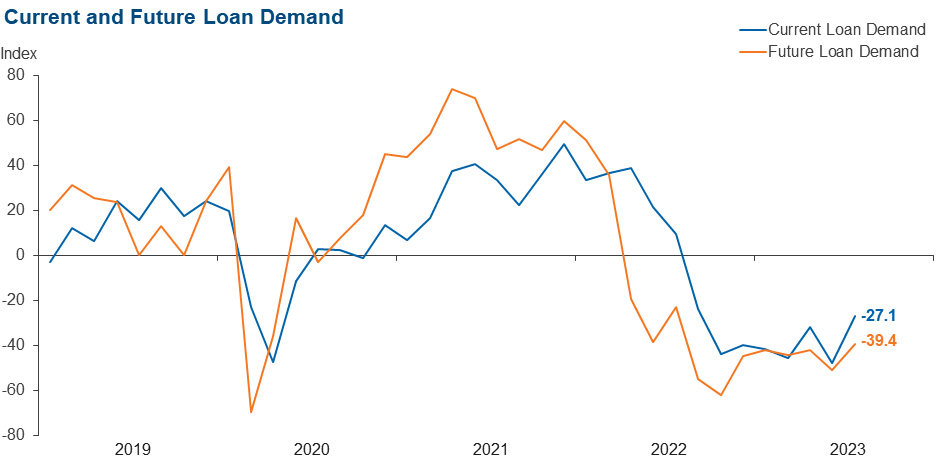
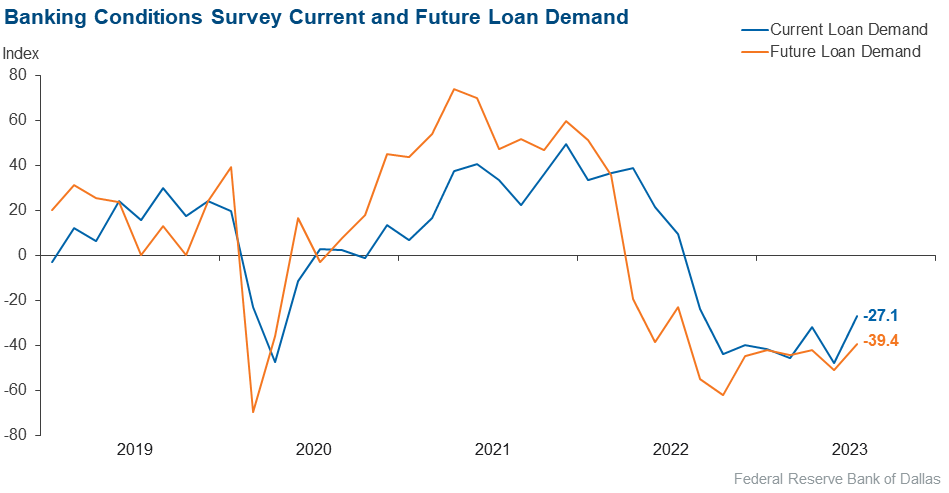
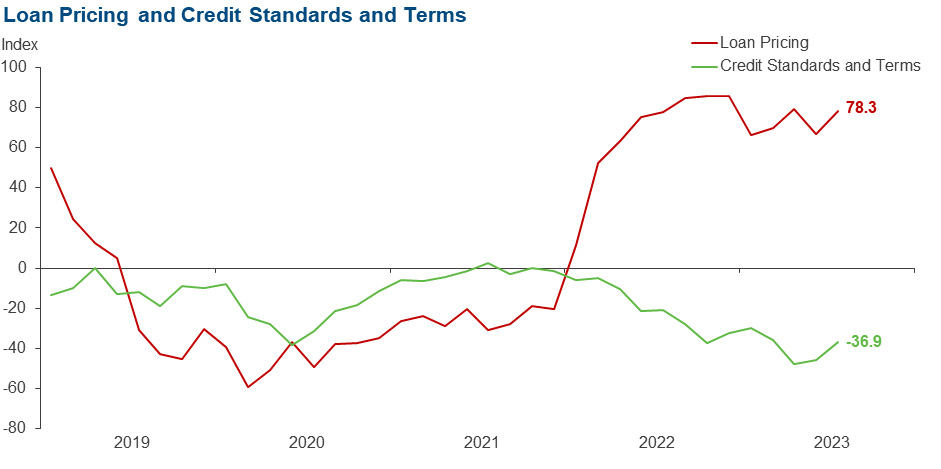
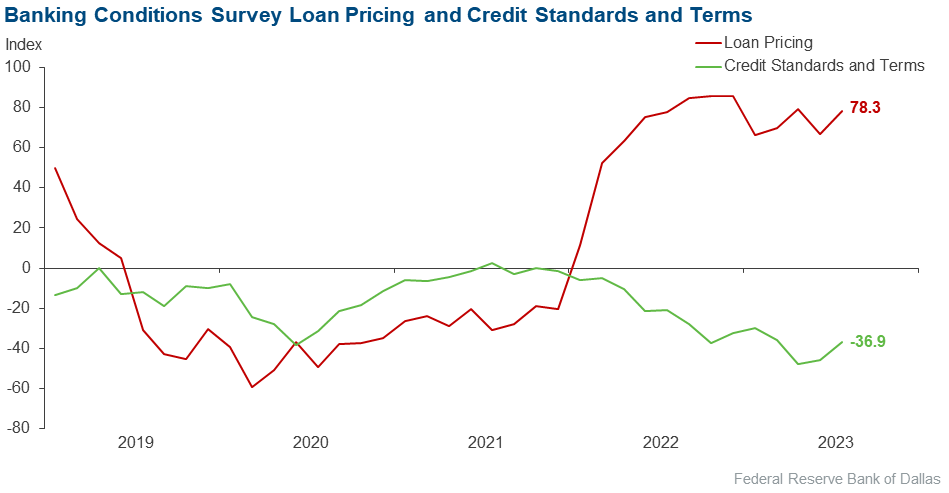
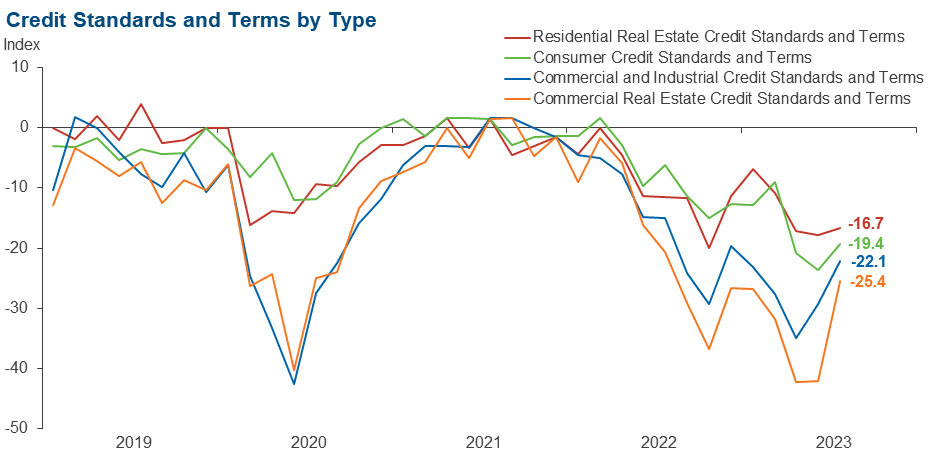
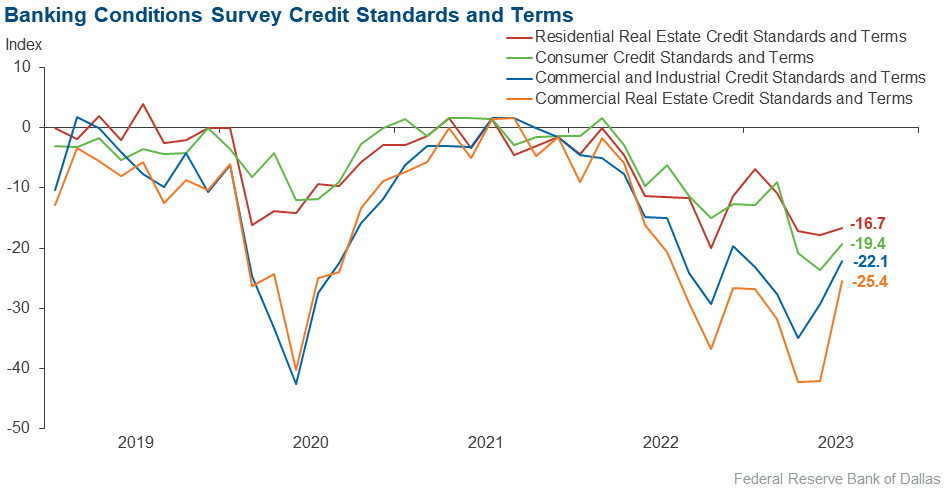
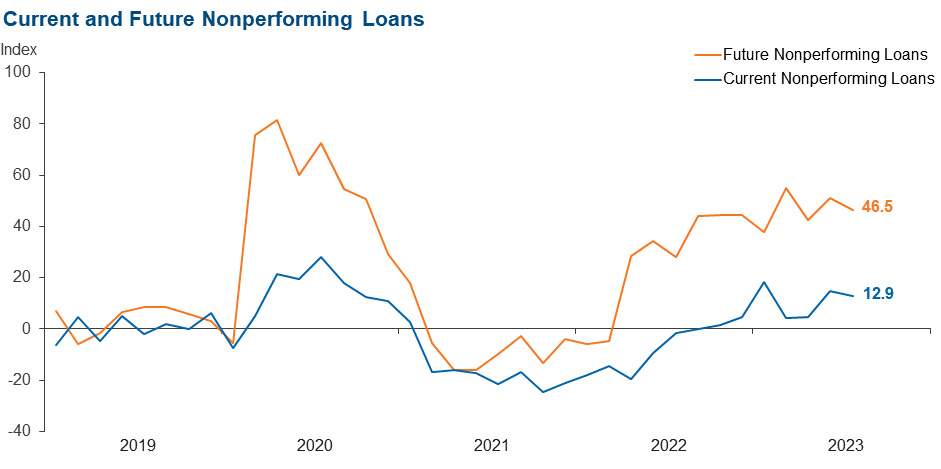
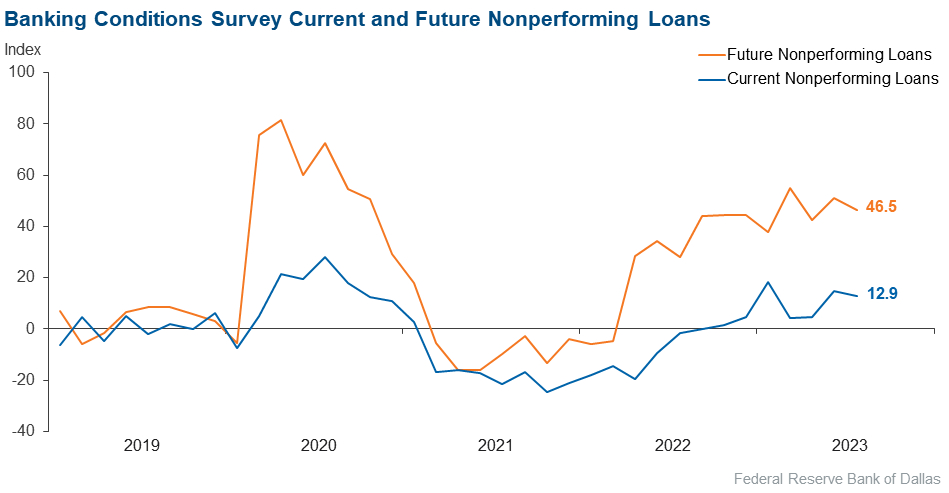
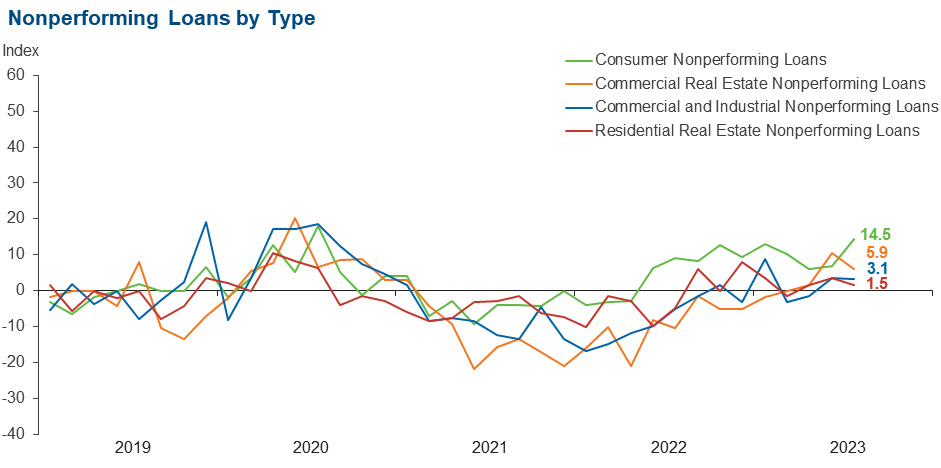
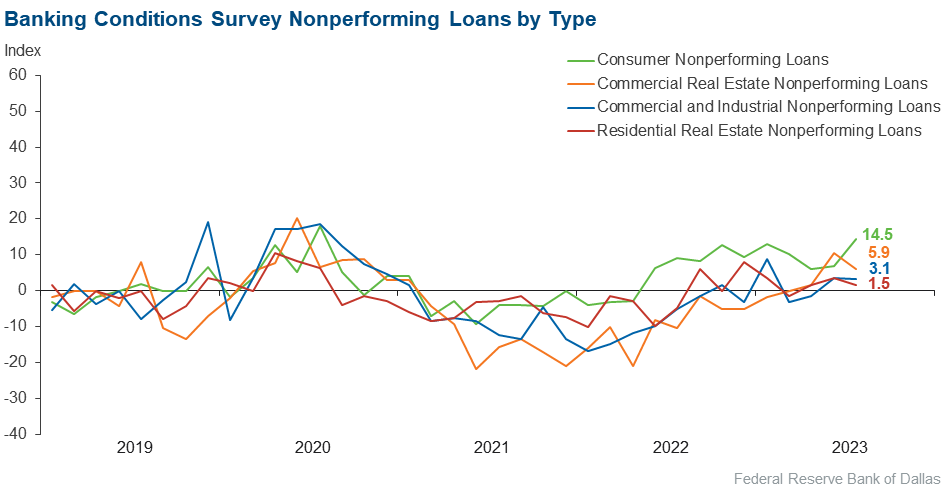
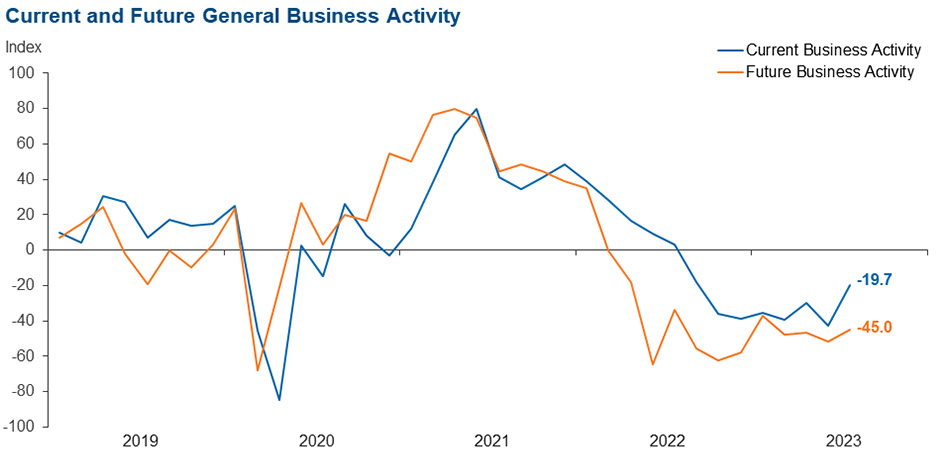
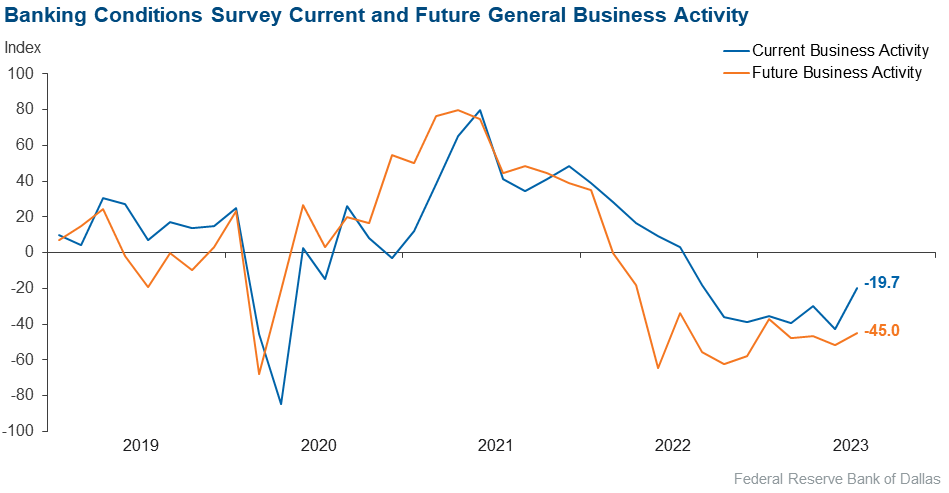
Loan demand declined for the eighth period in a row—now a full year—though the rate of decline eased somewhat. The decline in overall loan volume also decelerated, but residential real estate loan volume posted a sharp decline after stabilizing in May and June. Loan nonperformance continued to increase, with an acceleration seen in consumer loans. Loan pricing pushed up further. Credit standards continued to tighten, though the share of bankers reporting a tightening fell to its lowest level since February. Bankers’ outlooks remained pessimistic, with most expecting a decrease in loan demand and a deterioration of general business activity over the next six months.
Next release: October 2, 2023
Data were collected August 8–16, and 71 financial institutions responded to the survey. The Federal Reserve Bank of Dallas conducts the Banking Conditions Survey twice each quarter to obtain a timely assessment of activity at banks and credit unions headquartered in the Eleventh Federal Reserve District. CEOs or senior loan officers of financial institutions report on how conditions have changed for indicators such as loan volume, nonperforming loans and loan pricing. Respondents are also asked to report on their banking outlook and their evaluation of general business activity.
Survey responses are used to calculate an index for each indicator. Each index is calculated by subtracting the percentage of respondents reporting a decrease (or tightening) from the percentage reporting an increase (or easing). When the share of respondents reporting an increase exceeds the share reporting a decrease, the index will be greater than zero, suggesting the indicator has increased over the prior reporting period. If the share of respondents reporting a decrease exceeds the share reporting an increase, the index will be below zero, suggesting the indicator has decreased over the prior reporting period. An index will be zero when the number of respondents reporting an increase is equal to the number reporting a decrease.
Results Summary
Historical data are available from March 2017.
| Total Loans: Over the past six weeks, how have the following changed? | |||||
| Indicator | Current Index | Previous Index | % Reporting Increase | % Reporting No Change | % Reporting Decrease |
Loan volume | –2.8 | –14.5 | 32.9 | 31.4 | 35.7 |
Loan demand | –27.1 | –47.6 | 22.9 | 27.1 | 50.0 |
Nonperforming loans | 12.9 | 14.8 | 22.9 | 67.1 | 10.0 |
Loan pricing | 78.3 | 66.7 | 79.7 | 18.8 | 1.4 |
| Indicator | Current Index | Previous Index | % Reporting Eased | % Reporting No Change | % Reporting Tightened |
Credit standards and terms | –36.9 | –45.5 | 0.0 | 63.1 | 36.9 |
| Commercial and Industrial Loans: Over the past six weeks, how have the following changed? | |||||
| Indicator | Current Index | Previous Index | % Reporting Increase | % Reporting No Change | % Reporting Decrease |
Loan volume | –19.2 | –26.7 | 13.2 | 54.4 | 32.4 |
Nonperforming loans | 3.1 | 3.5 | 7.6 | 87.9 | 4.5 |
| Indicator | Current Index | Previous Index | % Reporting Eased | % Reporting No Change | % Reporting Tightened |
Credit standards and terms | –22.1 | –29.3 | 0.0 | 77.9 | 22.1 |
| Commercial Real Estate Loans: Over the past six weeks, how have the following changed? | |||||
| Indicator | Current Index | Previous Index | % Reporting Increase | % Reporting No Change | % Reporting Decrease |
Loan volume | –11.8 | –27.2 | 20.6 | 47.1 | 32.4 |
Nonperforming loans | 5.9 | 10.5 | 8.8 | 88.2 | 2.9 |
| Indicator | Current Index | Previous Index | % Reporting Eased | % Reporting No Change | % Reporting Tightened |
Credit standards and terms | –25.4 | –42.1 | 1.5 | 71.6 | 26.9 |
| Residential Real Estate Loans: Over the past six weeks, how have the following changed? | |||||
| Indicator | Current Index | Previous Index | % Reporting Increase | % Reporting No Change | % Reporting Decrease |
Loan volume | –17.7 | 0.0 | 19.1 | 44.1 | 36.8 |
Nonperforming loans | 1.5 | 3.5 | 4.4 | 92.6 | 2.9 |
| Indicator | Current Index | Previous Index | % Reporting Eased | % Reporting No Change | % Reporting Tightened |
Credit standards and terms | –16.7 | –17.9 | 0.0 | 83.3 | 16.7 |
| Consumer Loans: Over the past six weeks, how have the following changed? | |||||
| Indicator | Current Index | Previous Index | % Reporting Increase | % Reporting No Change | % Reporting Decrease |
Loan volume | –8.7 | –27.9 | 20.3 | 50.7 | 29.0 |
Nonperforming loans | 14.5 | 6.9 | 17.4 | 79.7 | 2.9 |
| Indicator | Current Index | Previous Index | % Reporting Eased | % Reporting No Change | % Reporting Tightened |
Credit standards and terms | –19.4 | –23.7 | 0.0 | 80.6 | 19.4 |
| Banking Outlook: What is your expectation for the following items six months from now? | |||||
| Indicator | Current Index | Previous Index | % Reporting Increase | % Reporting No Change | % Reporting Decrease |
Total loan demand | –39.4 | –50.8 | 16.9 | 26.8 | 56.3 |
Nonperforming loans | 46.5 | 50.9 | 49.3 | 47.9 | 2.8 |
| General Business Activity: What is your evaluation of the level of activity? | |||||
| Indicator | Current Index | Previous Index | % Reporting Better | % Reporting No Change | % Reporting Worse |
Over the past six weeks | –19.7 | –42.9 | 9.9 | 60.6 | 29.6 |
Six months from now | –45.0 | –51.6 | 11.3 | 32.4 | 56.3 |
Respondents were given an opportunity to comment on any issues that may be affecting their business.
These comments are from respondents’ completed surveys and have been edited for publication.
- Utilization continues to decline, and high interest rates are starting to show up in financial statements of borrowers.
- The macro impact of the rise in interest rates will continue to restrict economic growth.
- Commercial real estate lending markets are shutting down. We are hearing from customers that many banks are telling them they are “pencils down.” There are a lot of projects under construction that need to work through the pipeline, particularly in the multifamily category.
- [An issue of concern is] borrowers' cash flow stress from repricing real estate balloon loans at significantly higher rates.
- Competition for deposits is fierce. Customer relationships are being tested by high rates offered from out-of-market institutions. We continue to see consumers steadily spend down their deposit account balances for various reasons.
- Nonmaturity deposit runoff is persisting longer than expected. Competition for deposits is very strong.
- Commercial clients are pulling back due to increased uncertainty and focus on cost structures/efficiency. Interest expense is reducing free cash flow available for investment.
- Continued increases in regulatory uncertainty and the economic outlook have created a difficult environment in which to forecast. We are seeing some areas of credit stress, particularly in the unsecured consumer space.
- [Issues of concern are] policy decisions coming out of Washington, high interest rates, borrowers becoming overextended, concerns with commercial real estate throughout the country, 2024 election politics to become nastier, U.S./China relations and the Russia–Ukraine war.
- We are concerned about an increase in regulatory burden.
- Leading economic indicators are materially worsening alongside meaningfully restrictive monetary policy, which will likely lead to an overcorrection to the downside across markets and the economy.
Historical data can be downloaded dating back to March 2017. For the definitions, see data definitions.
NOTE: The following series were discontinued in May 2020: volume of core deposits, cost of funds, non-interest income and net interest margin.
Questions regarding the Banking Conditions Survey can be addressed to Emily Kerr at emily.kerr@dal.frb.org.
Sign up for our email alert to be automatically notified as soon as the latest Banking Conditions Survey is released on the web.