Banking Conditions Survey

For this survey, Eleventh District banking executives were asked supplemental questions on deposits, credit standards, loan downgrades and loan pricing. Read the special questions results.
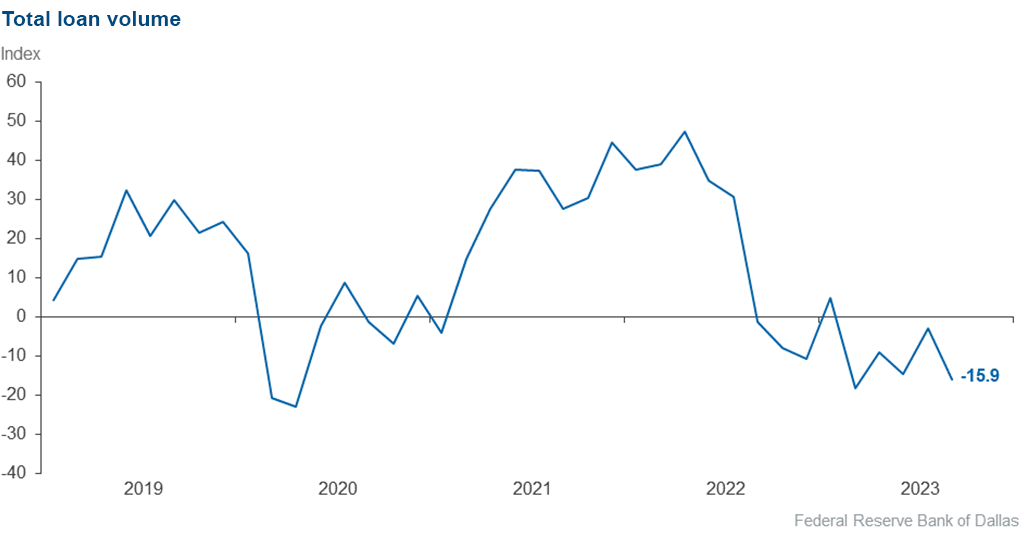
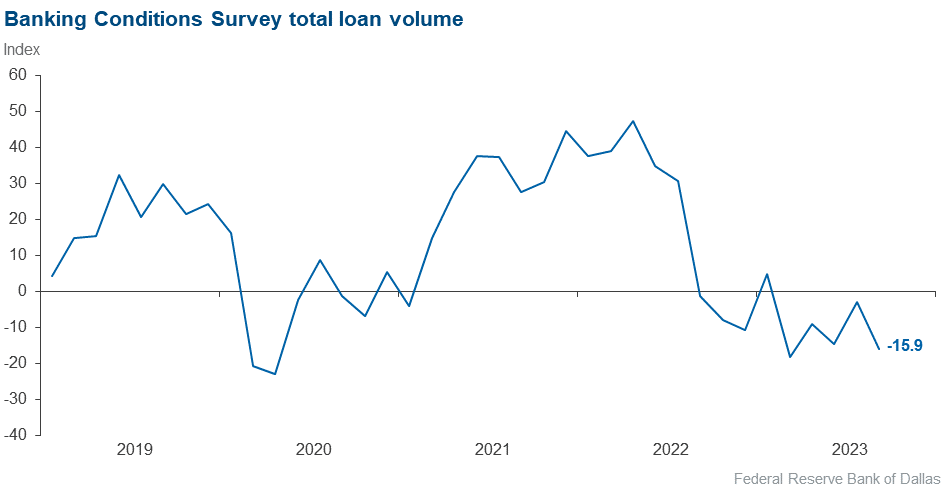
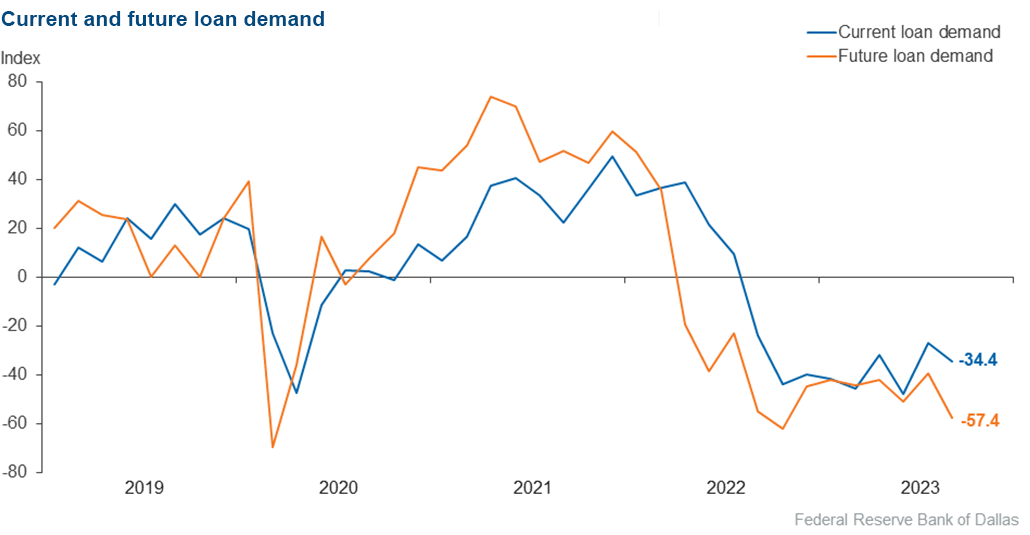
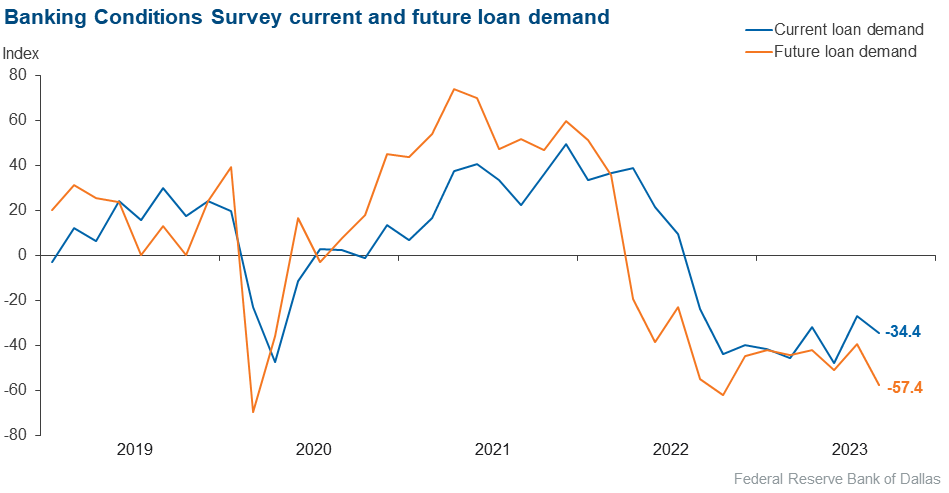
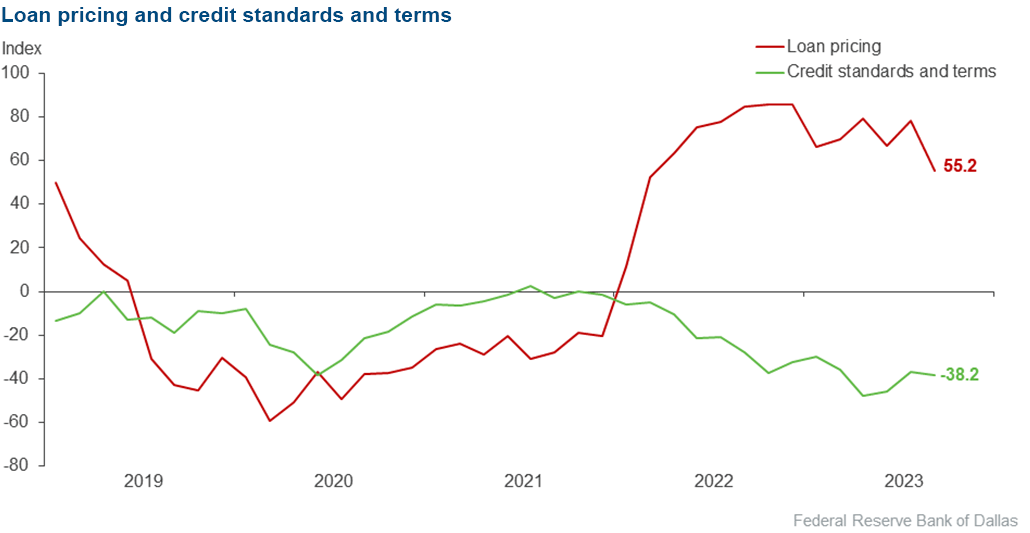
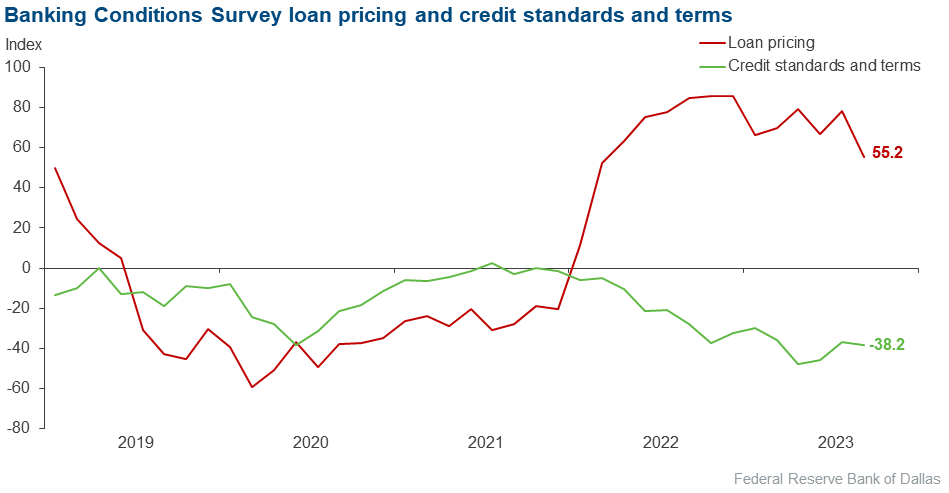
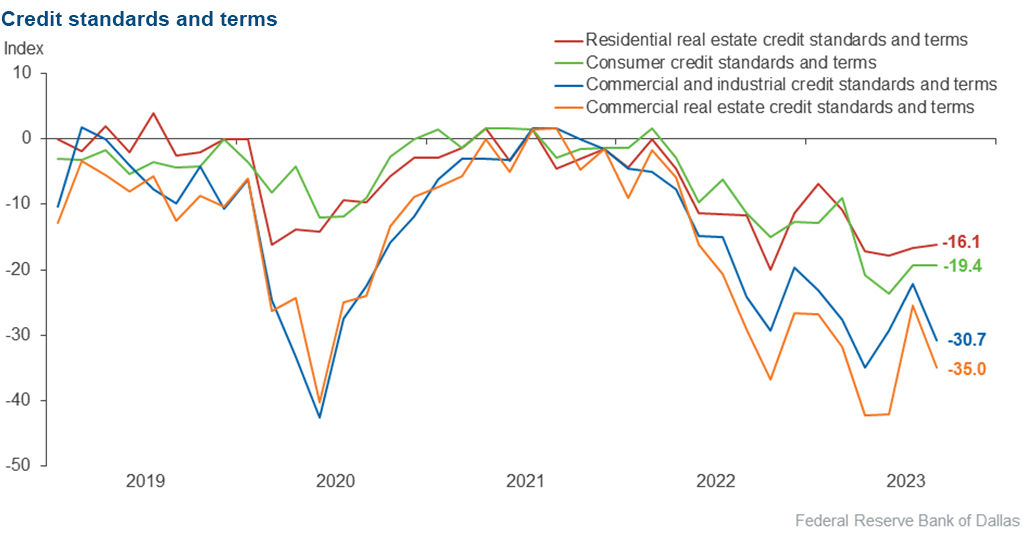
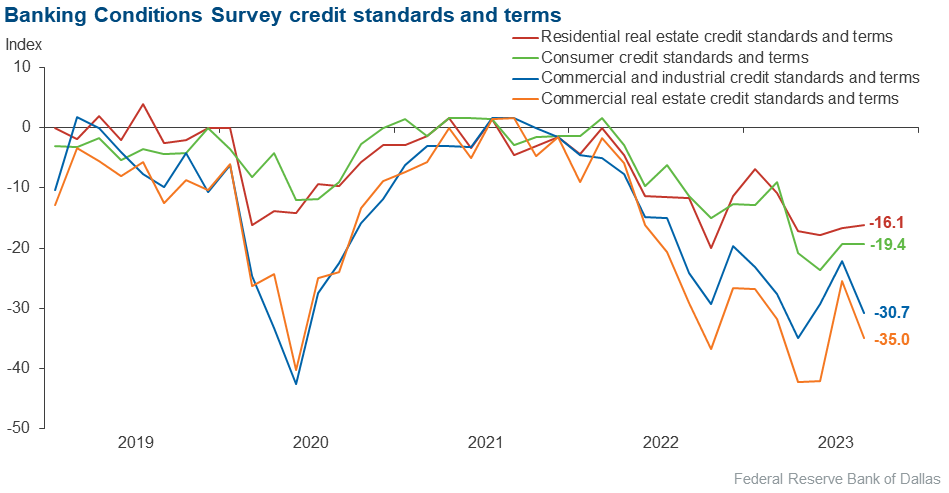
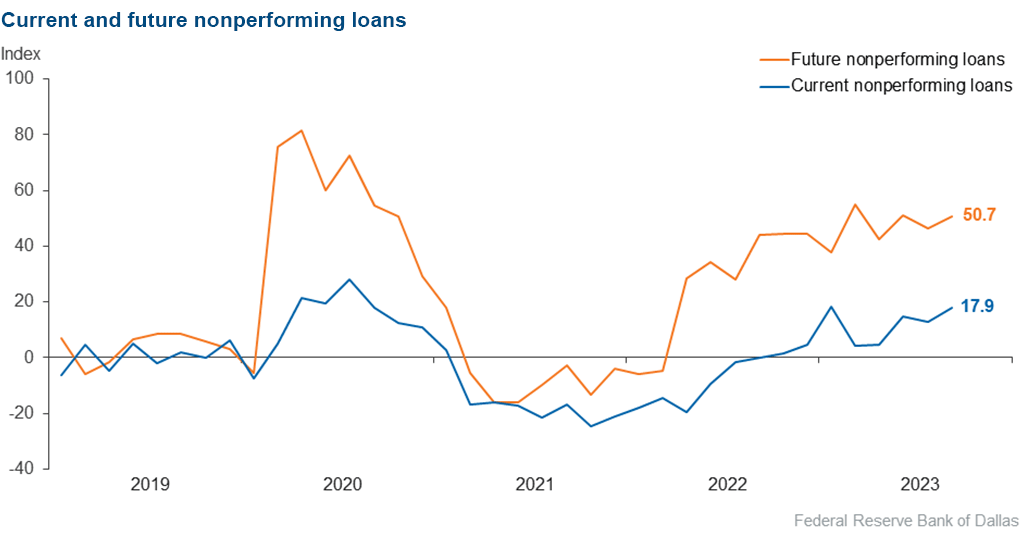
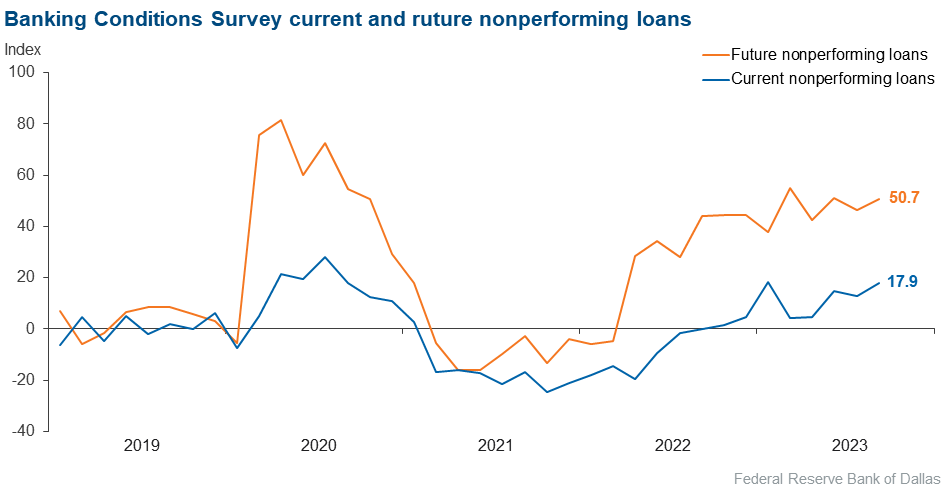
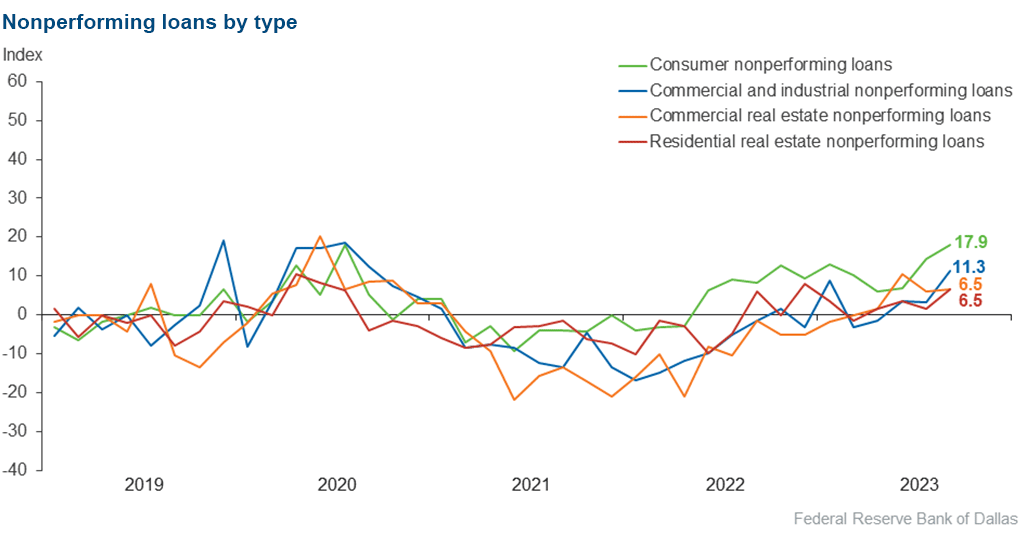
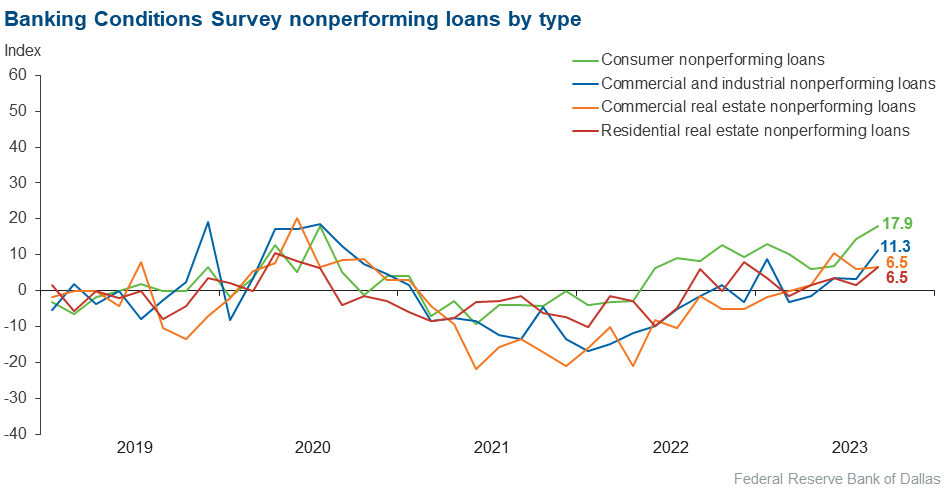
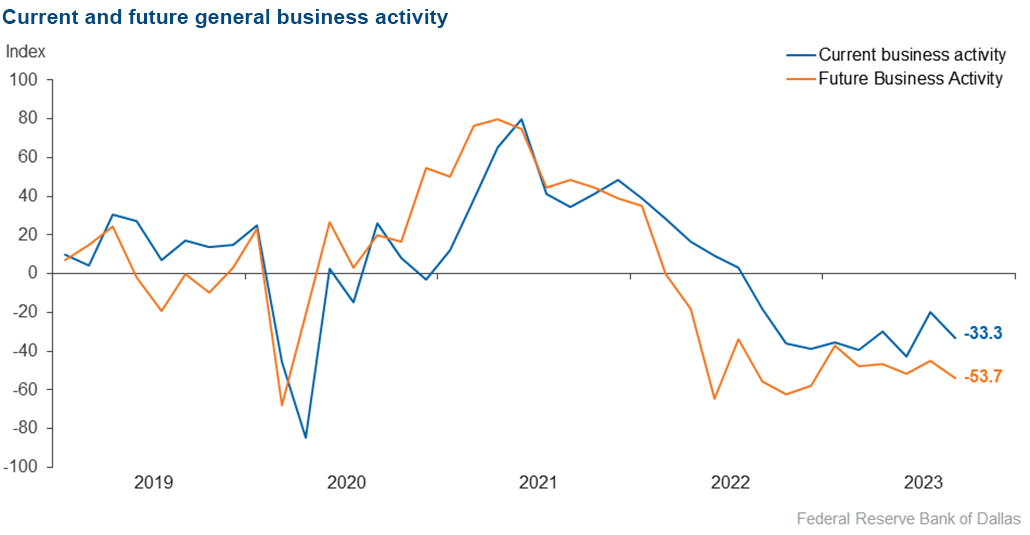
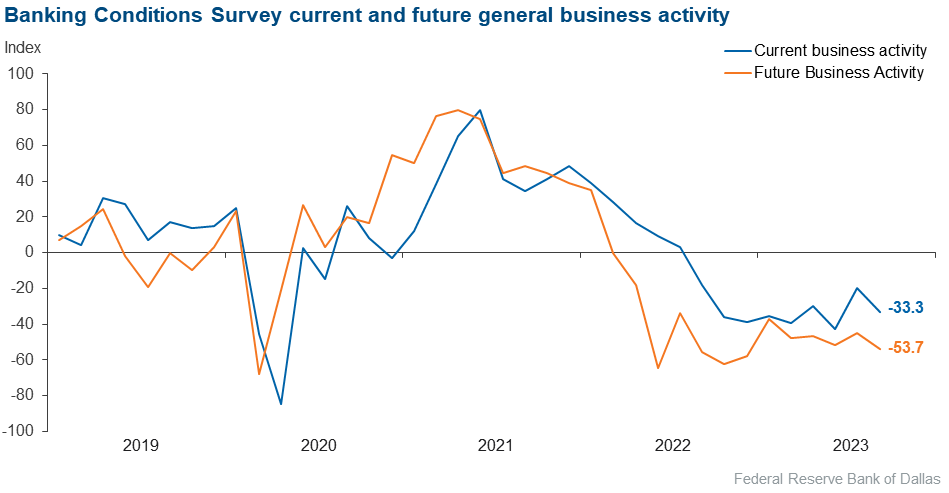
Loan demand has been declining for a year, and the pace accelerated this period. Overall loan volumes declined at a quicker pace this period as well. Loan nonperformance rose, with increased delinquency across the board, particularly for consumer loans. Credit standards continued to tighten, most notably on the commercial side. Loan pricing pushed up further, though at the slowest rate so far this year. Bankers remain pessimistic, with expectations for increasing loan nonperformance, decreasing loan demand and worsening business activity over the next six months.
Next release: November 13, 2023
Data were collected September 19–27, and 69 financial institutions responded to the survey. The Federal Reserve Bank of Dallas conducts the Banking Conditions Survey twice each quarter to obtain a timely assessment of activity at banks and credit unions headquartered in the Eleventh Federal Reserve District. CEOs or senior loan officers of financial institutions report on how conditions have changed for indicators such as loan volume, nonperforming loans and loan pricing. Respondents are also asked to report on their banking outlook and their evaluation of general business activity.
Survey responses are used to calculate an index for each indicator. Each index is calculated by subtracting the percentage of respondents reporting a decrease (or tightening) from the percentage reporting an increase (or easing). When the share of respondents reporting an increase exceeds the share reporting a decrease, the index will be greater than zero, suggesting the indicator has increased over the prior reporting period. If the share of respondents reporting a decrease exceeds the share reporting an increase, the index will be below zero, suggesting the indicator has decreased over the prior reporting period. An index will be zero when the number of respondents reporting an increase is equal to the number reporting a decrease.
Results Summary
Historical data are available from March 2017.
| Total Loans: Over the past six weeks, how have the following changed? | |||||
| Indicator | Current Index | Previous Index | % Reporting Increase | % Reporting No Change | % Reporting Decrease |
Loan volume | –15.9 | –2.8 | 26.1 | 31.9 | 42.0 |
Loan demand | –34.4 | –27.1 | 14.9 | 35.8 | 49.3 |
Nonperforming loans | 17.9 | 12.9 | 23.9 | 70.1 | 6.0 |
Loan pricing | 55.2 | 78.3 | 56.7 | 41.8 | 1.5 |
| Indicator | Current Index | Previous Index | % Reporting Eased | % Reporting No Change | % Reporting Tightened |
Credit standards and terms | –38.2 | –36.9 | 0.0 | 61.8 | 38.2 |
| Commercial and Industrial Loans: Over the past six weeks, how have the following changed? | |||||
| Indicator | Current Index | Previous Index | % Reporting Increase | % Reporting No Change | % Reporting Decrease |
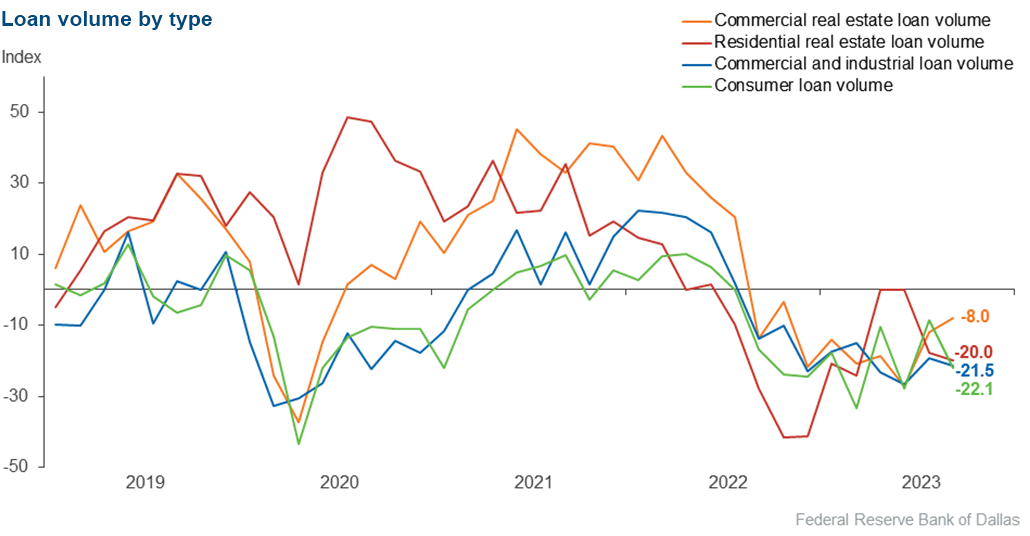
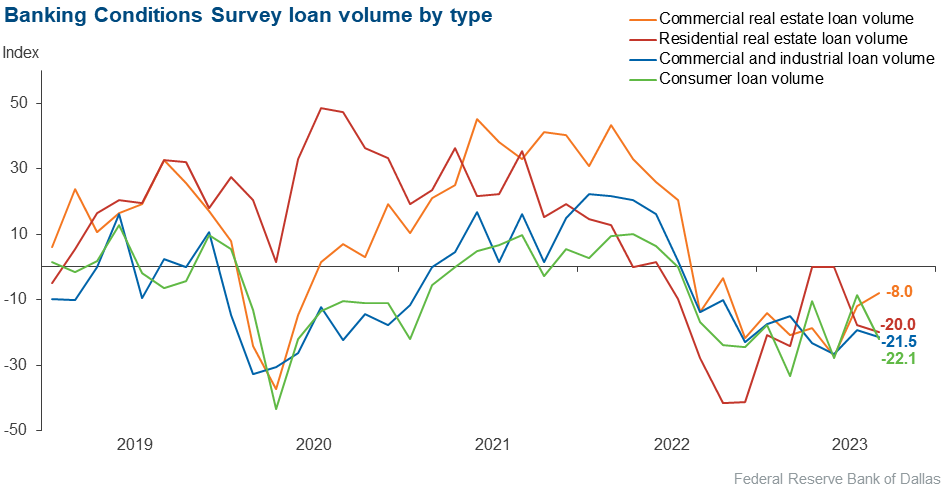
Loan volume | –21.5 | –19.2 | 6.2 | 66.2 | 27.7 |
Nonperforming loans | 11.3 | 3.1 | 16.1 | 79.0 | 4.8 |
| Indicator | Current Index | Previous Index | % Reporting Eased | % Reporting No Change | % Reporting Tightened |
Credit standards and terms | –30.7 | –22.1 | 1.6 | 66.1 | 32.3 |
| Commercial Real Estate Loans: Over the past six weeks, how have the following changed? | |||||
| Indicator | Current Index | Previous Index | % Reporting Increase | % Reporting No Change | % Reporting Decrease |
Loan volume | –8.0 | –11.8 | 19.0 | 54.0 | 27.0 |
Nonperforming loans | 6.5 | 5.9 | 9.7 | 87.1 | 3.2 |
| Indicator | Current Index | Previous Index | % Reporting Eased | % Reporting No Change | % Reporting Tightened |
Credit standards and terms | –35.0 | –25.4 | 1.7 | 61.7 | 36.7 |
| Residential Real Estate Loans: Over the past six weeks, how have the following changed? | |||||
| Indicator | Current Index | Previous Index | % Reporting Increase | % Reporting No Change | % Reporting Decrease |
Loan volume | –20.0 | –17.7 | 20.0 | 40.0 | 40.0 |
Nonperforming loans | 6.5 | 1.5 | 8.1 | 90.3 | 1.6 |
| Indicator | Current Index | Previous Index | % Reporting Eased | % Reporting No Change | % Reporting Tightened |
Credit standards and terms | –16.1 | –16.7 | 0.0 | 83.9 | 16.1 |
| Consumer Loans: Over the past six weeks, how have the following changed? | |||||
| Indicator | Current Index | Previous Index | % Reporting Increase | % Reporting No Change | % Reporting Decrease |
Loan volume | –22.1 | –8.7 | 13.2 | 51.5 | 35.3 |
Nonperforming loans | 17.9 | 14.5 | 19.4 | 79.1 | 1.5 |
| Indicator | Current Index | Previous Index | % Reporting Eased | % Reporting No Change | % Reporting Tightened |
Credit standards and terms | –19.4 | –19.4 | 0.0 | 80.6 | 19.4 |
| Banking Outlook: What is your expectation for the following items six months from now? | |||||
| Indicator | Current Index | Previous Index | % Reporting Increase | % Reporting No Change | % Reporting Decrease |
Total loan demand | –57.4 | –39.4 | 8.8 | 25.0 | 66.2 |
Nonperforming loans | 50.7 | 46.5 | 50.7 | 49.3 | 0.0 |
| General Business Activity: What is your evaluation of the level of activity? | |||||
| Indicator | Current Index | Previous Index | % Reporting Better | % Reporting No Change | % Reporting Worse |
Over the past six weeks | –33.3 | –19.7 | 8.7 | 49.3 | 42.0 |
Six months from now | –53.7 | –45.0 | 10.1 | 26.1 | 63.8 |
Respondents were given an opportunity to comment on any issues that may be affecting their business.
These comments are from respondents’ completed surveys and have been edited for publication.
- Negative macro effects of increasing interest rates [are an issue of concern].
- We are still expecting the higher-for-longer rate scenario to result in economic weakness for the next one-to-two quarters. Loan demand tends to be soft in election years, so this may push economic weakness out another quarter or two.
- We have seen an increase in farm and ranchland loans.
- Funding costs remain elevated and continue to compress margins. We are seeing a slow, steady decline in core customer deposit balances.
- High rates for borrowers are slowing down loan activity, and rising loan losses and the high cost of funds [are issues of concern].
- Leading economic indicators are worsening against a tightening in monetary policy.
Historical data can be downloaded dating back to March 2017. For the definitions, see data definitions.
NOTE: The following series were discontinued in May 2020: volume of core deposits, cost of funds, non-interest income and net interest margin.
Questions regarding the Banking Conditions Survey can be addressed to Emily Kerr at emily.kerr@dal.frb.org.
Sign up for our email alert to be automatically notified as soon as the latest Banking Conditions Survey is released on the web.