Banking Conditions Survey

For this survey, Eleventh District banking executives were asked supplemental questions on outlook concerns and commercial real estate lending. Read the special questions results.
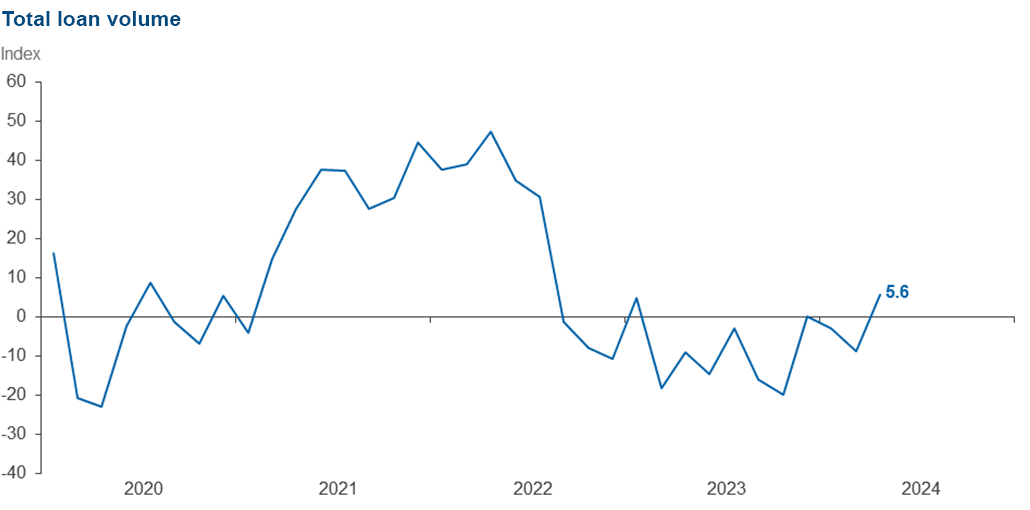
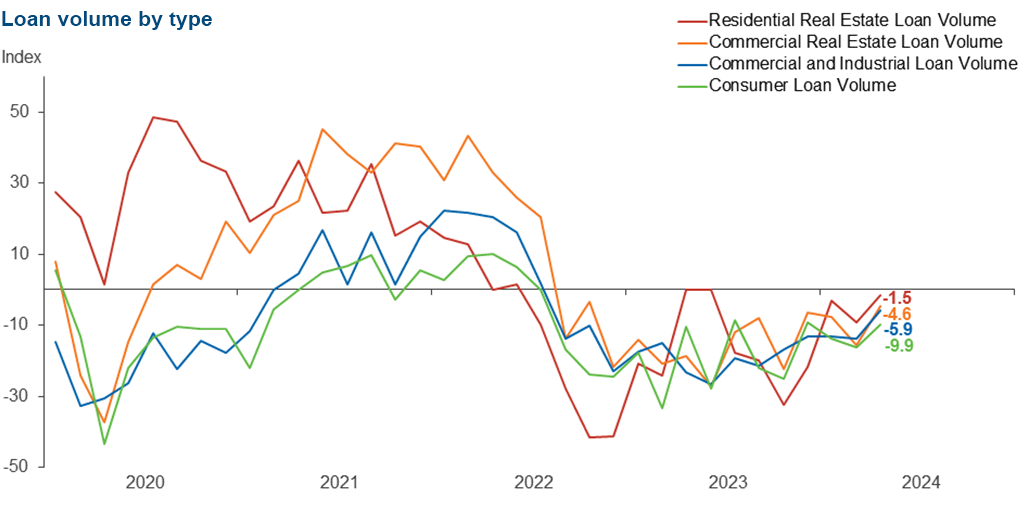
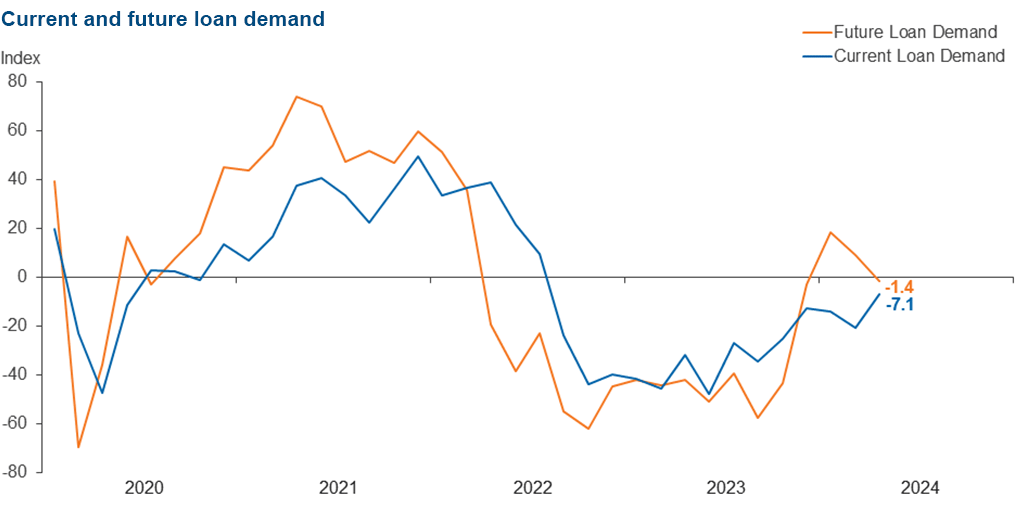
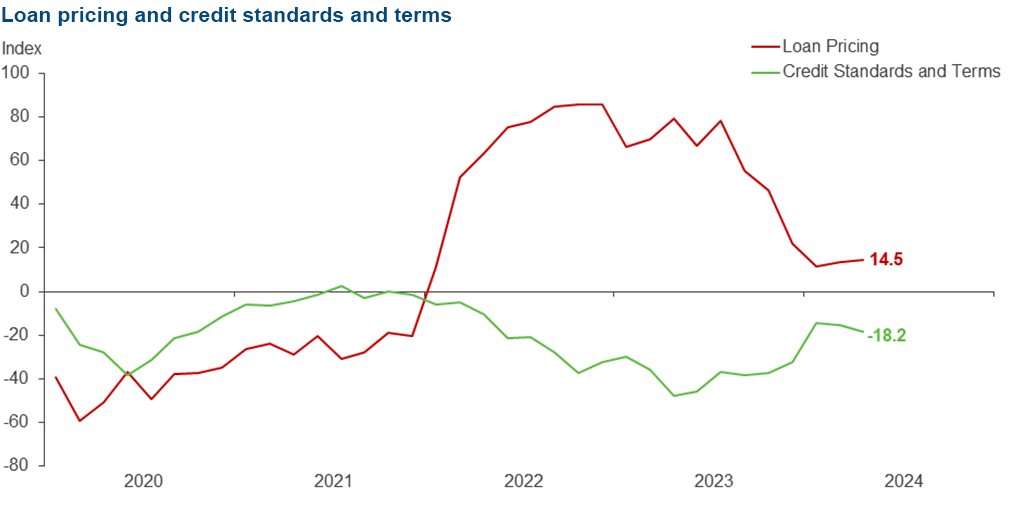
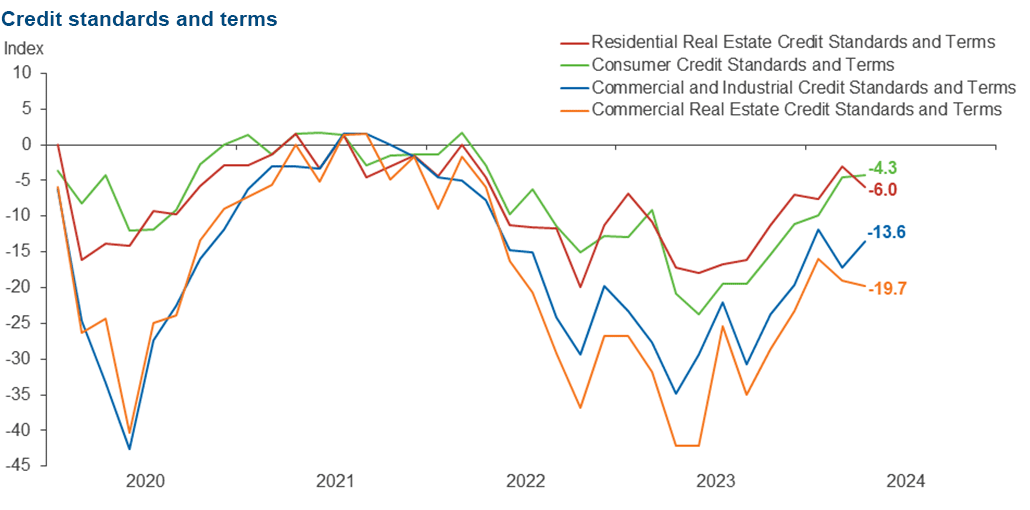
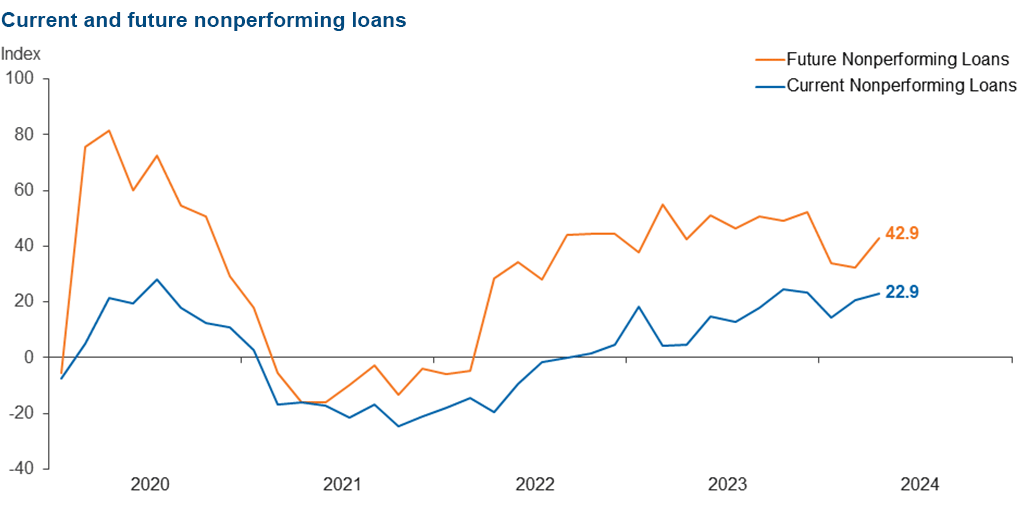
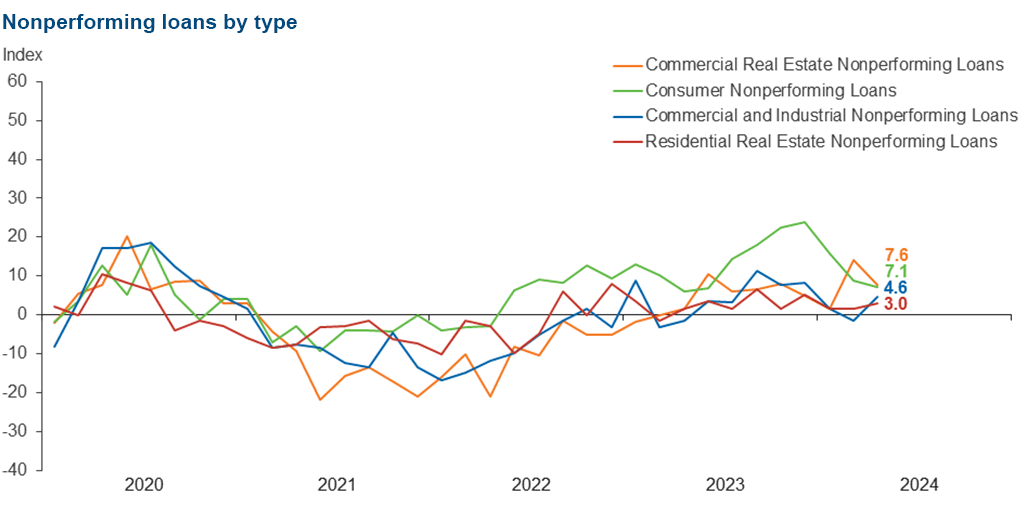
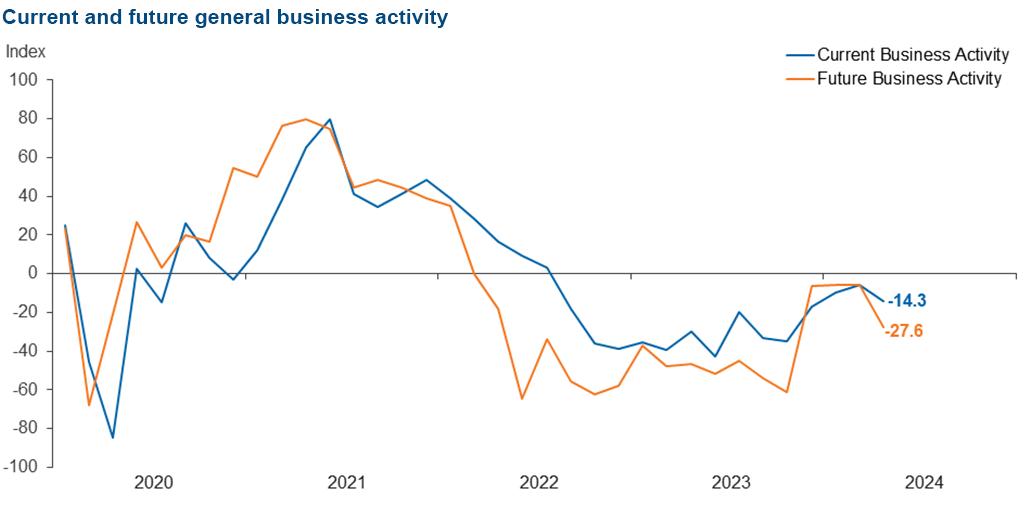
Loan volumes grew for the first time in over a year despite credit standards continuing to tighten, and loan pricing continuing to rise. Credit tightening accelerated for commercial and residential mortgages while it decelerated for commercial and industrial loans and consumer loans. Loan nonperformance picked up slightly overall. Bankers’ outlooks turned pessimistic: They expect a modest decrease in loan demand six months from now in addition to a deterioration in loan performance and overall business activity.
Next release: July 1, 2024
Data were collected April 30–May 8, and 71 financial institutions responded to the survey. The Federal Reserve Bank of Dallas conducts the Banking Conditions Survey twice each quarter to obtain a timely assessment of activity at banks and credit unions headquartered in the Eleventh Federal Reserve District. CEOs or senior loan officers of financial institutions report on how conditions have changed for indicators such as loan volume, nonperforming loans and loan pricing. Respondents are also asked to report on their banking outlook and their evaluation of general business activity.
Survey responses are used to calculate an index for each indicator. Each index is calculated by subtracting the percentage of respondents reporting a decrease (or tightening) from the percentage reporting an increase (or easing). When the share of respondents reporting an increase exceeds the share reporting a decrease, the index will be greater than zero, suggesting the indicator has increased over the prior reporting period. If the share of respondents reporting a decrease exceeds the share reporting an increase, the index will be below zero, suggesting the indicator has decreased over the prior reporting period. An index will be zero when the number of respondents reporting an increase is equal to the number reporting a decrease.
Results Summary
Historical data are available from March 2017.
| Total Loans: Over the past six weeks, how have the following changed? | |||||
| Indicator | Current Index | Previous Index | % Reporting Increase | % Reporting No Change | % Reporting Decrease |
Loan volume | 5.6 | –8.7 | 36.6 | 32.4 | 31.0 |
Loan demand | –7.1 | –20.6 | 24.3 | 44.3 | 31.4 |
Nonperforming loans | 22.9 | 20.6 | 28.6 | 65.7 | 5.7 |
Loan pricing | 14.5 | 13.6 | 21.7 | 71.0 | 7.2 |
| Indicator | Current Index | Previous Index | % Reporting Eased | % Reporting No Change | % Reporting Tightened |
Credit standards and terms | –18.2 | –15.4 | 0.0 | 81.8 | 18.2 |
| Commercial and Industrial Loans: Over the past six weeks, how have the following changed? | |||||
| Indicator | Current Index | Previous Index | % Reporting Increase | % Reporting No Change | % Reporting Decrease |
Loan volume | –5.9 | –13.7 | 16.2 | 61.8 | 22.1 |
Nonperforming loans | 4.6 | –1.5 | 7.6 | 89.4 | 3.0 |
| Indicator | Current Index | Previous Index | % Reporting Eased | % Reporting No Change | % Reporting Tightened |
Credit standards and terms | –13.6 | –17.2 | 0.0 | 86.4 | 13.6 |
| Commercial Real Estate Loans: Over the past six weeks, how have the following changed? | |||||
| Indicator | Current Index | Previous Index | % Reporting Increase | % Reporting No Change | % Reporting Decrease |
Loan volume | –4.6 | –15.6 | 24.2 | 47.0 | 28.8 |
Nonperforming loans | 7.6 | 14.0 | 12.1 | 83.3 | 4.5 |
| Indicator | Current Index | Previous Index | % Reporting Eased | % Reporting No Change | % Reporting Tightened |
Credit standards and terms | –19.7 | –19.0 | 1.5 | 77.3 | 21.2 |
| Residential Real Estate Loans: Over the past six weeks, how have the following changed? | |||||
| Indicator | Current Index | Previous Index | % Reporting Increase | % Reporting No Change | % Reporting Decrease |
Loan volume | –1.5 | –9.1 | 21.7 | 55.1 | 23.2 |
Nonperforming loans | 3.0 | 1.6 | 7.4 | 88.2 | 4.4 |
| Indicator | Current Index | Previous Index | % Reporting Eased | % Reporting No Change | % Reporting Tightened |
Credit standards and terms | –6.0 | –3.0 | 0.0 | 94.0 | 6.0 |
| Consumer Loans: Over the past six weeks, how have the following changed? | |||||
| Indicator | Current Index | Previous Index | % Reporting Increase | % Reporting No Change | % Reporting Decrease |
Loan volume | –9.9 | –16.1 | 18.3 | 53.5 | 28.2 |
Nonperforming loans | 7.1 | 8.8 | 12.7 | 81.7 | 5.6 |
| Indicator | Current Index | Previous Index | % Reporting Eased | % Reporting No Change | % Reporting Tightened |
Credit standards and terms | –4.3 | –4.5 | 0.0 | 95.7 | 4.3 |
| Banking Outlook: What is your expectation for the following items six months from now? | |||||
| Indicator | Current Index | Previous Index | % Reporting Increase | % Reporting No Change | % Reporting Decrease |
Total loan demand | –1.4 | 8.9 | 28.2 | 42.3 | 29.6 |
Nonperforming loans | 42.9 | 32.4 | 48.6 | 45.7 | 5.7 |
| General Business Activity: What is your evaluation of the level of activity? | |||||
| Indicator | Current Index | Previous Index | % Reporting Better | % Reporting No Change | % Reporting Worse |
Over the past six weeks | –14.3 | –5.8 | 14.3 | 57.1 | 28.6 |
Six months from now | –27.6 | –5.8 | 15.9 | 40.6 | 43.5 |
Respondents were given an opportunity to comment on any issues that may be affecting their business.
These comments are from respondents’ completed surveys and have been edited for publication.
- The higher-for-longer narrative has impacted economic prospects in a significantly negative manner.
- The Fed is focused on jobs and inflation, but the lack of action is destroying the economy. The wealthy are unfazed, but the middle and lower class are the most negatively affected. Every day I read about another major company declaring bankruptcy, more employee layoffs, more bank branch closings, and all these actions are creating more misery for all but the wealthy. The Fed needs to take the wealthy out of the equation and start lowering rates.
- Net interest margin continues to be an issue for community banks. While this will correct with time, the industry will suffer some return on equity and return on asset compression as well for 2024. We do not expect any rate decrease in 2024 and continue to monitor what was expected to be a so-called "soft landing." We think it might be a bit bumpier than first anticipated. We are preparing for a bumpy ride.
- High interest rates are impacting borrowers. Continued inflation is lessening discretionary spending. The stock market has gone up and down, so there is no assurance of consumer confidence. The recent increase in gas prices [is also negatively impacting the consumer].
- The threat of the new Community Reinvestment Act rules and the threat of the implementation of Section 1071 of Dodd Frank is a threat to our ability to service our customers.
- Regarding the question concerning future general business activity, it all depends on who wins the election.
- We have seen our first consumer bankruptcy in over 4 years. As a residential mortgage lender that escrows for property taxes and insurance, we have observed the cost of homeowners insurance policy are dramatically increasing for rural homes located outside of 24/7 fire protection areas. This is something to watch and certainly not expected by homeowners that purchased outside city limits.
- Regulations and processes to please the regulatory environment are costly and prohibitive to lending to customers.
Historical data can be downloaded dating back to March 2017. For the definitions, see data definitions.
NOTE: The following series were discontinued in May 2020: volume of core deposits, cost of funds, non-interest income and net interest margin.
Questions regarding the Banking Conditions Survey can be addressed to Mariam Yousuf at mariam.yousuf@dal.frb.org.
Sign up for our email alert to be automatically notified as soon as the latest Banking Conditions Survey is released on the web.