Banking Conditions Survey

For this survey, Eleventh District banking executives were asked supplemental questions on outlook concerns and commercial real estate lending. Read the special questions results.
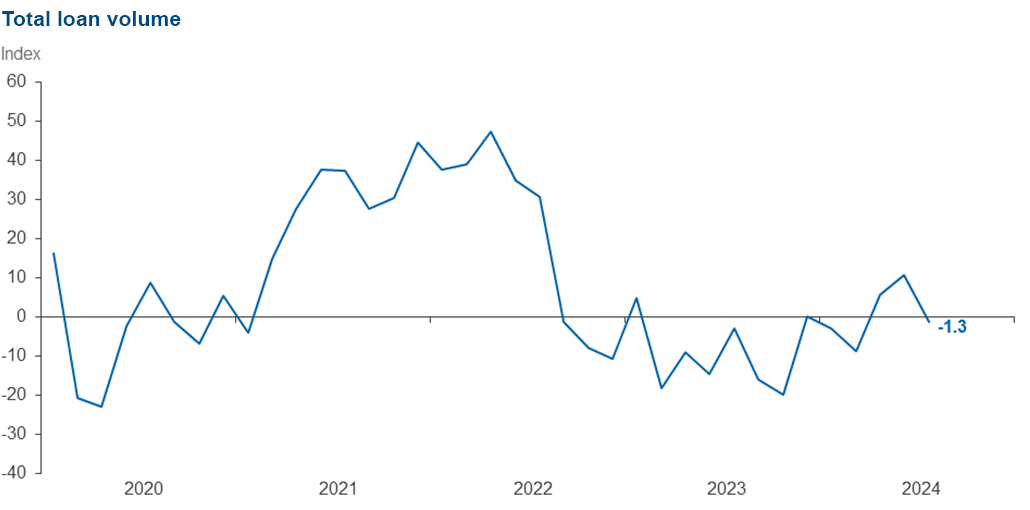
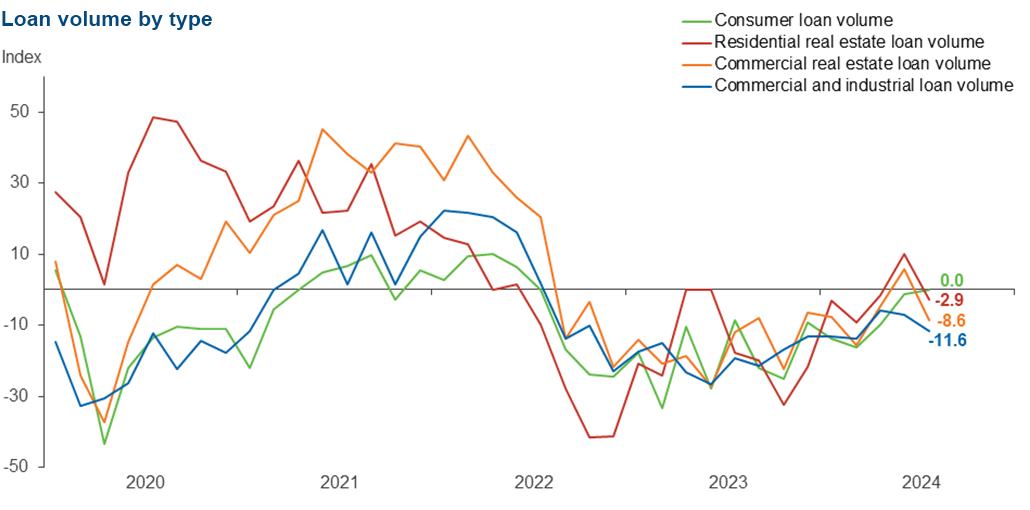
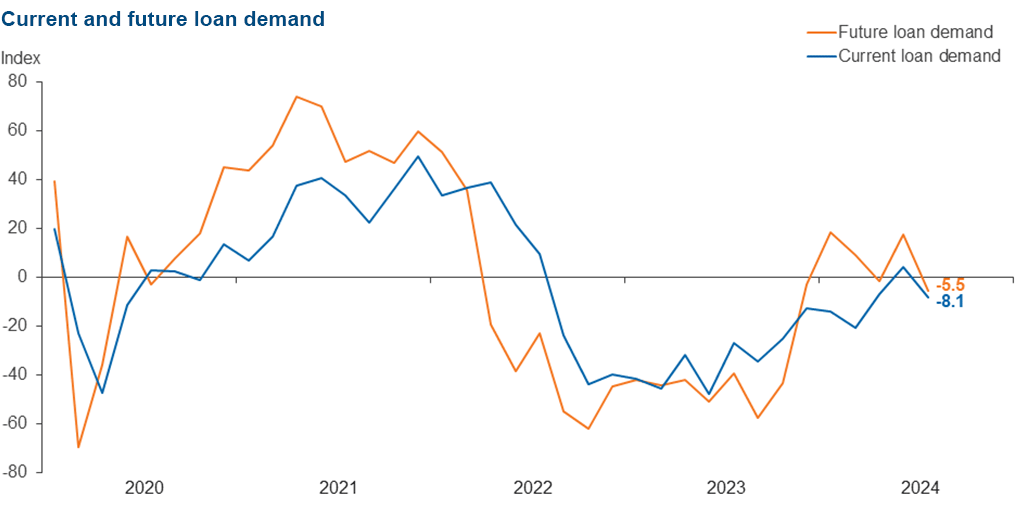
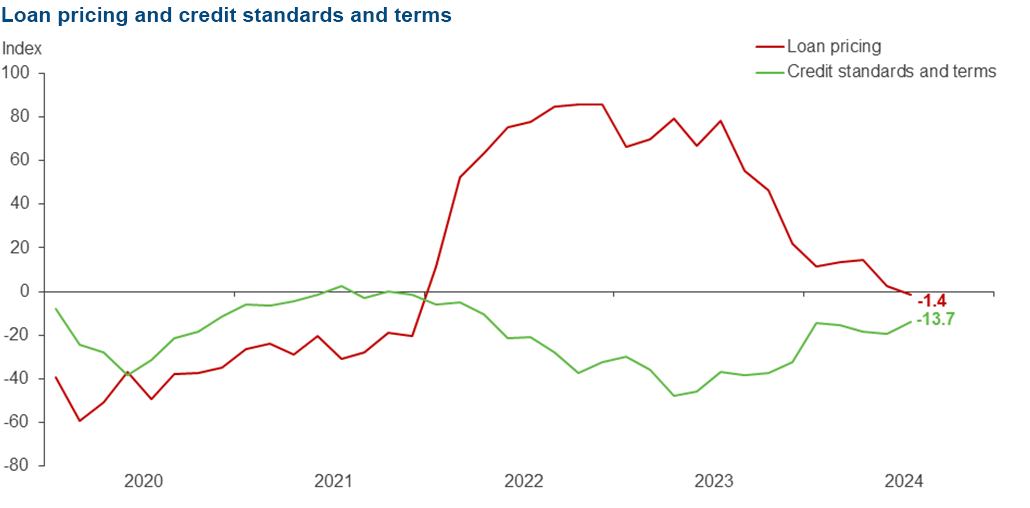
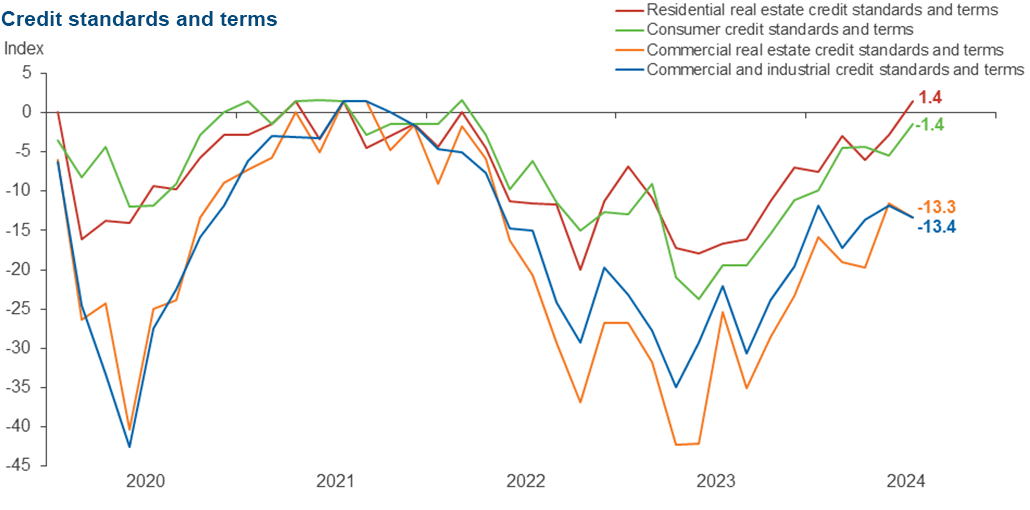
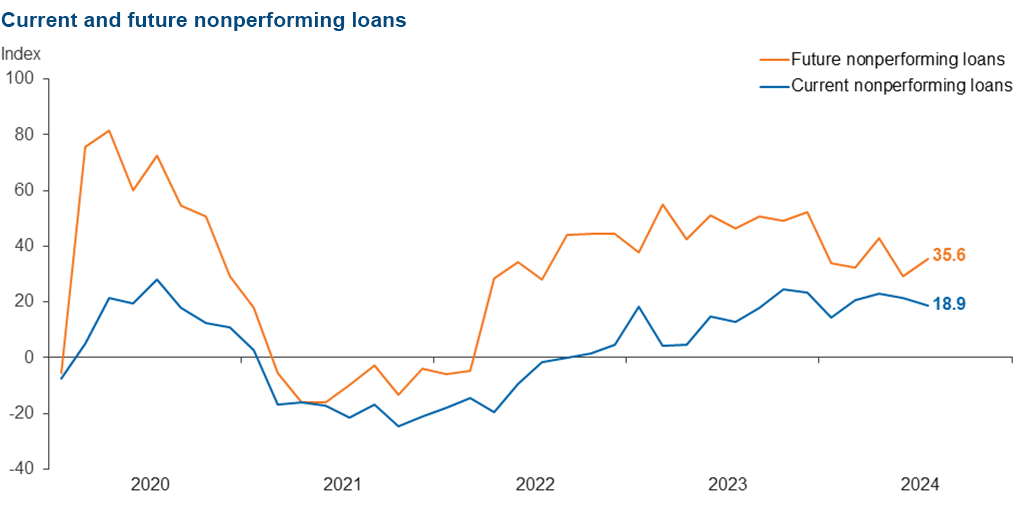
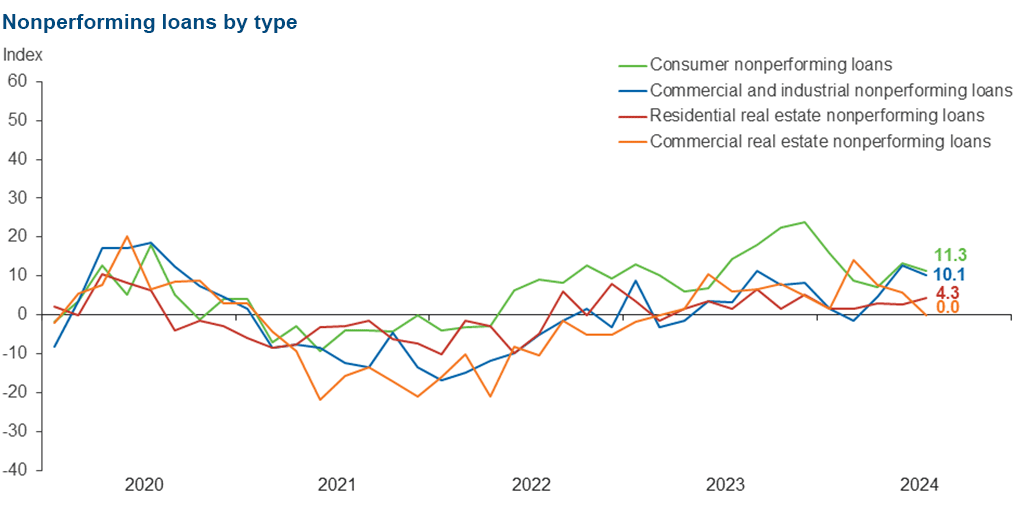
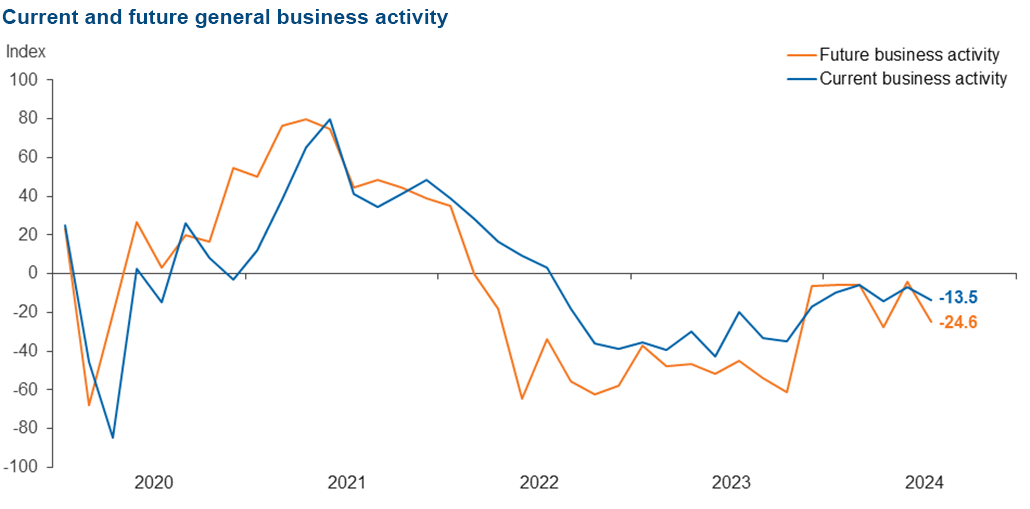
Loan volumes were flat in August after increasing in the prior two periods, and loan demand slipped. While overall credit tightening continued, standards and terms stabilized for residential real estate and consumer loans after more than two years of tightening. Loan prices held steady, marking the first time since 2021 that rates didn’t rise. Loan nonperformance continued to increase. Bankers’ outlooks faltered somewhat: They expect a deterioration in loan demand, loan performance and business activity six months from now.
Next release: October 7, 2024
Data were collected August 6–14, and 74 financial institutions responded to the survey. The Federal Reserve Bank of Dallas conducts the Banking Conditions Survey twice each quarter to obtain a timely assessment of activity at banks and credit unions headquartered in the Eleventh Federal Reserve District. CEOs or senior loan officers of financial institutions report on how conditions have changed for indicators such as loan volume, nonperforming loans and loan pricing. Respondents are also asked to report on their banking outlook and their evaluation of general business activity.
Survey responses are used to calculate an index for each indicator. Each index is calculated by subtracting the percentage of respondents reporting a decrease (or tightening) from the percentage reporting an increase (or easing). When the share of respondents reporting an increase exceeds the share reporting a decrease, the index will be greater than zero, suggesting the indicator has increased over the prior reporting period. If the share of respondents reporting a decrease exceeds the share reporting an increase, the index will be below zero, suggesting the indicator has decreased over the prior reporting period. An index will be zero when the number of respondents reporting an increase is equal to the number reporting a decrease.
Results Summary
Historical data are available from March 2017.
| Total Loans: Over the past six weeks, how have the following changed? | |||||
| Indicator | Current Index | Previous Index | % Reporting Increase | % Reporting No Change | % Reporting Decrease |
Loan volume | –1.3 | 10.7 | 31.1 | 36.5 | 32.4 |
Loan demand | –8.1 | 4.1 | 21.6 | 48.6 | 29.7 |
Nonperforming loans | 18.9 | 21.6 | 28.4 | 62.2 | 9.5 |
Loan pricing | –1.4 | 2.7 | 6.8 | 84.9 | 8.2 |
| Indicator | Current Index | Previous Index | % Reporting Eased | % Reporting No Change | % Reporting Tightened |
Credit standards and terms | –13.7 | –19.2 | 1.5 | 83.3 | 15.2 |
| Commercial and Industrial Loans: Over the past six weeks, how have the following changed? | |||||
| Indicator | Current Index | Previous Index | % Reporting Increase | % Reporting No Change | % Reporting Decrease |
Loan volume | –11.6 | –7.2 | 11.6 | 65.2 | 23.2 |
Nonperforming loans | 10.1 | 12.8 | 15.9 | 78.3 | 5.8 |
| Indicator | Current Index | Previous Index | % Reporting Eased | % Reporting No Change | % Reporting Tightened |
Credit standards and terms | –13.4 | –11.9 | 1.5 | 83.6 | 14.9 |
| Commercial Real Estate Loans: Over the past six weeks, how have the following changed? | |||||
| Indicator | Current Index | Previous Index | % Reporting Increase | % Reporting No Change | % Reporting Decrease |
Loan volume | –8.6 | 5.8 | 20.0 | 51.4 | 28.6 |
Nonperforming loans | 0.0 | 5.8 | 7.1 | 85.7 | 7.1 |
| Indicator | Current Index | Previous Index | % Reporting Eased | % Reporting No Change | % Reporting Tightened |
Credit standards and terms | –13.3 | –11.6 | 2.9 | 80.9 | 16.2 |
| Residential Real Estate Loans: Over the past six weeks, how have the following changed? | |||||
| Indicator | Current Index | Previous Index | % Reporting Increase | % Reporting No Change | % Reporting Decrease |
Loan volume | –2.9 | 10.0 | 23.9 | 49.3 | 26.8 |
Nonperforming loans | 4.3 | 2.8 | 8.5 | 87.3 | 4.2 |
| Indicator | Current Index | Previous Index | % Reporting Eased | % Reporting No Change | % Reporting Tightened |
Credit standards and terms | 1.4 | –2.9 | 1.4 | 98.6 | 0.0 |
| Consumer Loans: Over the past six weeks, how have the following changed? | |||||
| Indicator | Current Index | Previous Index | % Reporting Increase | % Reporting No Change | % Reporting Decrease |
Loan volume | 0.0 | –1.4 | 17.8 | 64.4 | 17.8 |
Nonperforming loans | 11.3 | 13.3 | 15.5 | 80.3 | 4.2 |
| Indicator | Current Index | Previous Index | % Reporting Eased | % Reporting No Change | % Reporting Tightened |
Credit standards and terms | –1.4 | –5.5 | 0.0 | 98.6 | 1.4 |
| Banking Outlook: What is your expectation for the following items six months from now? | |||||
| Indicator | Current Index | Previous Index | % Reporting Increase | % Reporting No Change | % Reporting Decrease |
Total loan demand | –5.5 | 17.3 | 32.9 | 28.8 | 38.4 |
Nonperforming loans | 35.6 | 29.3 | 43.8 | 47.9 | 8.2 |
| General Business Activity: What is your evaluation of the level of activity? | |||||
| Indicator | Current Index | Previous Index | % Reporting Better | % Reporting No Change | % Reporting Worse |
Over the past six weeks | –13.5 | –6.7 | 14.9 | 56.8 | 28.4 |
Six months from now | –24.6 | –4.0 | 24.7 | 26.0 | 49.3 |
Respondents were given an opportunity to comment on any issues that may be affecting their business.
These comments are from respondents’ completed surveys and have been edited for publication.
- Rates, inflation and the upcoming election have impacted loan demand. We have expectations that things will pick up after the election.
- Increases in nonperforming commercial real estate loans are isolated to a few credit accounts and are less related to a specific industry.
- The higher-for-longer narrative has dampened demand; the market is anticipating rate cuts, which should stimulate demand
- Bifurcation is occurring between large public companies and private, middle-market firms. For middle-market firms, average EBITDA and margins have been falling due to higher costs and an inability to further increase prices. With interest rates remaining elevated, higher debt service cost is also taking its toll on net profit after tax. Expect to see an increase in covenant breaches and defaults.
- [We are in a] deep recession. The Federal Reserve has waited too long to reduce rates.
- Uncertainty about future rate cuts is beginning to be unsettling for customers. They will wait for rates to settle before moving forward with business deals.
- Economic signals are still sending mixed messages. Unemployment is still low, but hourly employees are having a more difficult time finding work. Inflation is slowing, but it’s still a factor in how people spend their money. Plus, the presidential election cycle is causing more uncertainty as usual.
- Our general impression is that economic conditions have worsened across the board.
- A lot depends on the election in November 2024.
- We are seeing a significant slowdown in residential real estate applications (both consumer and investor). The uncertainty as to when rates will decline and the upcoming election have caused potential buyers to pause or delay their purchases.
- [We are concerned about] changes to the Electronic Fund Transfer Act to make banks liable for consumer loan scams. We will consider not offering this product due to unlimited liability outside of our control. Customers have to bear some responsibility for giving their information away and not being savvy to ever-increasing scams.
Historical data can be downloaded dating back to March 2017. For the definitions, see data definitions.
NOTE: The following series were discontinued in May 2020: volume of core deposits, cost of funds, non-interest income and net interest margin.
Questions regarding the Banking Conditions Survey can be addressed to Mariam Yousuf at mariam.yousuf@dal.frb.org.
Sign up for our email alert to be automatically notified as soon as the latest Banking Conditions Survey is released on the web.