Banking Conditions Survey

For this survey, Eleventh District banking executives were asked supplemental questions on deposits, credit standards, commercial real estate lending and interest rates. Read the special questions results.
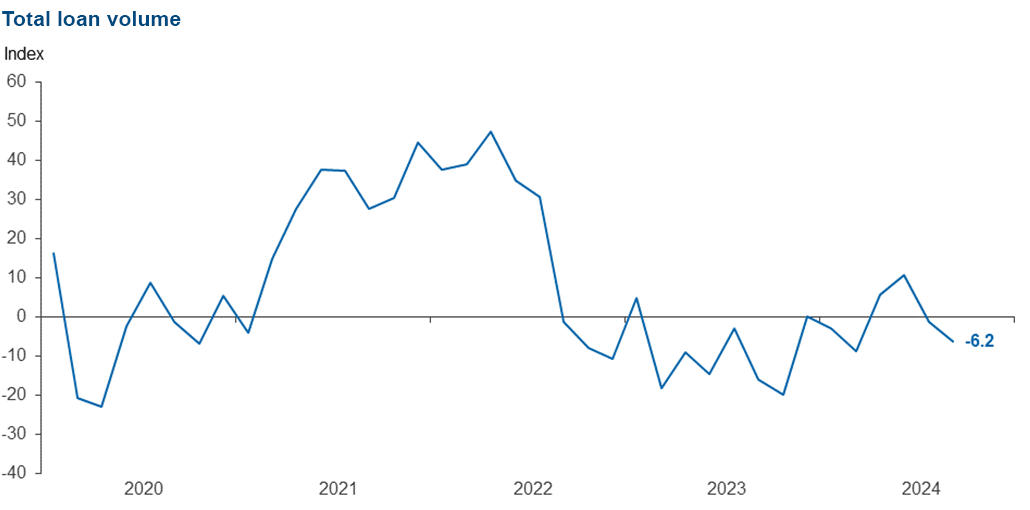
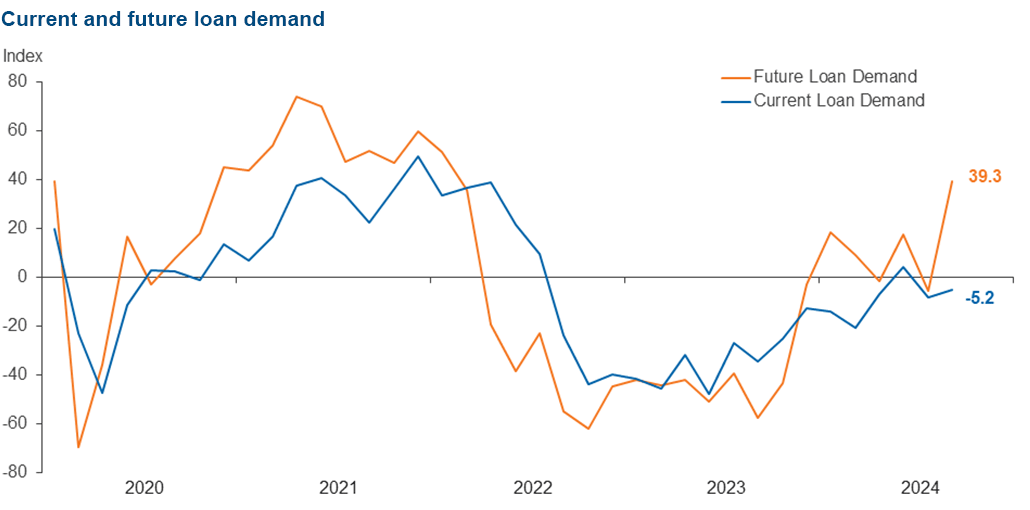
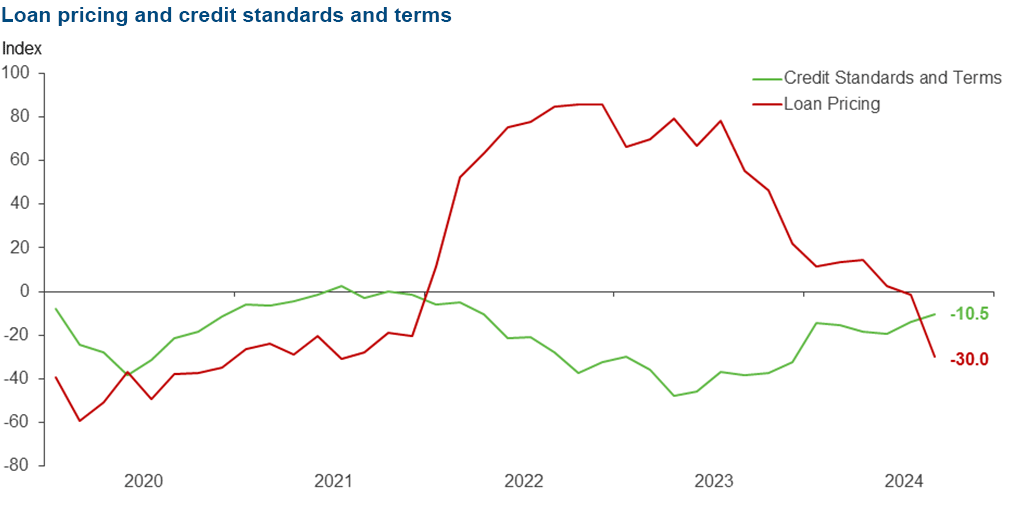
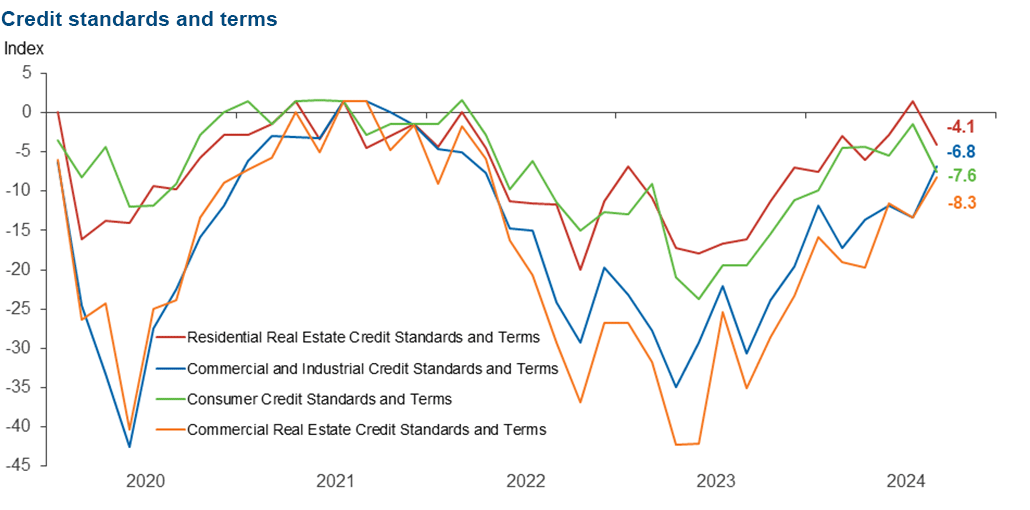
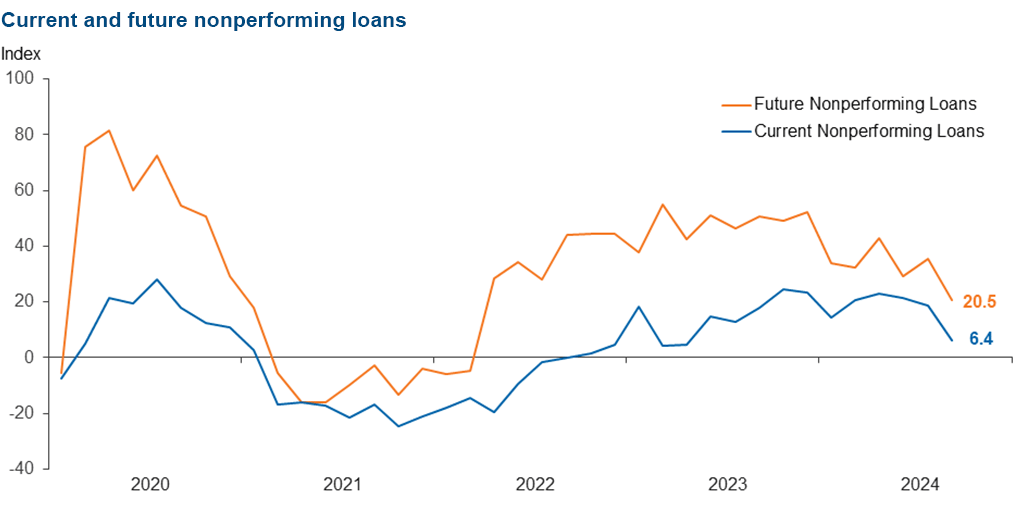
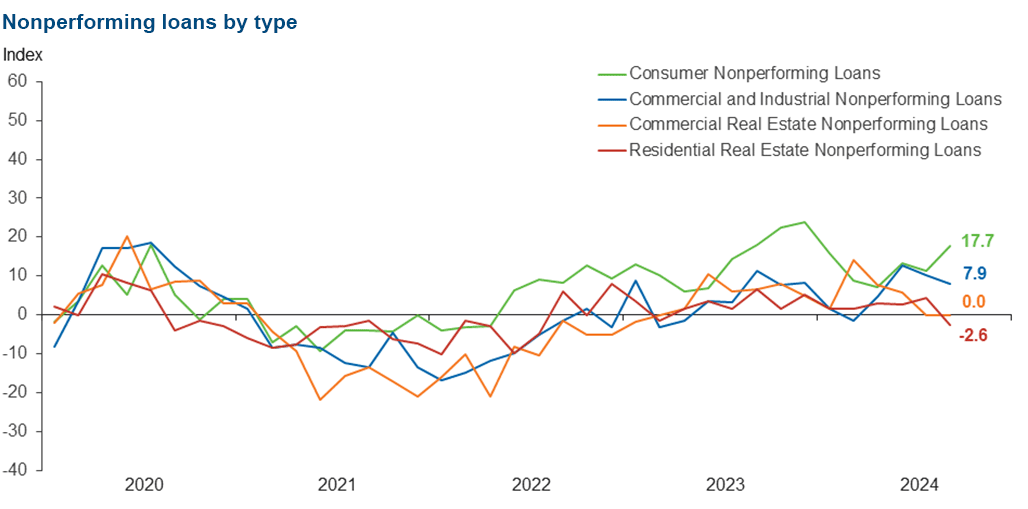
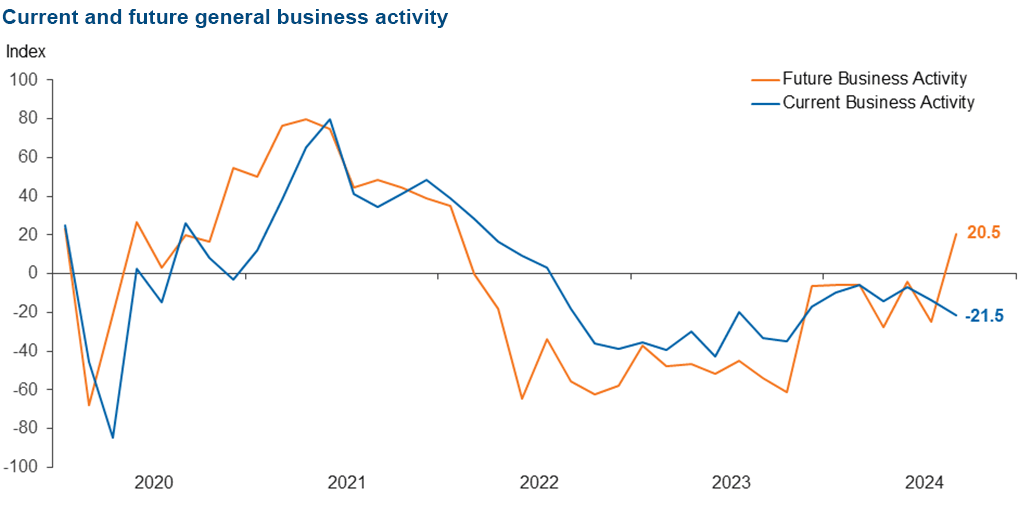
Loan volume declined in October despite the drop in loan prices, which retreated for the first time since 2021. Overall, credit tightening continued and loan nonperformance rose but at slower pace for both. Bankers’ outlooks reversed sharply and turned optimistic. They expect a significant improvement in loan demand and business activity six months from now, although they foresee continued deterioration in loan performance in the next six months.
Next release: November 18, 2024
Data were collected September 24–October 2, and 80 financial institutions responded to the survey. The Federal Reserve Bank of Dallas conducts the Banking Conditions Survey twice each quarter to obtain a timely assessment of activity at banks and credit unions headquartered in the Eleventh Federal Reserve District. CEOs or senior loan officers of financial institutions report on how conditions have changed for indicators such as loan volume, nonperforming loans and loan pricing. Respondents are also asked to report on their banking outlook and their evaluation of general business activity.
Survey responses are used to calculate an index for each indicator. Each index is calculated by subtracting the percentage of respondents reporting a decrease (or tightening) from the percentage reporting an increase (or easing). When the share of respondents reporting an increase exceeds the share reporting a decrease, the index will be greater than zero, suggesting the indicator has increased over the prior reporting period. If the share of respondents reporting a decrease exceeds the share reporting an increase, the index will be below zero, suggesting the indicator has decreased over the prior reporting period. An index will be zero when the number of respondents reporting an increase is equal to the number reporting a decrease.
Results Summary
Historical data are available from March 2017.
| Total Loans: Over the past six weeks, how have the following changed? | |||||
| Indicator | Current Index | Previous Index | % Reporting Increase | % Reporting No Change | % Reporting Decrease |
Loan volume | –6.2 | –1.3 | 28.8 | 36.3 | 35.0 |
Loan demand | –5.2 | –8.1 | 25.6 | 43.6 | 30.8 |
Nonperforming loans | 6.4 | 18.9 | 17.9 | 70.5 | 11.5 |
Loan pricing | –30.0 | –1.4 | 6.3 | 57.5 | 36.3 |
| Indicator | Current Index | Previous Index | % Reporting Eased | % Reporting No Change | % Reporting Tightened |
Credit standards and terms | –10.5 | –13.7 | 0.0 | 89.5 | 10.5 |
| Commercial and Industrial Loans: Over the past six weeks, how have the following changed? | |||||
| Indicator | Current Index | Previous Index | % Reporting Increase | % Reporting No Change | % Reporting Decrease |
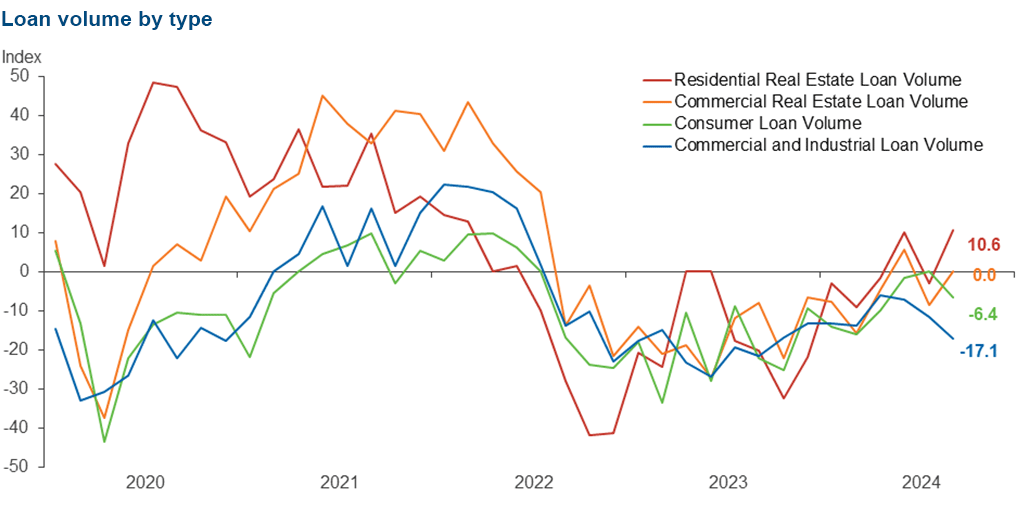
Loan volume | –17.1 | –11.6 | 10.5 | 61.8 | 27.6 |
Nonperforming loans | 7.9 | 10.1 | 13.2 | 81.6 | 5.3 |
| Indicator | Current Index | Previous Index | % Reporting Eased | % Reporting No Change | % Reporting Tightened |
Credit standards and terms | –6.8 | –13.4 | 1.4 | 90.4 | 8.2 |
| Commercial Real Estate Loans: Over the past six weeks, how have the following changed? | |||||
| Indicator | Current Index | Previous Index | % Reporting Increase | % Reporting No Change | % Reporting Decrease |
Loan volume | 0.0 | –8.6 | 24.3 | 51.4 | 24.3 |
Nonperforming loans | 0.0 | 0.0 | 8.1 | 83.8 | 8.1 |
| Indicator | Current Index | Previous Index | % Reporting Eased | % Reporting No Change | % Reporting Tightened |
Credit standards and terms | –8.3 | –13.3 | 1.4 | 88.9 | 9.7 |
| Residential Real Estate Loans: Over the past six weeks, how have the following changed? | |||||
| Indicator | Current Index | Previous Index | % Reporting Increase | % Reporting No Change | % Reporting Decrease |
Loan volume | 10.6 | –2.9 | 25.3 | 60.0 | 14.7 |
Nonperforming loans | –2.6 | 4.3 | 2.7 | 92.0 | 5.3 |
| Indicator | Current Index | Previous Index | % Reporting Eased | % Reporting No Change | % Reporting Tightened |
Credit standards and terms | –4.1 | 1.4 | 1.4 | 93.2 | 5.5 |
| Consumer Loans: Over the past six weeks, how have the following changed? | |||||
| Indicator | Current Index | Previous Index | % Reporting Increase | % Reporting No Change | % Reporting Decrease |
Loan volume | –6.4 | 0.0 | 13.9 | 65.8 | 20.3 |
Nonperforming loans | 17.7 | 11.3 | 21.5 | 74.7 | 3.8 |
| Indicator | Current Index | Previous Index | % Reporting Eased | % Reporting No Change | % Reporting Tightened |
Credit standards and terms | –7.6 | –1.4 | 0.0 | 92.4 | 7.6 |
| Banking Outlook: What is your expectation for the following items six months from now? | |||||
| Indicator | Current Index | Previous Index | % Reporting Increase | % Reporting No Change | % Reporting Decrease |
Total loan demand | 39.3 | –5.5 | 60.8 | 17.7 | 21.5 |
Nonperforming loans | 20.5 | 35.6 | 28.2 | 64.1 | 7.7 |
| General Business Activity: What is your evaluation of the level of activity? | |||||
| Indicator | Current Index | Previous Index | % Reporting Better | % Reporting No Change | % Reporting Worse |
Over the past six weeks | –21.5 | –13.5 | 12.7 | 53.2 | 34.2 |
Six months from now | 20.5 | –24.6 | 44.9 | 30.8 | 24.4 |
Respondents were given an opportunity to comment on any issues that may be affecting their business.
These comments are from respondents’ completed surveys and have been edited for publication.
- The outcome of the election in November [is important]. A "red" or "blue" wave that gives one party a controlling majority could impact business and demand for credit, either up or down.
- Lower floating rates will help CRE [commercial real estate] borrowers with covenant performance issues.
- We are concerned about a resurgence of inflation two years out. Both political parties have inflationary platforms, and the Fed’s [Federal Reserve’s] 0.5-percentage-point decrease, in our view, encourages demand to reengage prematurely and with velocity, given the U.S. economy is at full employment. We see that now as a bigger risk than preventing a recession.
- A strong market in the Dallas–Fort Worth metro matters more than the U.S. economy slowing.
- Companies have turned cautious ahead of U.S. elections. In a latest survey, only 12 percent of chief financial officers said that now is the time to take greater risks.
- We are experiencing credit unions offering unreasonable rates and terms to large commercial borrowers. For example, a $15 million-plus loan for subprime rates and extended terms is not something a prudent banker will match. Credit unions are also offering high-yielding rates on certificates of deposit for 18-plus months. The market is becoming very competitive, and there is always a desire to not lose a customer. Chasing deals with a reverse auction mentality will cost the industry down the road. Prudent banking must be observed.
- Operating expenses continue to grow.
- [We are concerned about the] election results and the effect on the economy. Delinquencies are beginning to rise, and we are concerned that will continue. We are also watching the timing of future rate decreases.
- Who knows what will happen until the first Tuesday in November?
Historical data can be downloaded dating back to March 2017. For the definitions, see data definitions.
NOTE: The following series were discontinued in May 2020: volume of core deposits, cost of funds, non-interest income and net interest margin.
Questions regarding the Banking Conditions Survey can be addressed to Mariam Yousuf at mariam.yousuf@dal.frb.org.
Sign up for our email alert to be automatically notified as soon as the latest Banking Conditions Survey is released on the web.