Banking Conditions Survey

For this survey, Eleventh District banking executives were asked supplemental questions on credit standards and commercial lending for small businesses. Read the special questions results.
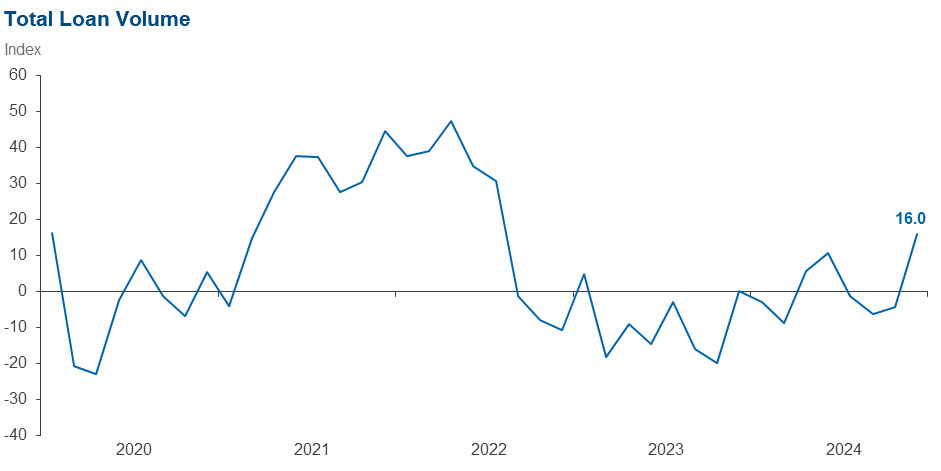
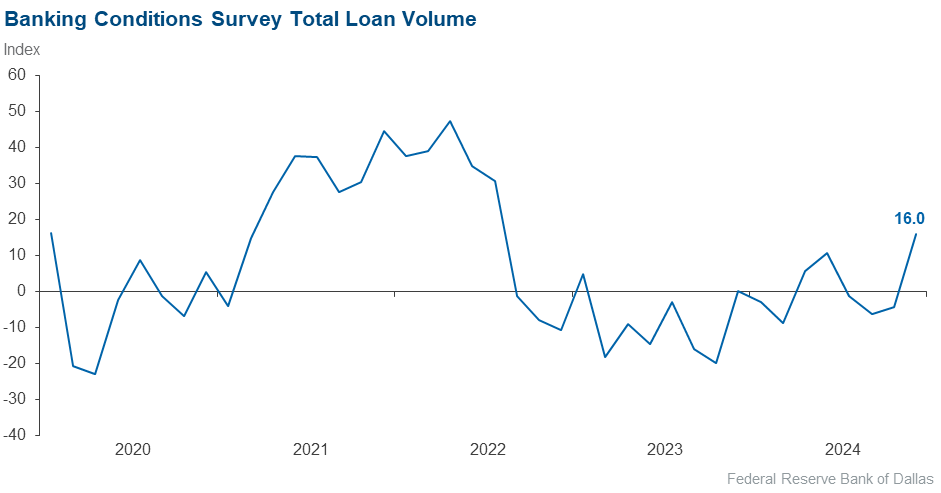
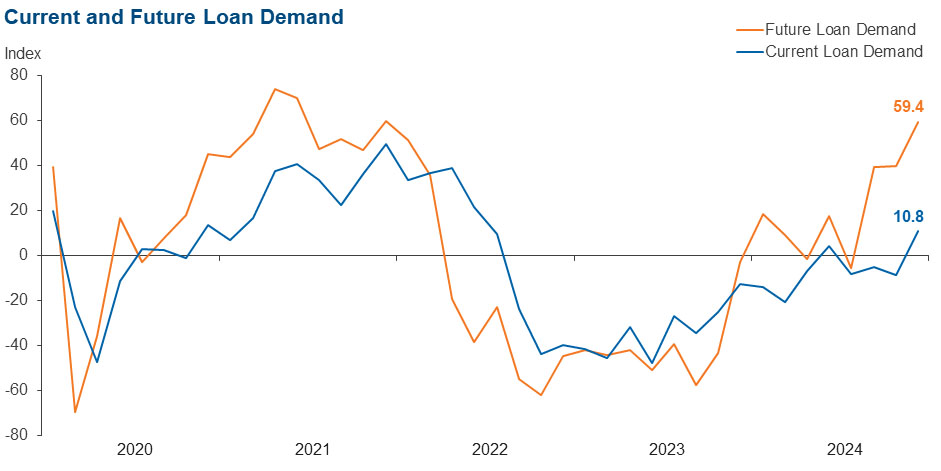
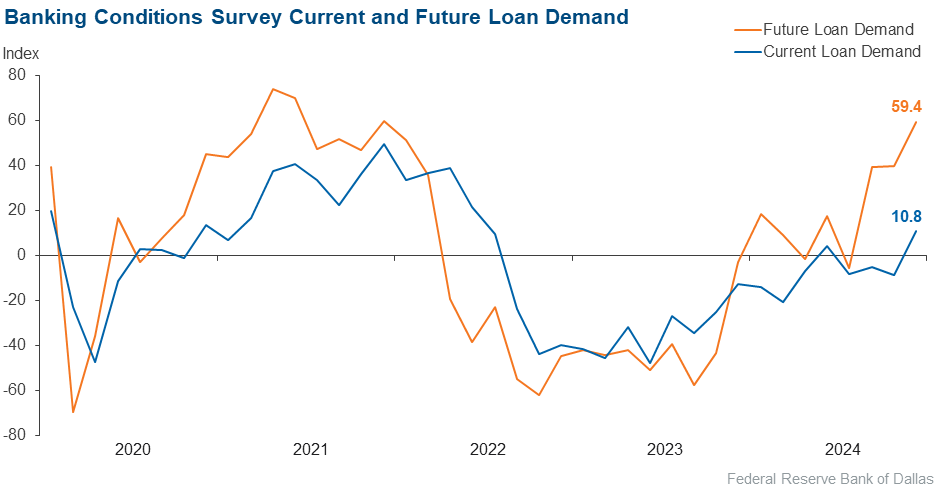
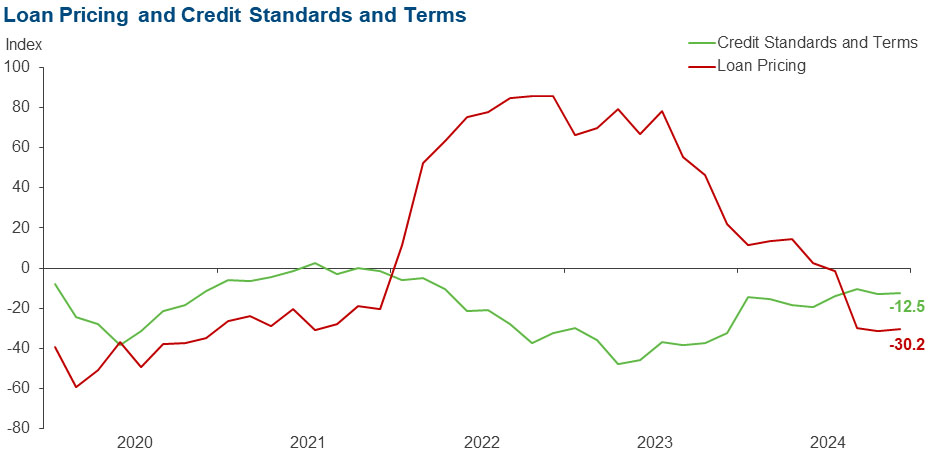
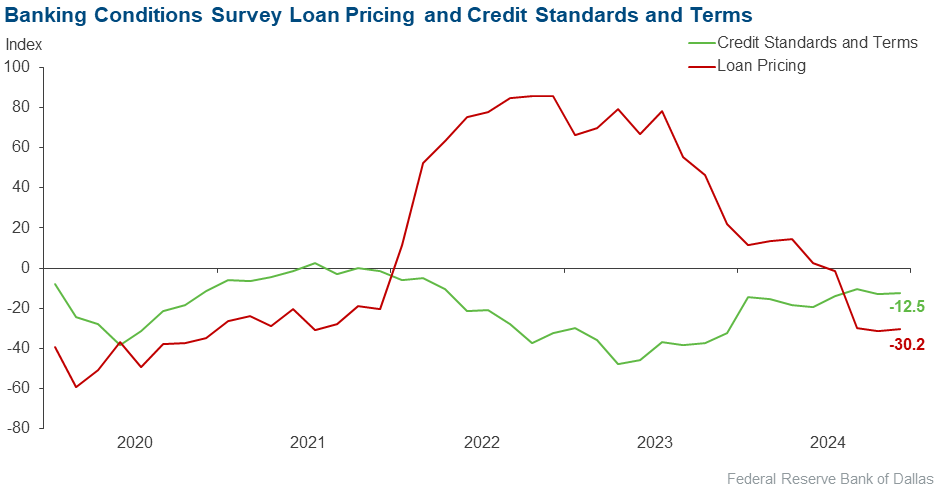
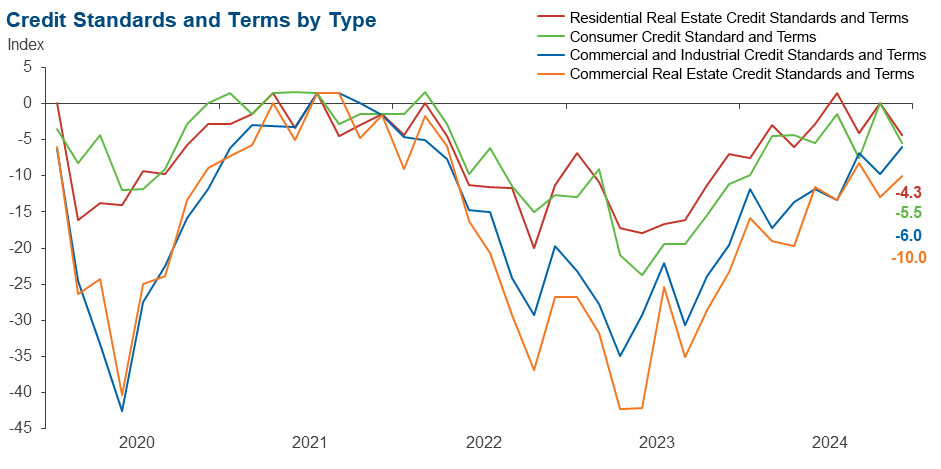
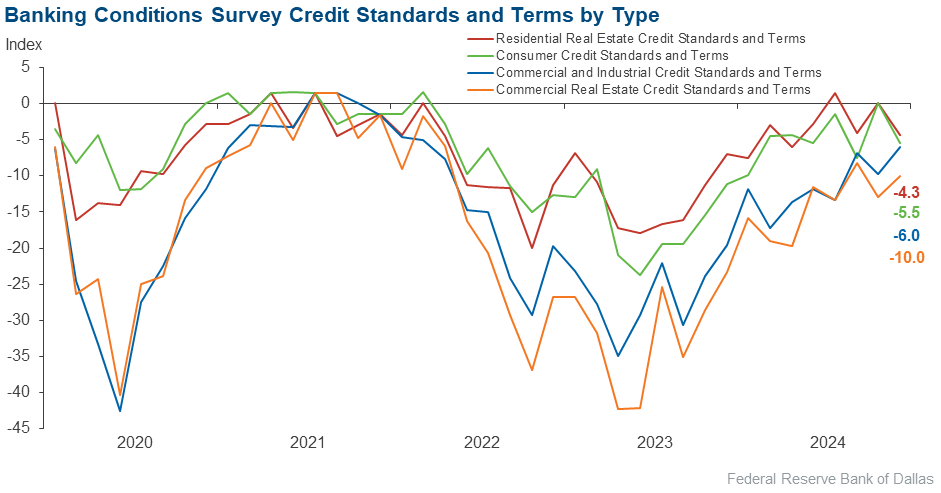
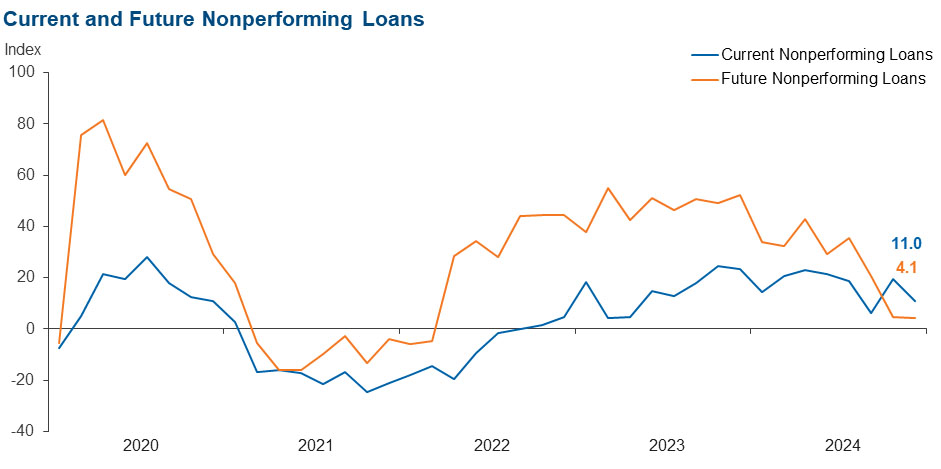
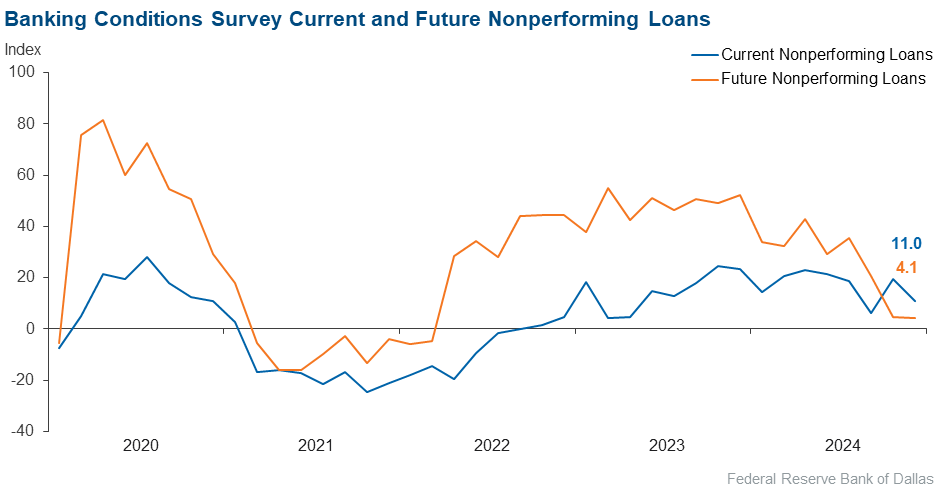
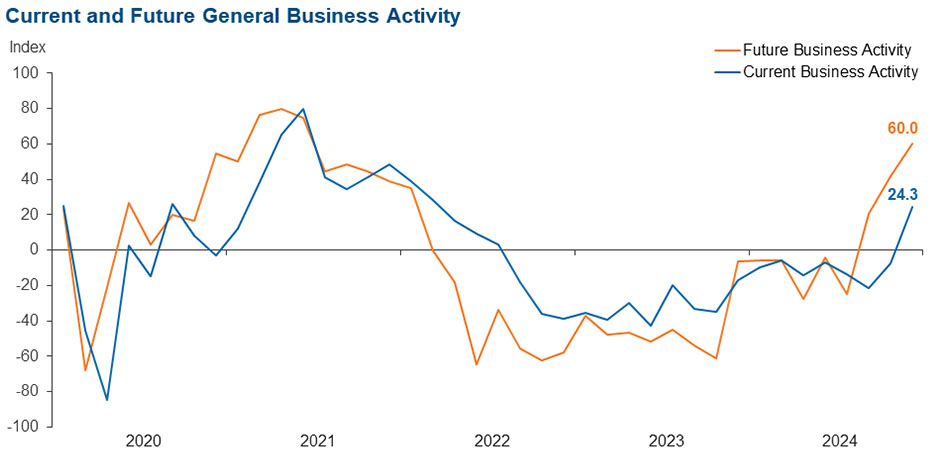
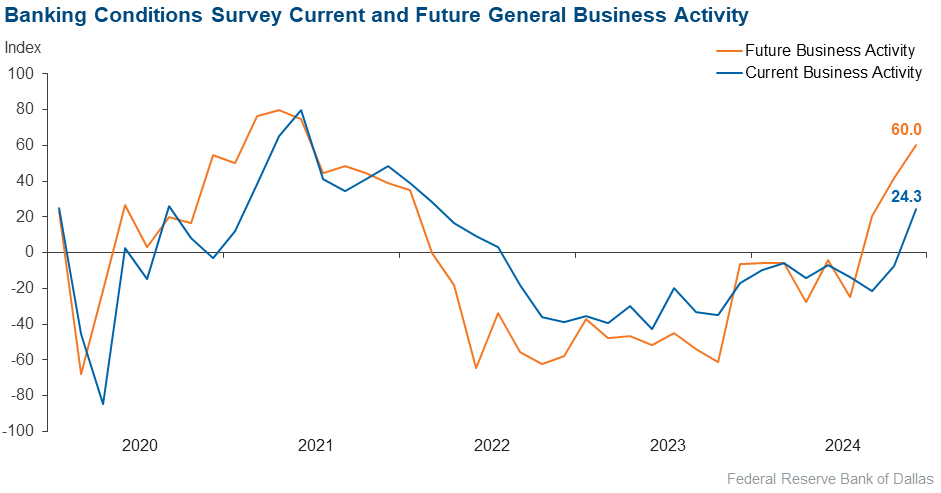
Loan volume accelerated sharply in December. Credit tightening continued, but loan pricing declined, both at the same pace as six weeks ago. Overall, loan nonperformance rose but at a slower pace. In addition to swift growth in loan demand, bankers reported a sizeable pickup in general business activity for the first time in over two years. Meanwhile, bankers’ outlooks turned even more optimistic. They expect an increasingly rapid improvement in loan demand and business activity and just a mild deterioration in loan performance six months from now.
Next release: February 18, 2025
Data were collected December 16–24, and 75 financial institutions responded to the survey. The Federal Reserve Bank of Dallas conducts the Banking Conditions Survey twice each quarter to obtain a timely assessment of activity at banks and credit unions headquartered in the Eleventh Federal Reserve District. CEOs or senior loan officers of financial institutions report on how conditions have changed for indicators such as loan volume, nonperforming loans and loan pricing. Respondents are also asked to report on their banking outlook and their evaluation of general business activity.
Survey responses are used to calculate an index for each indicator. Each index is calculated by subtracting the percentage of respondents reporting a decrease (or tightening) from the percentage reporting an increase (or easing). When the share of respondents reporting an increase exceeds the share reporting a decrease, the index will be greater than zero, suggesting the indicator has increased over the prior reporting period. If the share of respondents reporting a decrease exceeds the share reporting an increase, the index will be below zero, suggesting the indicator has decreased over the prior reporting period. An index will be zero when the number of respondents reporting an increase is equal to the number reporting a decrease.
Results Summary
Historical data are available from March 2017.
| Total Loans: Over the past six weeks, how have the following changed? | |||||
| Indicator | Current Index | Previous Index | % Reporting Increase | % Reporting No Change | % Reporting Decrease |
Loan volume | 16.0 | –4.4 | 41.3 | 33.3 | 25.3 |
Loan demand | 10.8 | –8.9 | 36.5 | 37.8 | 25.7 |
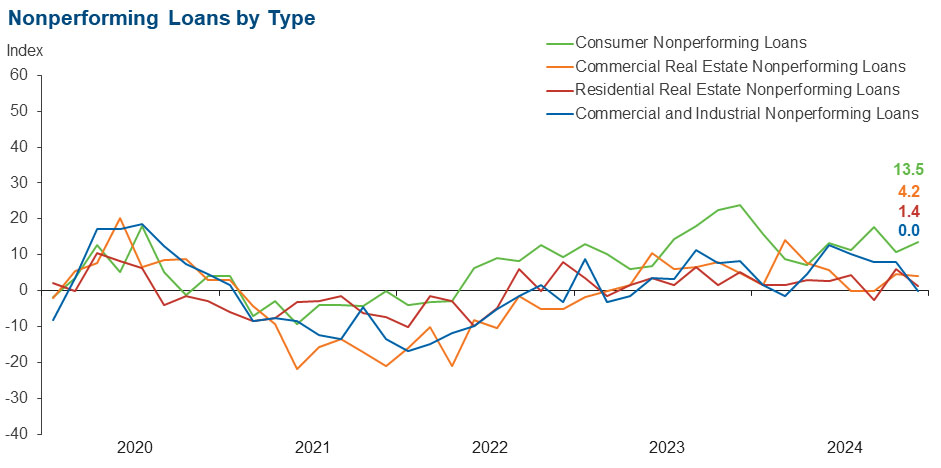
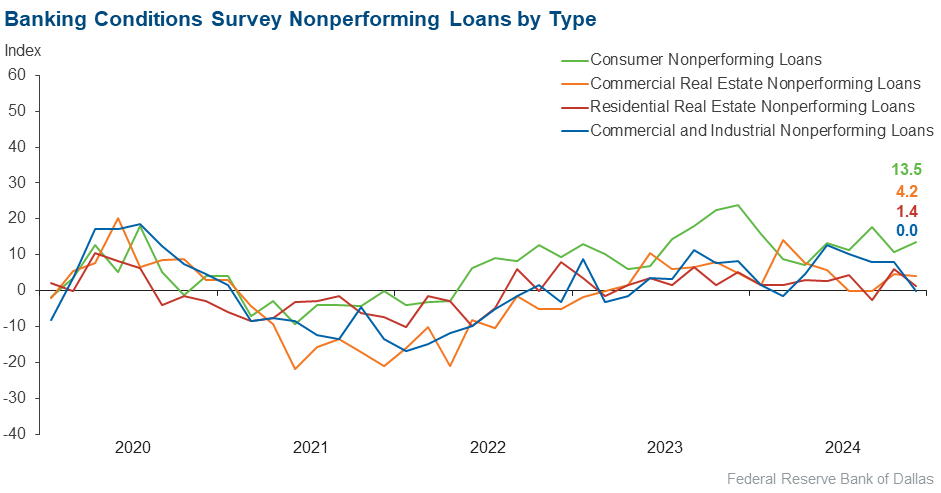
Nonperforming loans | 11.0 | 19.5 | 23.3 | 64.4 | 12.3 |
Loan pricing | –30.2 | –31.3 | 6.8 | 56.2 | 37.0 |
| Indicator | Current Index | Previous Index | % Reporting Eased | % Reporting No Change | % Reporting Tightened |
Credit standards and terms | –12.5 | –12.7 | 0.0 | 87.5 | 12.5 |
| Commercial and Industrial Loans: Over the past six weeks, how have the following changed? | |||||
| Indicator | Current Index | Previous Index | % Reporting Increase | % Reporting No Change | % Reporting Decrease |
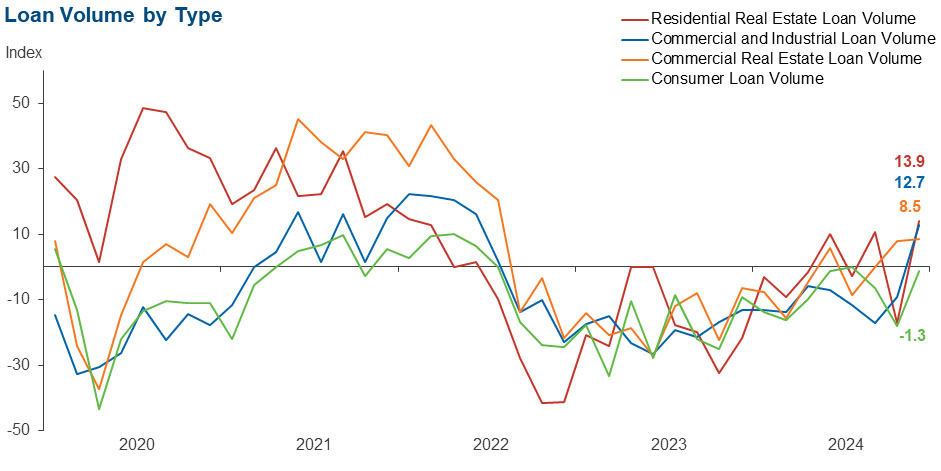
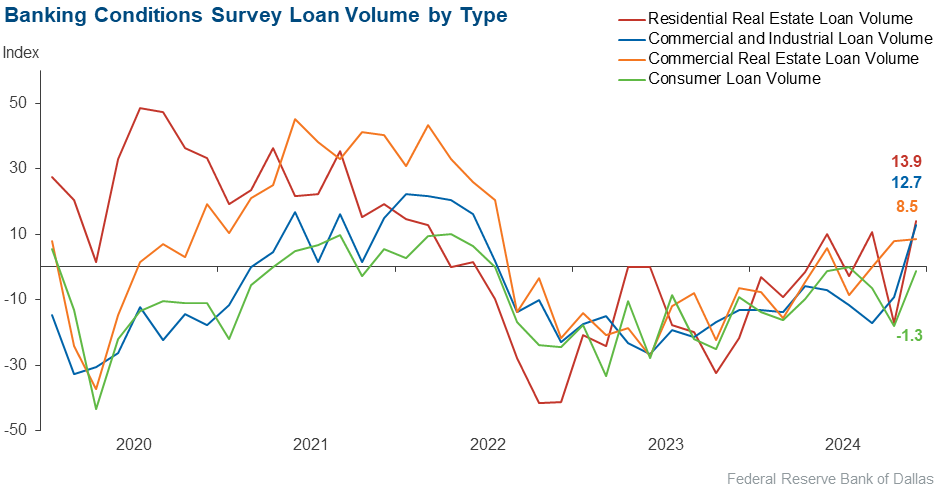
Loan volume | 12.7 | –9.3 | 25.4 | 62.0 | 12.7 |
Nonperforming loans | 0.0 | 8.0 | 7.0 | 85.9 | 7.0 |
| Indicator | Current Index | Previous Index | % Reporting Eased | % Reporting No Change | % Reporting Tightened |
Credit standards and terms | –6.0 | –9.7 | 0.0 | 94.0 | 6.0 |
| Commercial Real Estate Loans: Over the past six weeks, how have the following changed? | |||||
| Indicator | Current Index | Previous Index | % Reporting Increase | % Reporting No Change | % Reporting Decrease |
Loan volume | 8.5 | 7.9 | 31.0 | 46.5 | 22.5 |
Nonperforming loans | 4.2 | 4.6 | 12.7 | 78.9 | 8.5 |
| Indicator | Current Index | Previous Index | % Reporting Eased | % Reporting No Change | % Reporting Tightened |
Credit standards and terms | –10.0 | –12.9 | 0.0 | 90.0 | 10.0 |
| Residential Real Estate Loans: Over the past six weeks, how have the following changed? | |||||
| Indicator | Current Index | Previous Index | % Reporting Increase | % Reporting No Change | % Reporting Decrease |
Loan volume | 13.9 | –17.0 | 30.6 | 52.8 | 16.7 |
Nonperforming loans | 1.4 | 6.1 | 5.6 | 90.3 | 4.2 |
| Indicator | Current Index | Previous Index | % Reporting Eased | % Reporting No Change | % Reporting Tightened |
Credit standards and terms | –4.3 | 0.0 | 0.0 | 95.7 | 4.3 |
| Consumer Loans: Over the past six weeks, how have the following changed? | |||||
| Indicator | Current Index | Previous Index | % Reporting Increase | % Reporting No Change | % Reporting Decrease |
Loan volume | –1.3 | –18.2 | 17.6 | 63.5 | 18.9 |
Nonperforming loans | 13.5 | 10.8 | 17.6 | 78.4 | 4.1 |
| Indicator | Current Index | Previous Index | % Reporting Eased | % Reporting No Change | % Reporting Tightened |
Credit standards and terms | –5.5 | 0.0 | 1.4 | 91.7 | 6.9 |
| Banking Outlook: What is your expectation for the following items six months from now? | |||||
| Indicator | Current Index | Previous Index | % Reporting Increase | % Reporting No Change | % Reporting Decrease |
Total loan demand | 59.4 | 39.7 | 68.9 | 21.6 | 9.5 |
Nonperforming loans | 4.1 | 4.5 | 19.2 | 65.8 | 15.1 |
| General Business Activity: What is your evaluation of the level of activity? | |||||
| Indicator | Current Index | Previous Index | % Reporting Better | % Reporting No Change | % Reporting Worse |
Over the past six weeks | 24.3 | –7.3 | 40.5 | 43.2 | 16.2 |
Six months from now | 60.0 | 41.8 | 66.7 | 26.7 | 6.7 |
Respondents were given an opportunity to comment on any issues that may be affecting their business.
These comments are from respondents’ completed surveys and have been edited for publication.
- The liquidity requirement is unreasonable when you have established lines of credit available at the Federal Reserve. It only decreases our net interest margin.
- Pausing on more rate hikes is understandable given that the inflation battle is not won. However, it will dampen the outlook for commercial real estate finance.
- Overall demand for loans has declined over the past six weeks, and we anticipate this to continue in 2025.
- Generally, our customers are more positive on their economic outlook since the election.
- There are concerns about lingering inflation.
- We are continuing to monitor the volume of recently released regulatory actions, interpretative guidance, etc., to understand the impact of the change in administration and legal reviews. Also, we continue to monitor the future path of inflation and resulting direction of rates.
- The election changeover, a new Congress and recent stock market losses [will impact the banking sector].
Historical data can be downloaded dating back to March 2017. For the definitions, see data definitions.
NOTE: The following series were discontinued in May 2020: volume of core deposits, cost of funds, non-interest income and net interest margin.
Questions regarding the Banking Conditions Survey can be addressed to Mariam Yousuf at mariam.yousuf@dal.frb.org.
Sign up for our email alert to be automatically notified as soon as the latest Banking Conditions Survey is released on the web.