Banking Conditions Survey

For this survey, Eleventh District banking executives were asked supplemental questions on outlook concerns, stablecoins-tokenized deposits and loan performance. Read the special questions results.
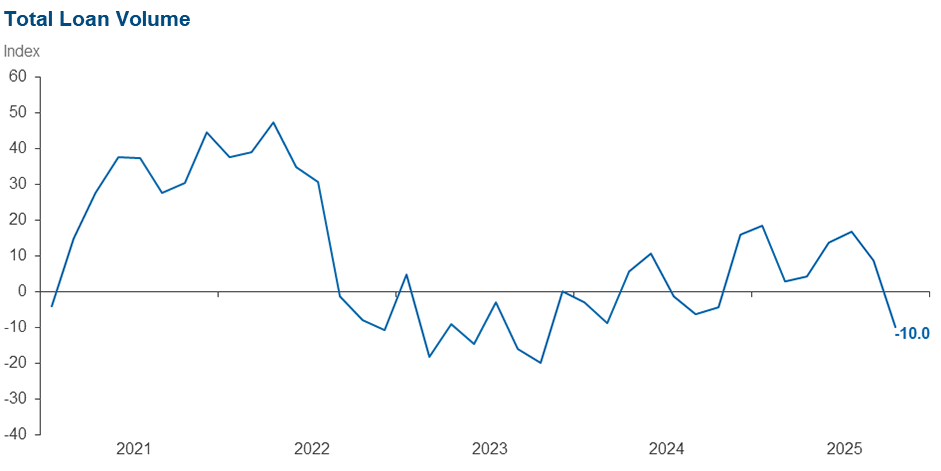
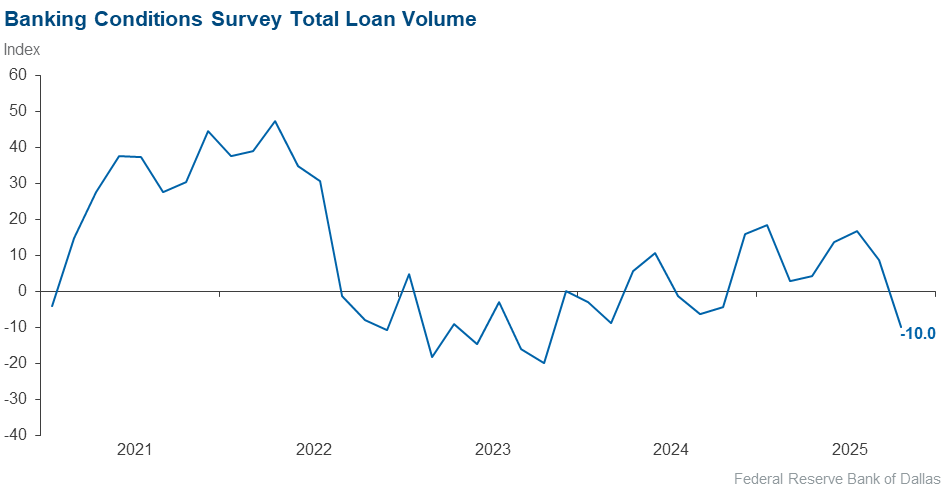
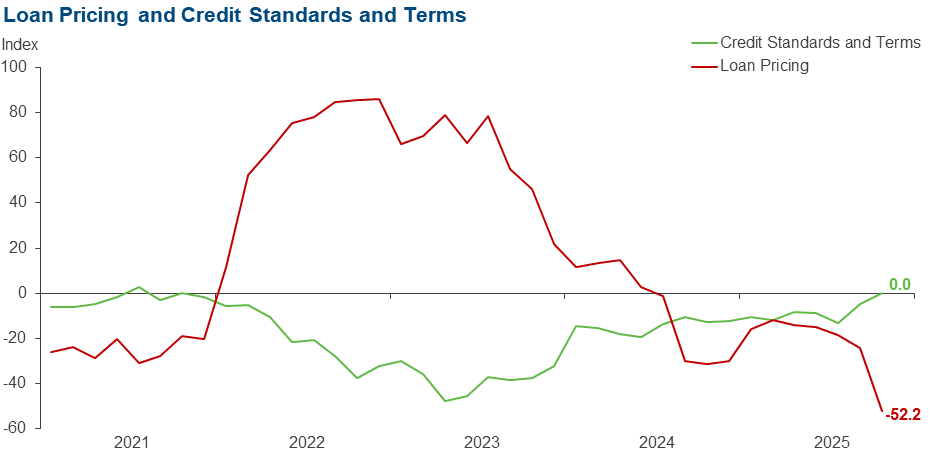
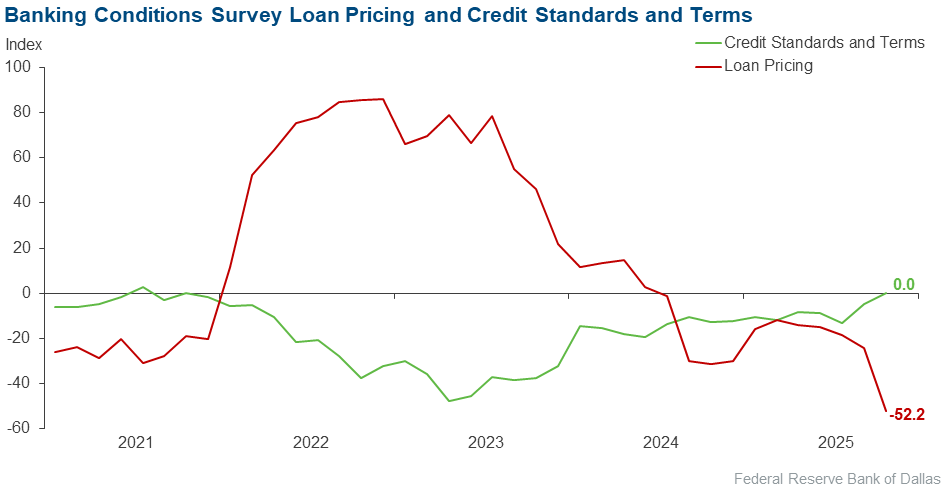
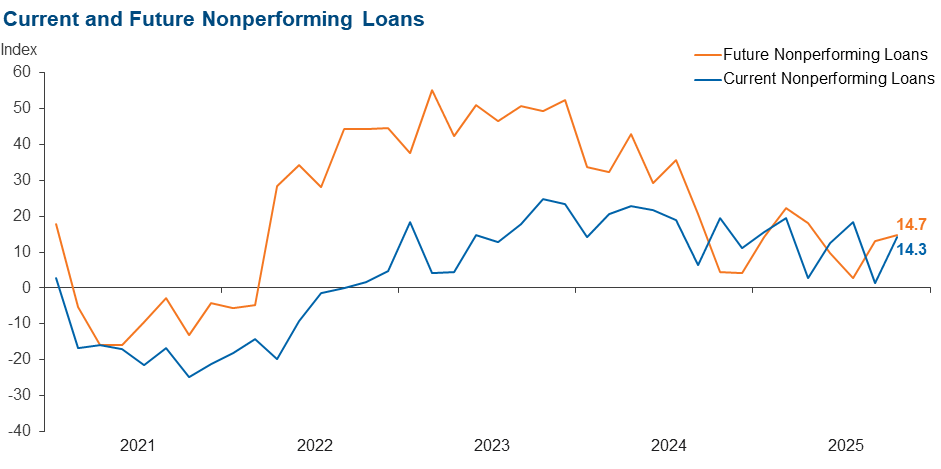
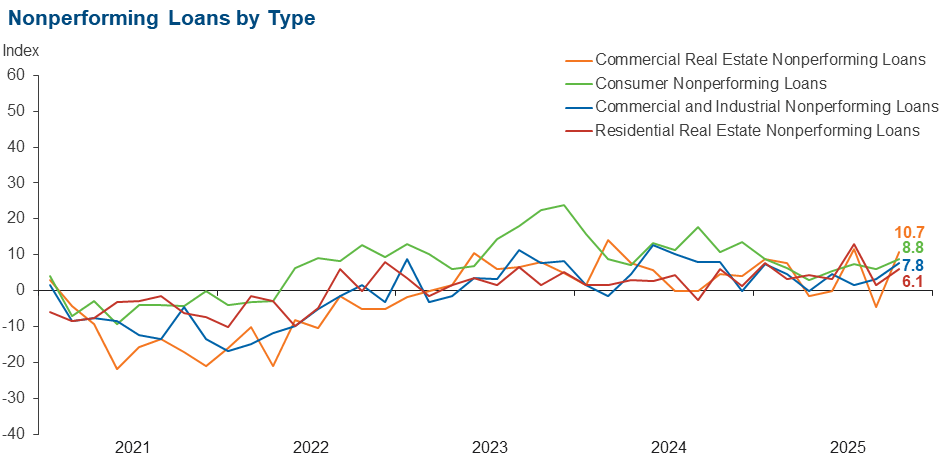
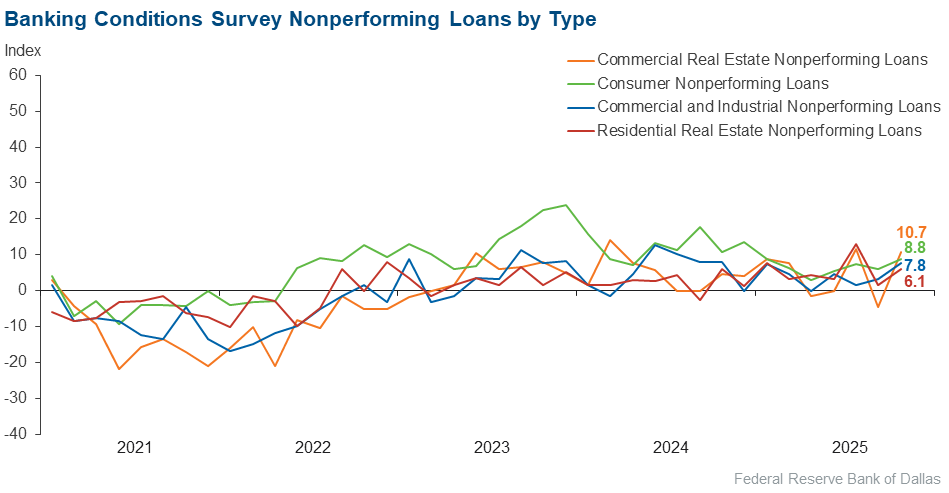
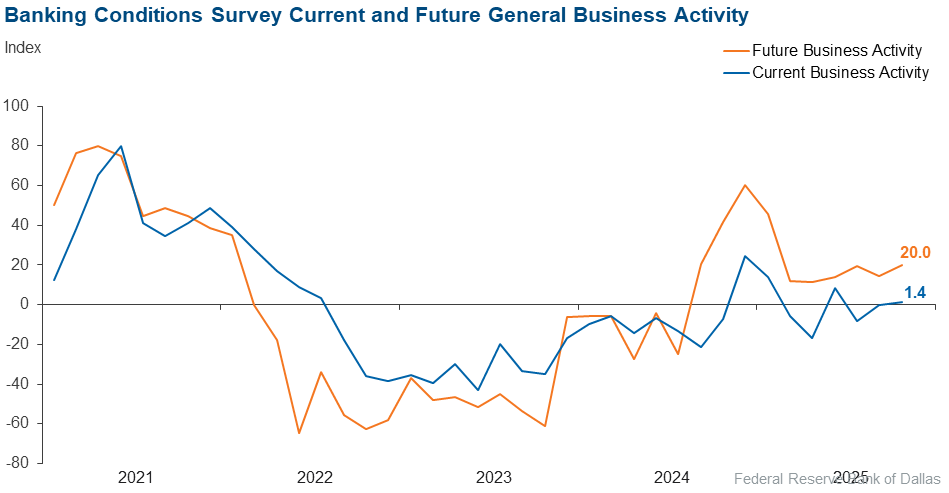
Loan volume and demand fell in November after several months of growth. Volume declines were led by consumer and commercial and industrial lending. Credit standards and terms were unchanged, while a broad-based decline was seen in loan pricing, with more than half of bankers reporting a decrease. Overall loan performance deteriorated at a faster pace than was reported in the previous survey. Bankers reported stable general business activity, and their outlooks remained mixed. Survey respondents said they expect growth in loan demand and business activity but continued deterioration in loan performance over the next six months.
Next release: December 30, 2025
Data were collected October 28–November 5, and 70 financial institutions responded to the survey. The Federal Reserve Bank of Dallas conducts the Banking Conditions Survey twice each quarter to obtain a timely assessment of activity at banks and credit unions headquartered in the Eleventh Federal Reserve District. CEOs or senior loan officers of financial institutions report on how conditions have changed for indicators such as loan volume, nonperforming loans and loan pricing. Respondents are also asked to report on their banking outlook and their evaluation of general business activity.
Survey responses are used to calculate an index for each indicator. Each index is calculated by subtracting the percentage of respondents reporting a decrease (or tightening) from the percentage reporting an increase (or easing). When the share of respondents reporting an increase exceeds the share reporting a decrease, the index will be greater than zero, suggesting the indicator has increased over the prior reporting period. If the share of respondents reporting a decrease exceeds the share reporting an increase, the index will be below zero, suggesting the indicator has decreased over the prior reporting period. An index will be zero when the number of respondents reporting an increase is equal to the number reporting a decrease.
Results summary
Historical data are available from March 2017.
| Total Loans: Over the past six weeks, how have the following changed? | |||||
| Indicator | Current Index | Previous Index | % Reporting Increase | % Reporting No Change | % Reporting Decrease |
Loan volume | –10.0 | 8.6 | 25.7 | 38.6 | 35.7 |
Loan demand | –7.1 | 14.3 | 24.3 | 44.3 | 31.4 |
Nonperforming loans | 14.3 | 1.5 | 25.7 | 62.9 | 11.4 |
Loan pricing | –52.2 | –24.2 | 0.0 | 47.8 | 52.2 |
| Indicator | Current Index | Previous Index | % Reporting Eased | % Reporting No Change | % Reporting Tightened |
Credit standards and terms | 0.0 | –4.7 | 4.6 | 90.8 | 4.6 |
| Commercial and Industrial Loans: Over the past six weeks, how have the following changed? | |||||
| Indicator | Current Index | Previous Index | % Reporting Increase | % Reporting No Change | % Reporting Decrease |
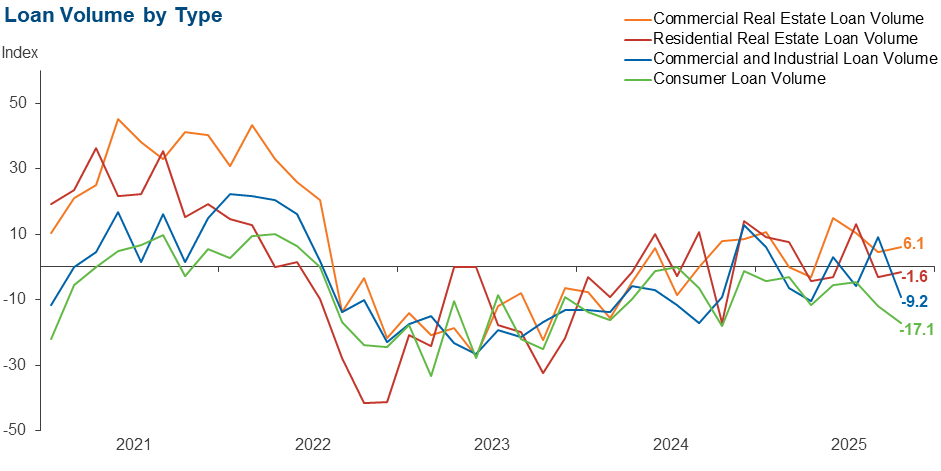
Loan volume | –9.2 | 9.2 | 15.4 | 60.0 | 24.6 |
Nonperforming loans | 7.8 | 3.1 | 10.9 | 85.9 | 3.1 |
| Indicator | Current Index | Previous Index | % Reporting Eased | % Reporting No Change | % Reporting Tightened |
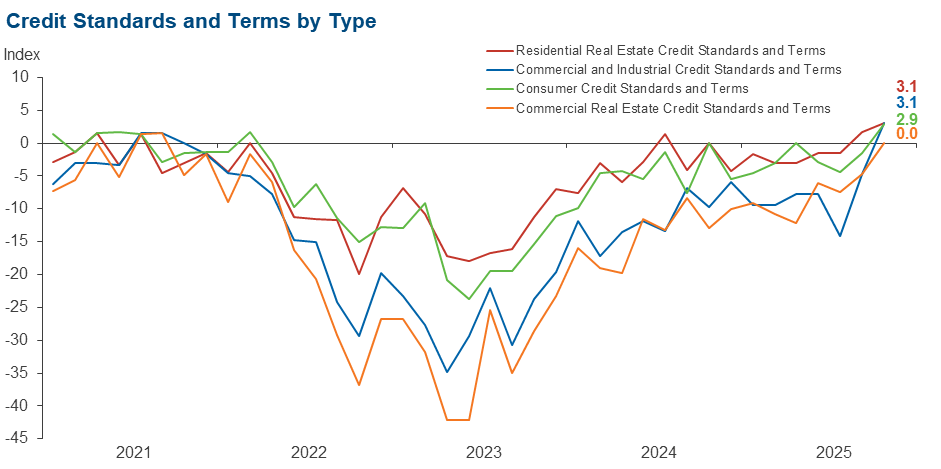
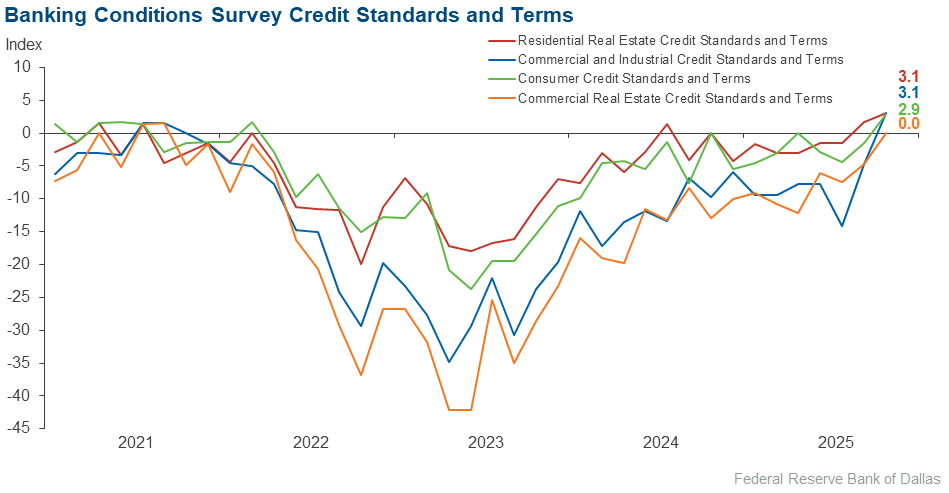
Credit standards and terms | 3.1 | –4.7 | 4.7 | 93.8 | 1.6 |
| Commercial Real Estate Loans: Over the past six weeks, how have the following changed? | |||||
| Indicator | Current Index | Previous Index | % Reporting Increase | % Reporting No Change | % Reporting Decrease |
Loan volume | 6.1 | 4.6 | 24.6 | 56.9 | 18.5 |
Nonperforming loans | 10.7 | –4.6 | 15.2 | 80.3 | 4.5 |
| Indicator | Current Index | Previous Index | % Reporting Eased | % Reporting No Change | % Reporting Tightened |
Credit standards and terms | 0.0 | –4.7 | 4.6 | 90.8 | 4.6 |
| Residential Real Estate Loans: Over the past six weeks, how have the following changed? | |||||
| Indicator | Current Index | Previous Index | % Reporting Increase | % Reporting No Change | % Reporting Decrease |
Loan volume | –1.6 | –3.0 | 24.2 | 50.0 | 25.8 |
Nonperforming loans | 6.1 | 1.5 | 9.1 | 87.9 | 3.0 |
| Indicator | Current Index | Previous Index | % Reporting Eased | % Reporting No Change | % Reporting Tightened |
Credit standards and terms | 3.1 | 1.6 | 3.1 | 96.9 | 0.0 |
| Consumer Loans: Over the past six weeks, how have the following changed? | |||||
| Indicator | Current Index | Previous Index | % Reporting Increase | % Reporting No Change | % Reporting Decrease |
Loan volume | –17.1 | –12.0 | 8.6 | 65.7 | 25.7 |
Nonperforming loans | 8.8 | 5.9 | 10.3 | 88.2 | 1.5 |
| Indicator | Current Index | Previous Index | % Reporting Eased | % Reporting No Change | % Reporting Tightened |
Credit standards and terms | 2.9 | –1.5 | 4.3 | 94.2 | 1.4 |
| Banking Outlook: What is your expectation for the following items six months from now? | |||||
| Indicator | Current Index | Previous Index | % Reporting Increase | % Reporting No Change | % Reporting Decrease |
Total loan demand | 26.1 | 36.2 | 47.8 | 30.4 | 21.7 |
Nonperforming loans | 14.7 | 13.1 | 26.5 | 61.8 | 11.8 |
| General Business Activity: What is your evaluation of the level of activity? | |||||
| Indicator | Current Index | Previous Index | % Reporting Better | % Reporting No Change | % Reporting Worse |
Over the past six weeks | 1.4 | 0.0 | 21.4 | 58.6 | 20.0 |
Six months from now | 20.0 | 14.3 | 38.6 | 42.9 | 18.6 |


Survey participants are given the opportunity to submit comments on current issues that may be affecting their businesses. Some comments have been edited for grammar and clarity.
- Tariffs and trade, government shutdown, regulatory regime and interest rates [are top concerns for us].
- The government shutdown is a big driver here, especially for consumers, investment real estate and commercial businesses that work with government contractors. Credit unions also remain a concern.
- We expect a recession in the next 12 months.
- South Texas in general is in the midst of a severe drought due to no rain and depleted reservoirs (down below 10 percent). We are looking at curtailment of water for both the citizens and industry in our area. Curtailment for industry will result in possible plant shutdowns and layoffs. While there are plans [to provide] future water supply by building desalination plants and using groundwater, there is no immediate fix. The situation is serious and getting worse by the day.
- Government shutdown has created additional uncertainty in business environment across our member base and has resulted in less external data available for forecasting and analysis purposes.
- The government shutdown is a major concern for families that live paycheck to paycheck.
Historical data can be downloaded dating back to March 2017. For the definitions, see data definitions.
NOTE: The following series were discontinued in May 2020: volume of core deposits, cost of funds, non-interest income and net interest margin.
Questions regarding the Banking Conditions Survey can be addressed to Mariam Yousuf at mariam.yousuf@dal.frb.org.
Sign up for our email alert to be automatically notified as soon as the latest Banking Conditions Survey is released on the web.